[Java][JMX][Monitoring] The ultimate monitoring of the JVM application - out of the box
Context
Most of the applications I saw were deployed at the virtual machine. Most of them used Spring Boot with Tomcat as a web server and Hikari as a connection pool. In this article I’m going to show you metrics from that technology. If you are using others, you need to find corresponding metrics by yourself. The JMX mbean names are taken from the Java 11 with the G1GC.
Mind that some of the following metrics may have no sense in the cloud.
Foreword
This article is very long because there are a lot of metrics that you should focus on. In my applications I have all of those metrics gathered in one dashboard. It is the first place I look when there is some outage. That dashboard doesn’t tell me the exact cause of the outage, but directs me to the source of the problem.
Hardware
Let’s start from the bottom. We have four crucial hardware components that almost all applications use:
- CPU
- RAM
- Disk
- Network
Mind that there are other components, like disk controllers, bridges and so on, but I’m going to focus on those four.
CPU
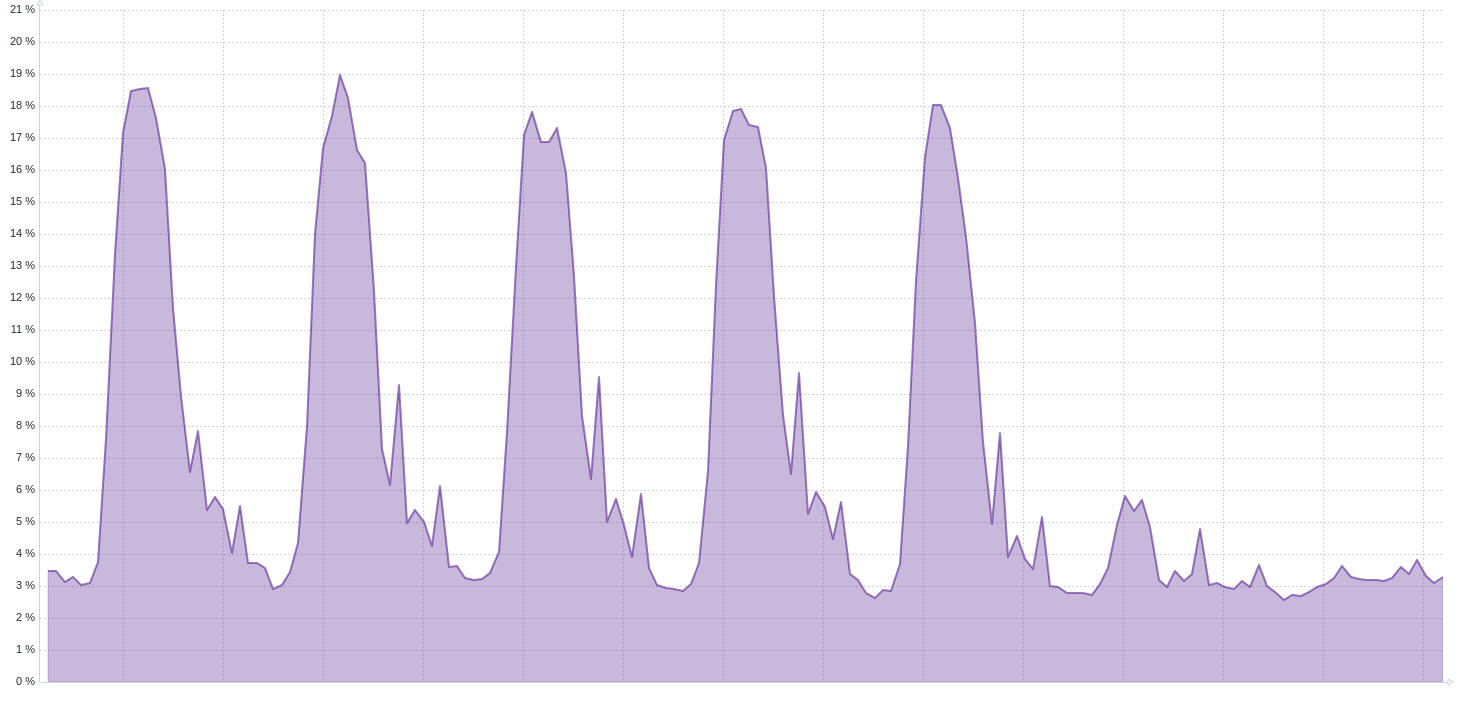
CPU utilization chart (7 days)
Possible failures:
- The 100% utilization of all cores
- The 100% utilization of one core
In this situation you need to check if that resource is utilized by your JVM. The first one can be easily diagnosed by
JMX, I’m going to cover that later. The second one I usually diagnose at OS level using pidstat -t <time interval>.
RAM
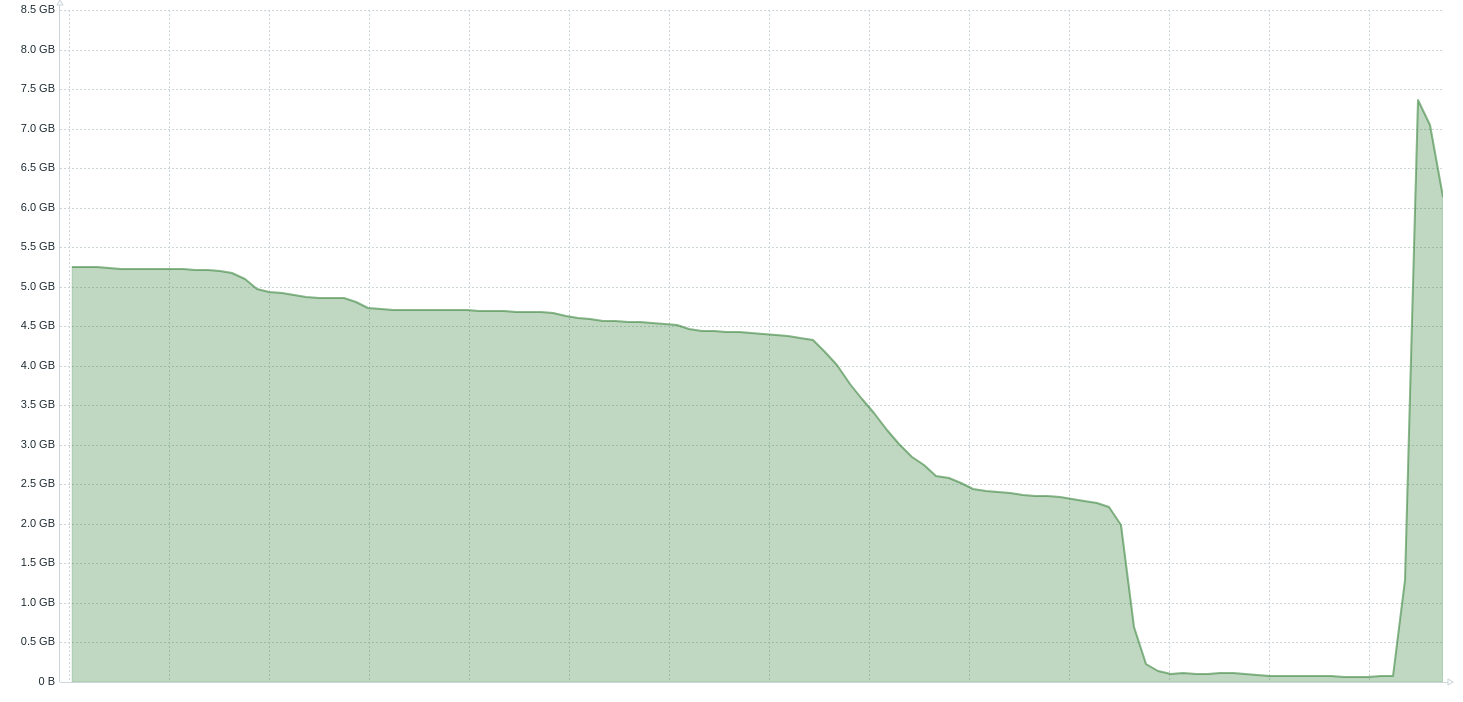
Available memory chart (7 days)
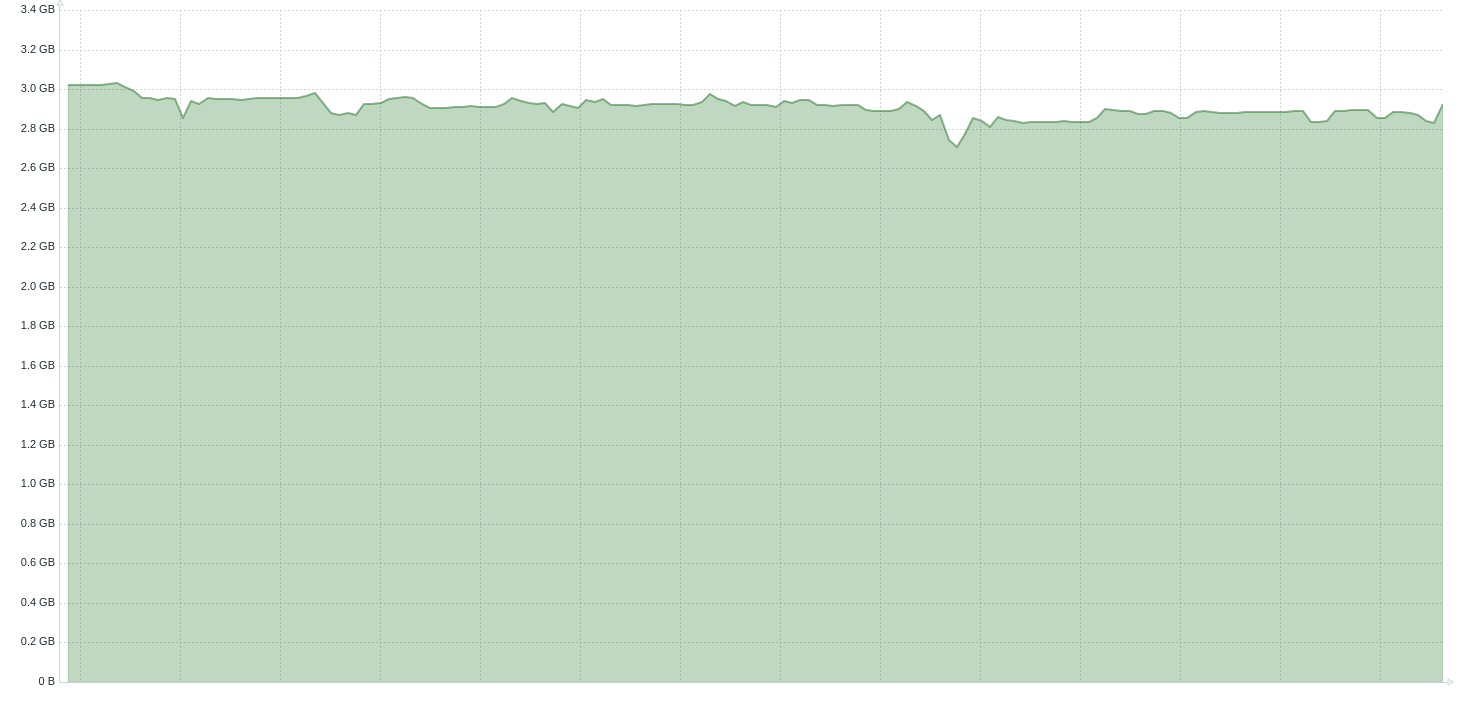
You need to understand the difference between available and free memory. I suggest you read the beginning
of the man free at Linux. Long story short, your OS has internal caches and buffers. Those are used to help
the performance of your application. Your OS can use them if there is enough memory available. If your application
needs the memory used before by cache/buffer, the OS will remove that cache/buffer to make that memory available for
you.
Simplifying:
- Available memory - how much memory is available for your application
- Free memory - how much memory is not used by any application and OS
Possible failures:
- 0 bytes of the available memory - this is a situation where out-of-memory killer kicks in
- The available memory drops to the level, where crucial cache/buffer is removed
The first situation is shown in the second chart above. The available memory dropped to 0, OOM killer killed the JVM. In that situation you need to check the OS logs to find out which process ate that memory.
The second situation is easy to diagnose when you look also at your next resource.
Disk
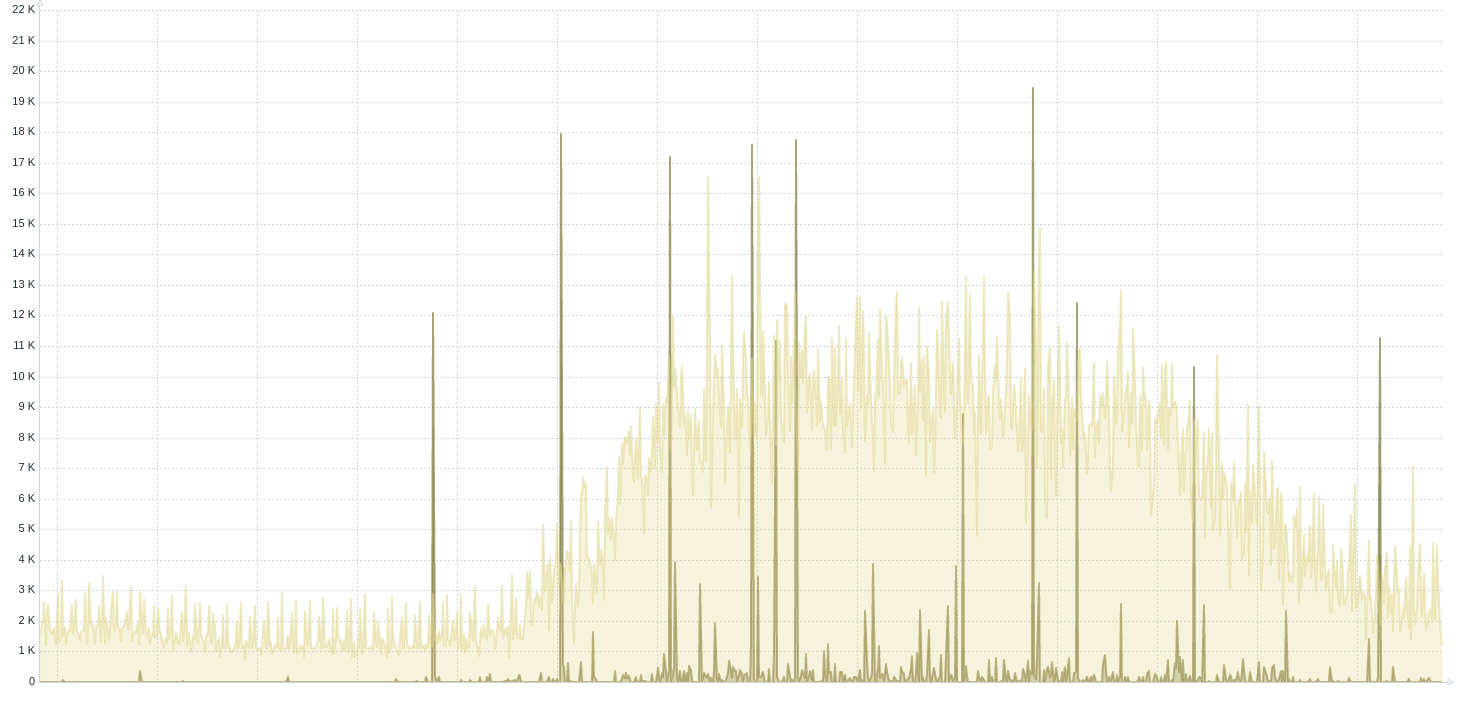
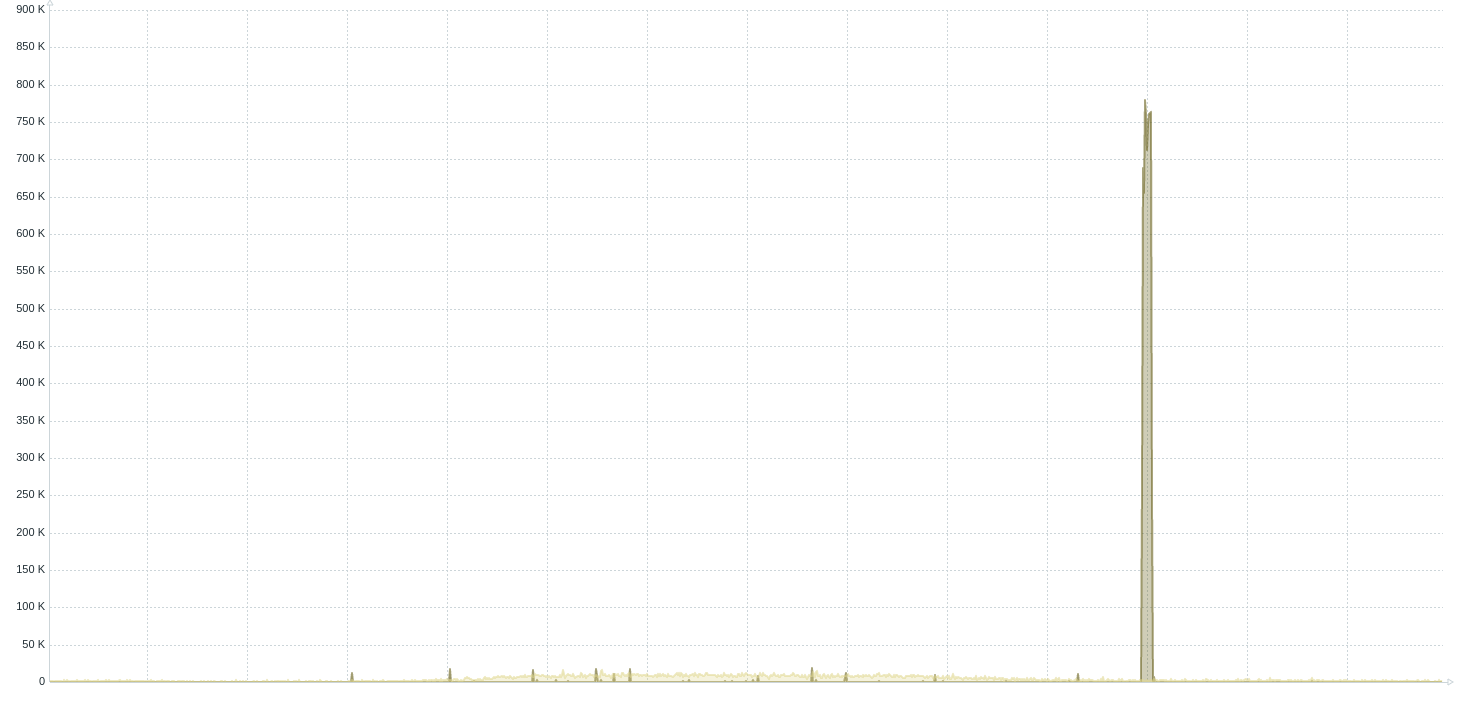
IO operations (reads/writes) chart (1 day)
Possible failures:
- Huge increase of IO operations
The IO operations don’t appear out of nowhere. If the increase of IO reads is correlated with reduction of available memory then you probably have a situation where a crucial cache/buffer is removed (shown at second chart above). In that situation you need to check RAM consumption to check which process eats the memory.
The increase of IO operations can be done by your JVM, you can check it with pidstat -d <time interval> at Linux.
If that is your problem I suggest using the async-profiler in wall mode. With that profiler you can easily find
the part of your code that is using the IO.
Network
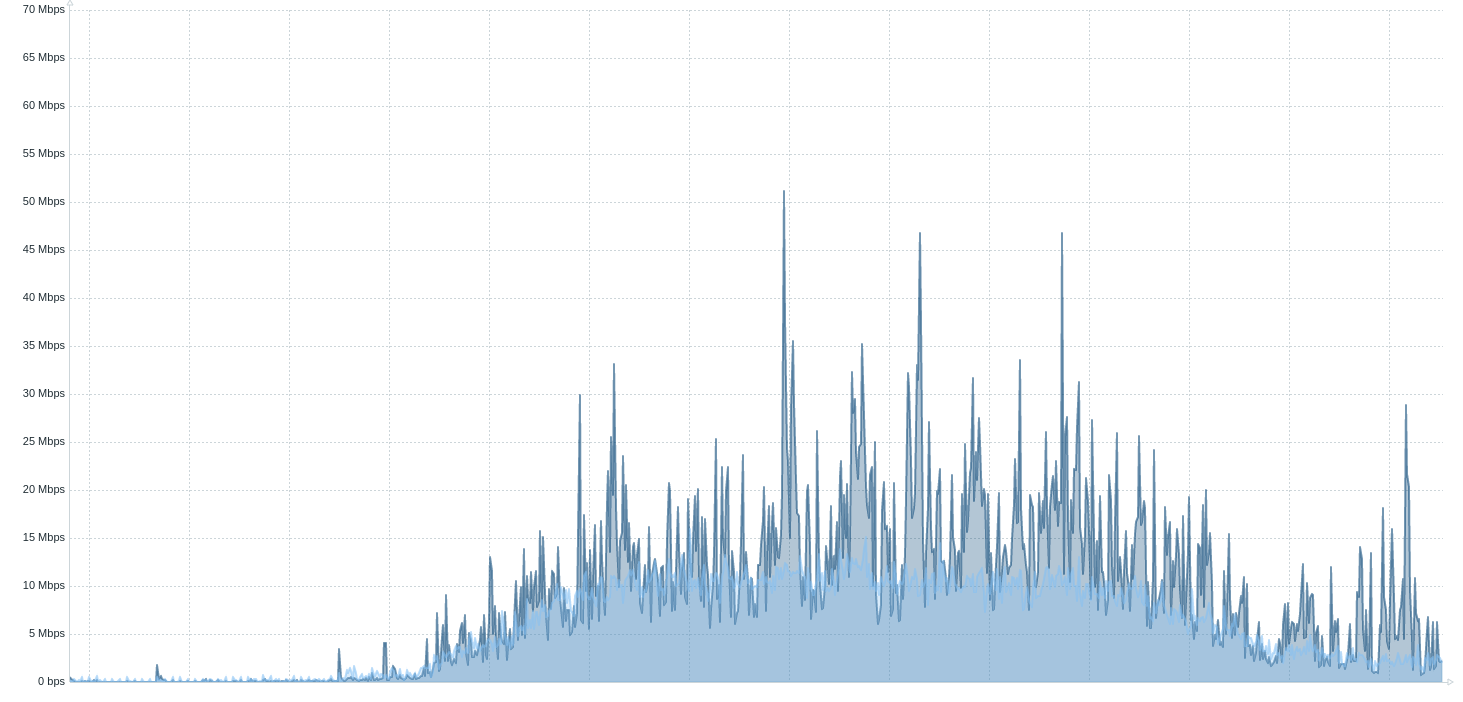
Net transfer (in/out) chart (1 day)
Possible failures:
- Huge increase of the traffic
- No traffic
In the first situation first you need to check if that traffic is done by your JVM. There are multiple tools to
check it, I like the nethogs. If that traffic is generated by the JVM then, again, the async-profiler
at wall mode is going to show you what part of your application generates it.
If there is no traffic, then:
- You should check your health check endpoint if this is a way you inform other applications about the availability of your system
- You should check your service discovery/load balancer if you are using one, maybe there is some failure
JVM (from JMX)
CPU (again)
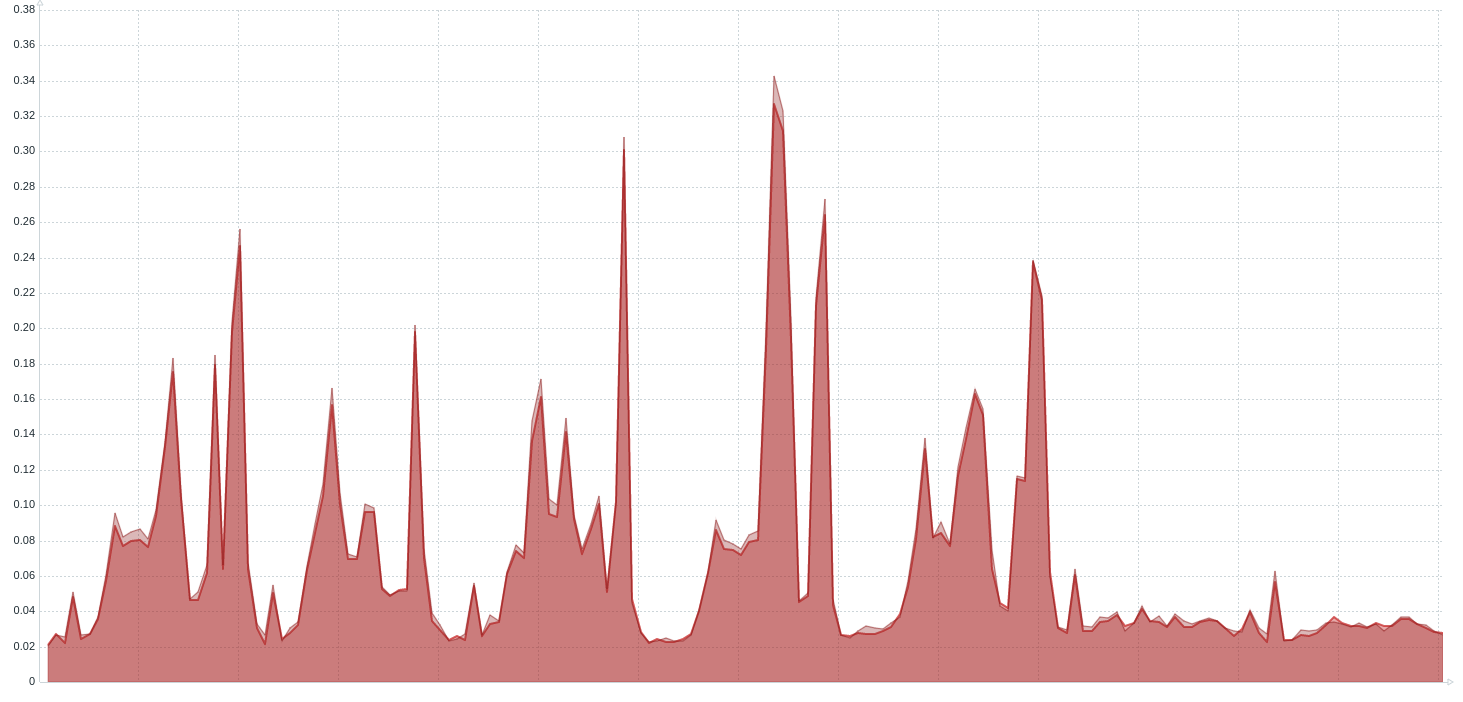
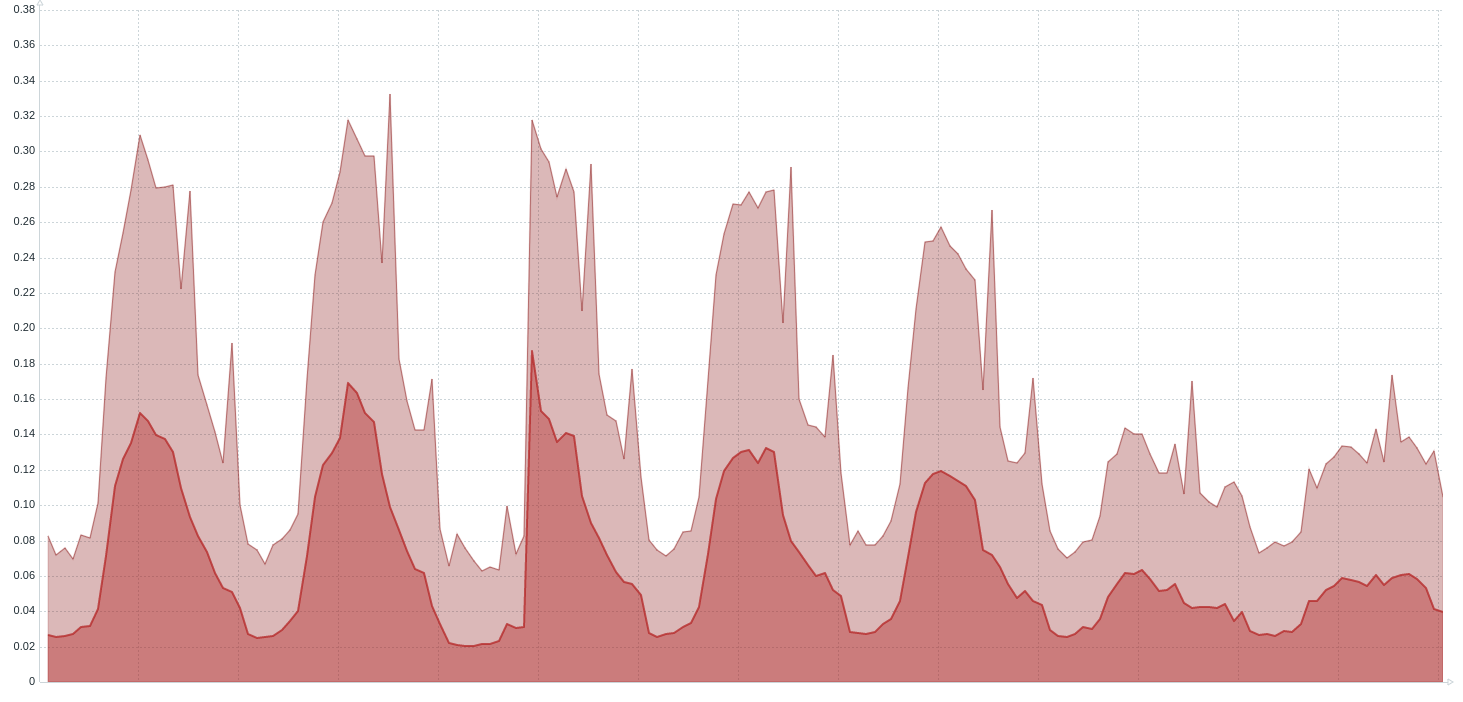
CPU utilization chart (7 days)
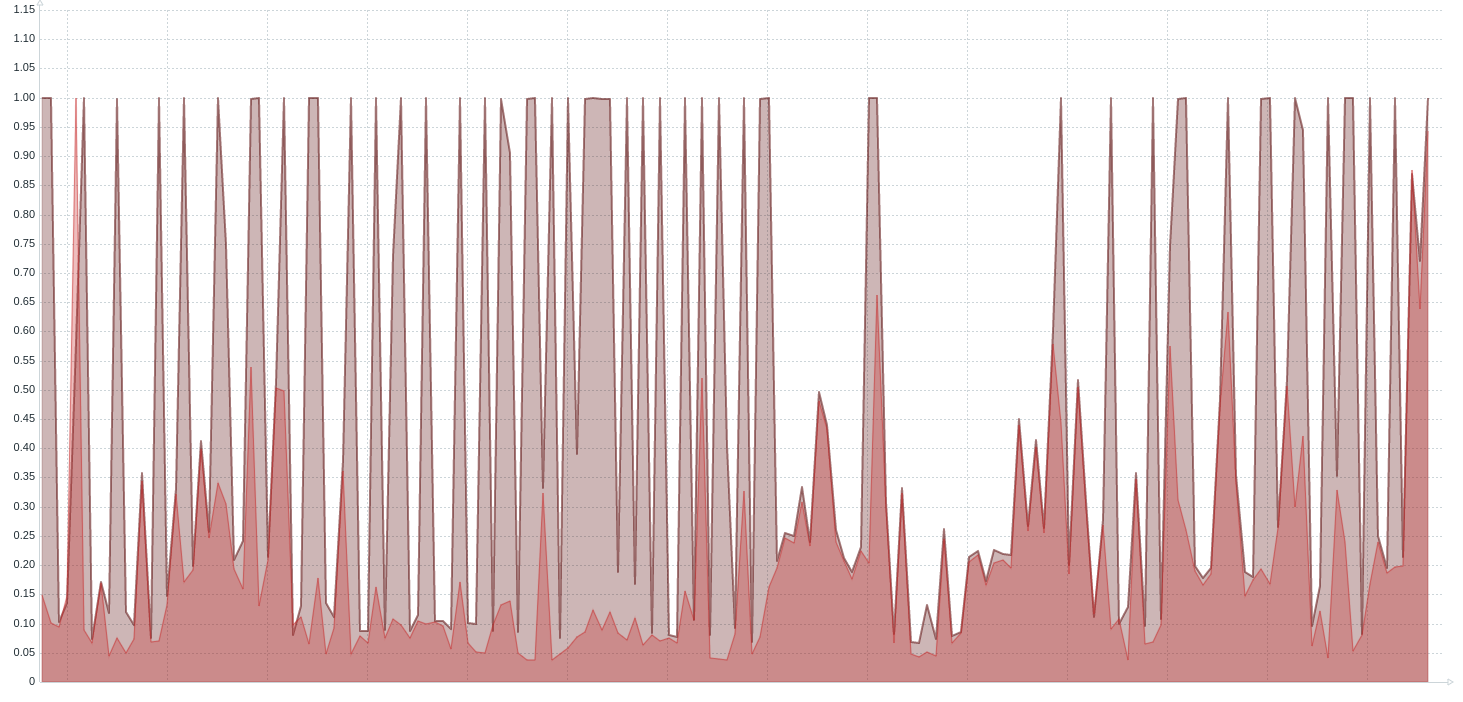
- Object name -
java.lang:type=OperatingSystem - Attributes -
SystemCpuLoadandProcessCpuLoad
The JVM reports through the JMX two metrics, the CPU utilization from OS level (which is the same as the first metric in this article), and how much of that utilization is done by that JVM. Comparing those two values can give you the information if your application is responsible for the utilization. The last chart above shows the case where the application cannot perform well, because another process consumes a whole CPU.
Heap after GC
I’ve already written why that metric is useful in the previous article.
Heap after GC chart (7 days)
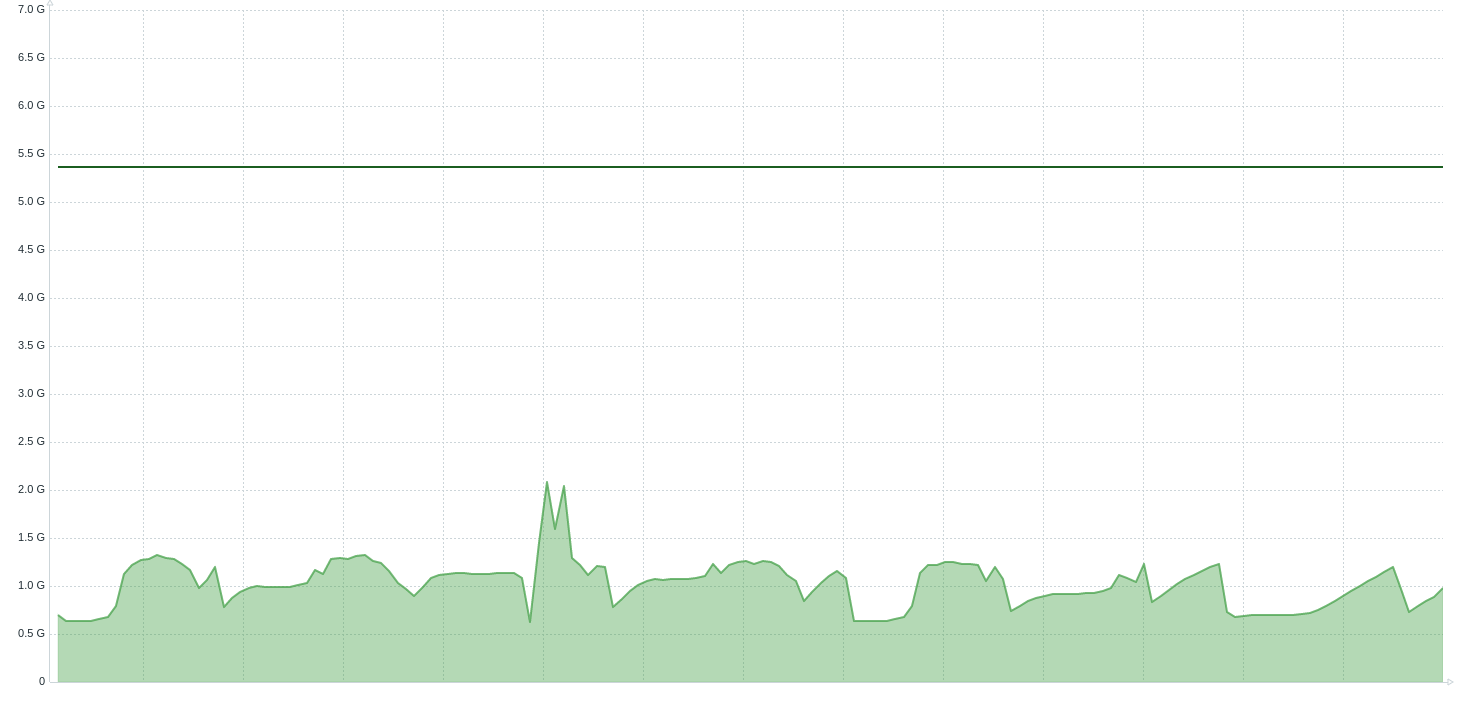
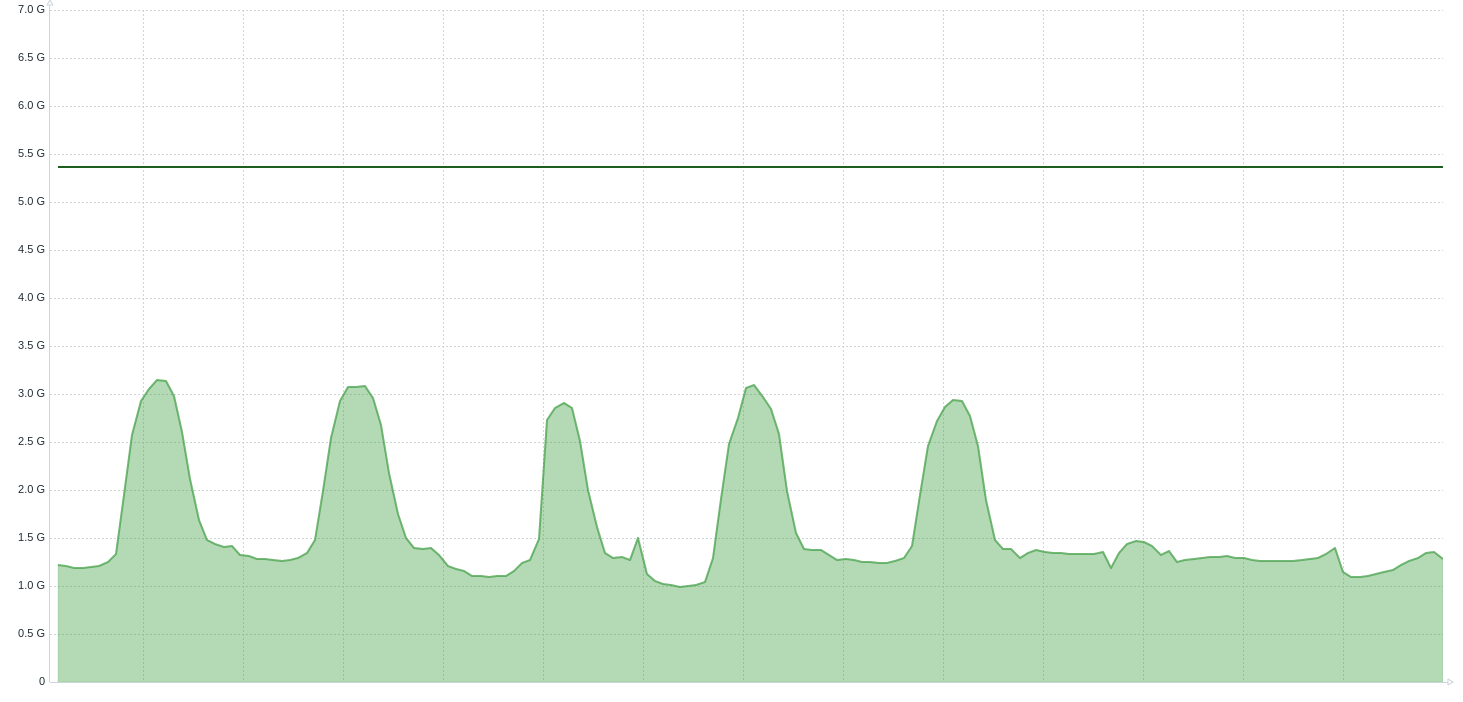
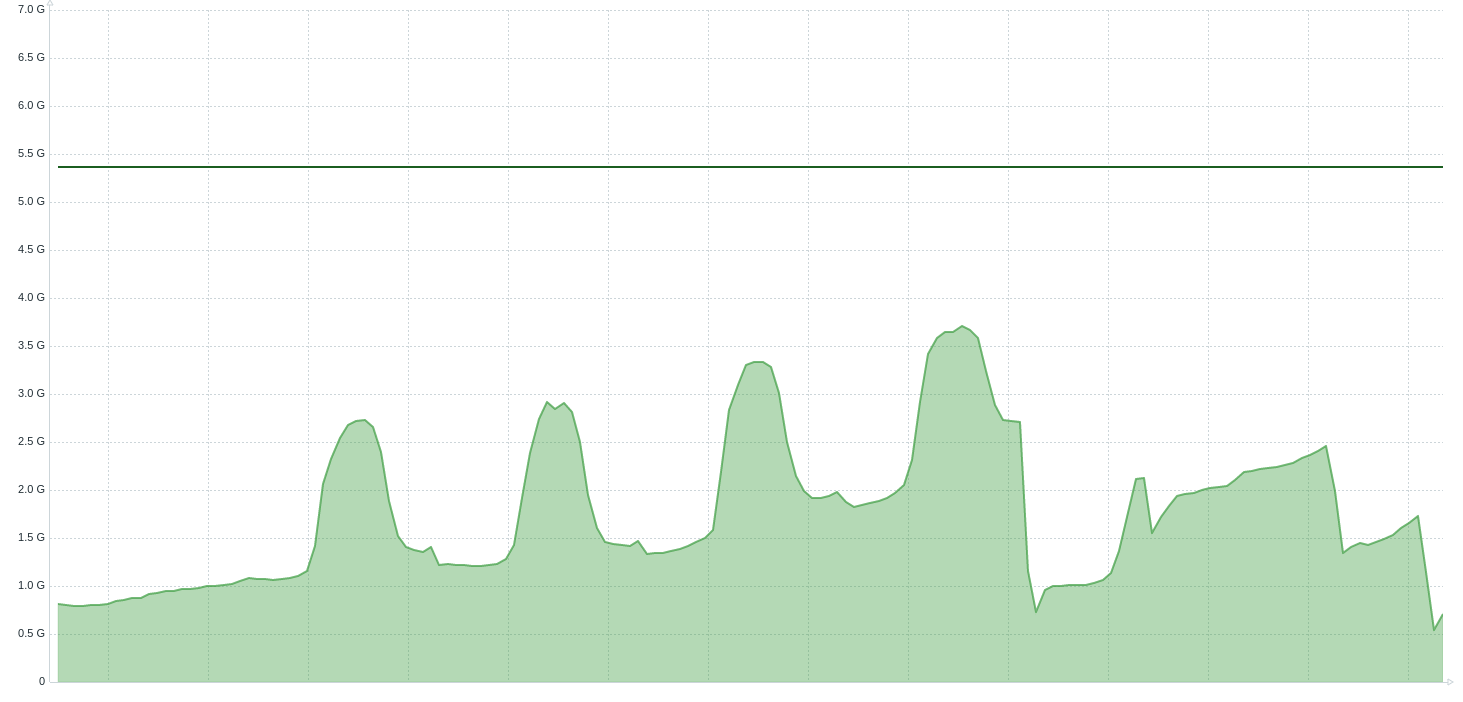
The committed, and the max heap size can be obtained from:
- Object name -
java.lang:type=Memory - Attribute -
HeapMemoryUsage- a complex type withmaxandcommittedattributes
The heap after GC can be obtained from:
- Object name -
java.lang:name=G1 Young Generation,type=GarbageCollector - Attribute -
LastGcInfo- a complex type withmemoryUsageAfterGcattribute
I use that chart to find out if there is a heap memory leak. Check the previous article for details. The last chart above shows the memory leak. If you have a memory leak in your application then you have to analyze the heap dump.
Heap before GC
I’ve already written why that metric is useful in the previous article.
Heap before GC chart (7 days)
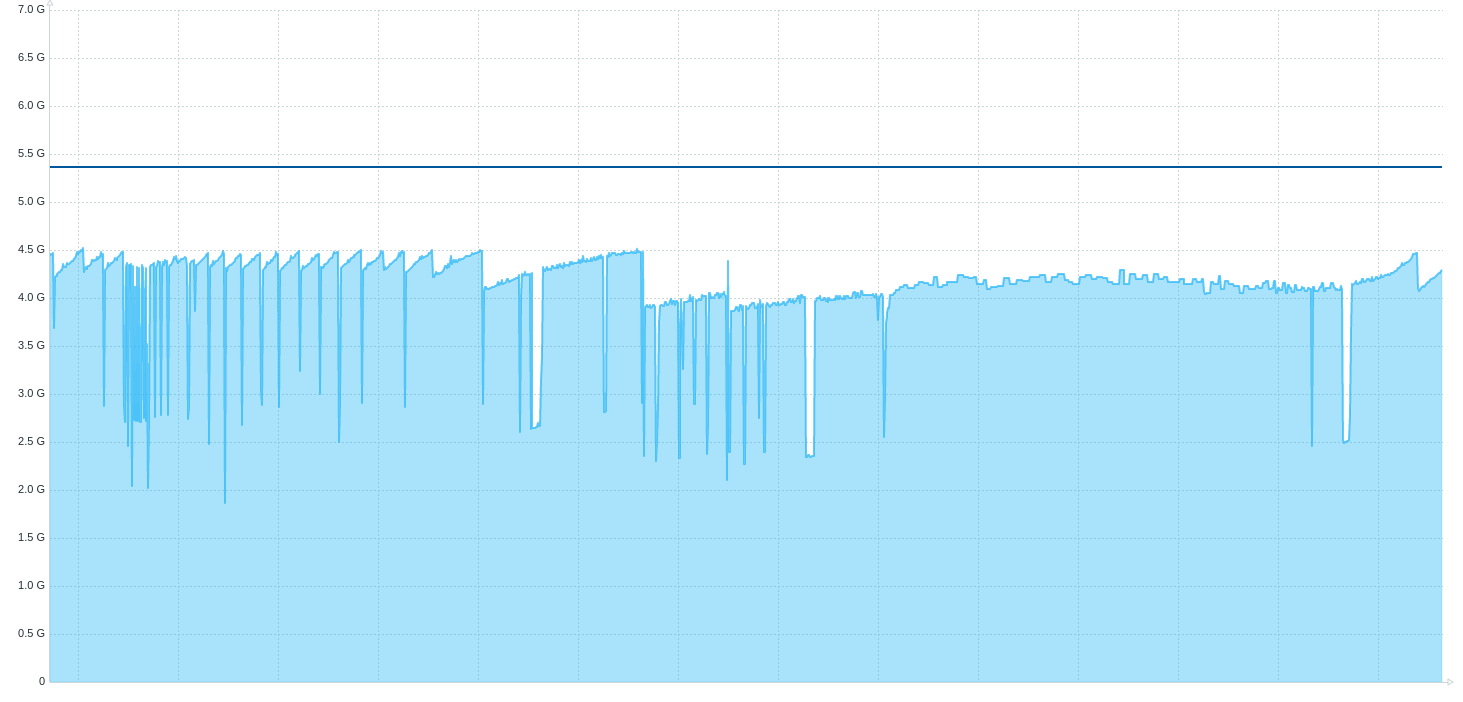
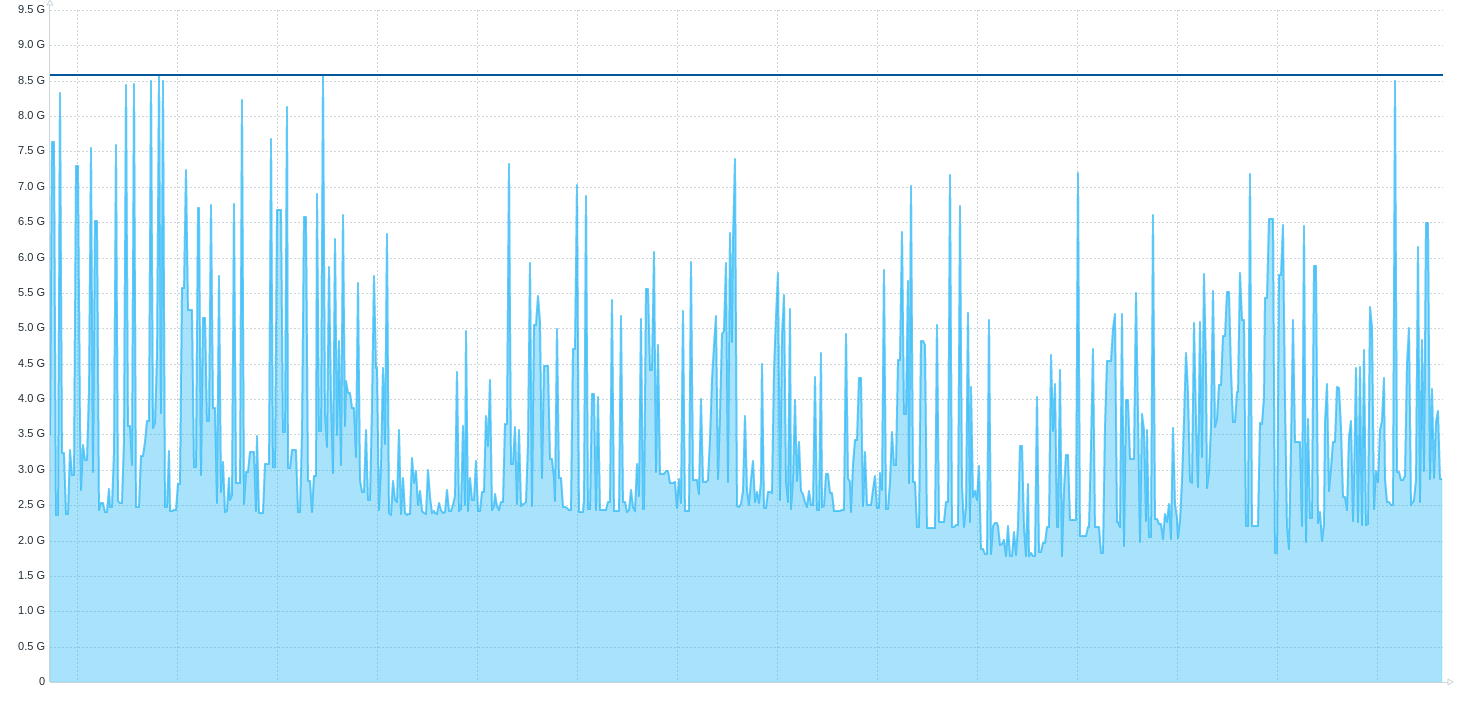
The committed, and the max heap size can be obtained from:
- Object name -
java.lang:type=Memory - Attribute -
HeapMemoryUsage- a complex type withmaxandcommittedattributes
The heap before GC can be obtained from:
- Object name -
java.lang:name=G1 Young Generation,type=GarbageCollector - Attribute -
LastGcInfo- a complex type withmemoryUsageBeforeGcattribute
I use that chart to find out if the heap is wasted, because the GC starts its work too early. Check the previous article for details. The second chart above shows the application where the GC runs inefficiently. If you have such a situation then you need to analyze the GC log.
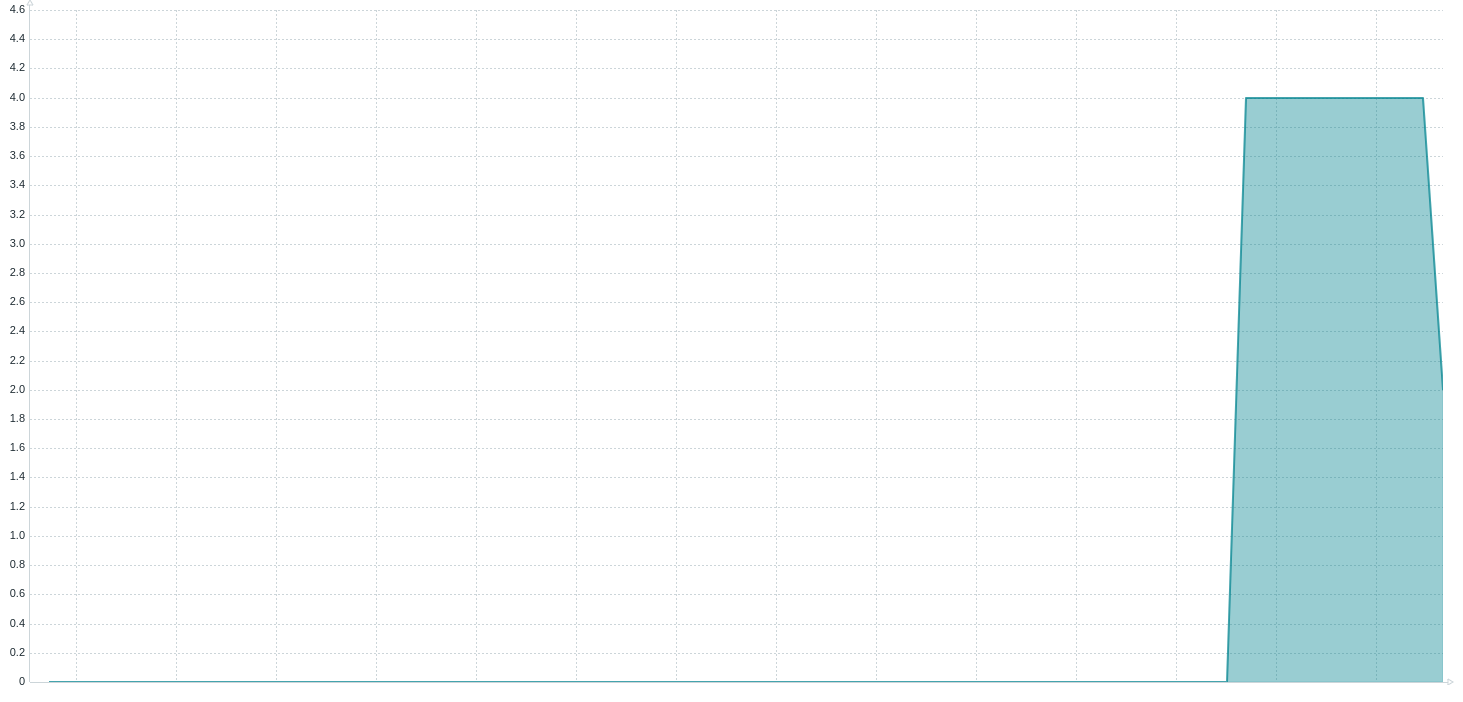
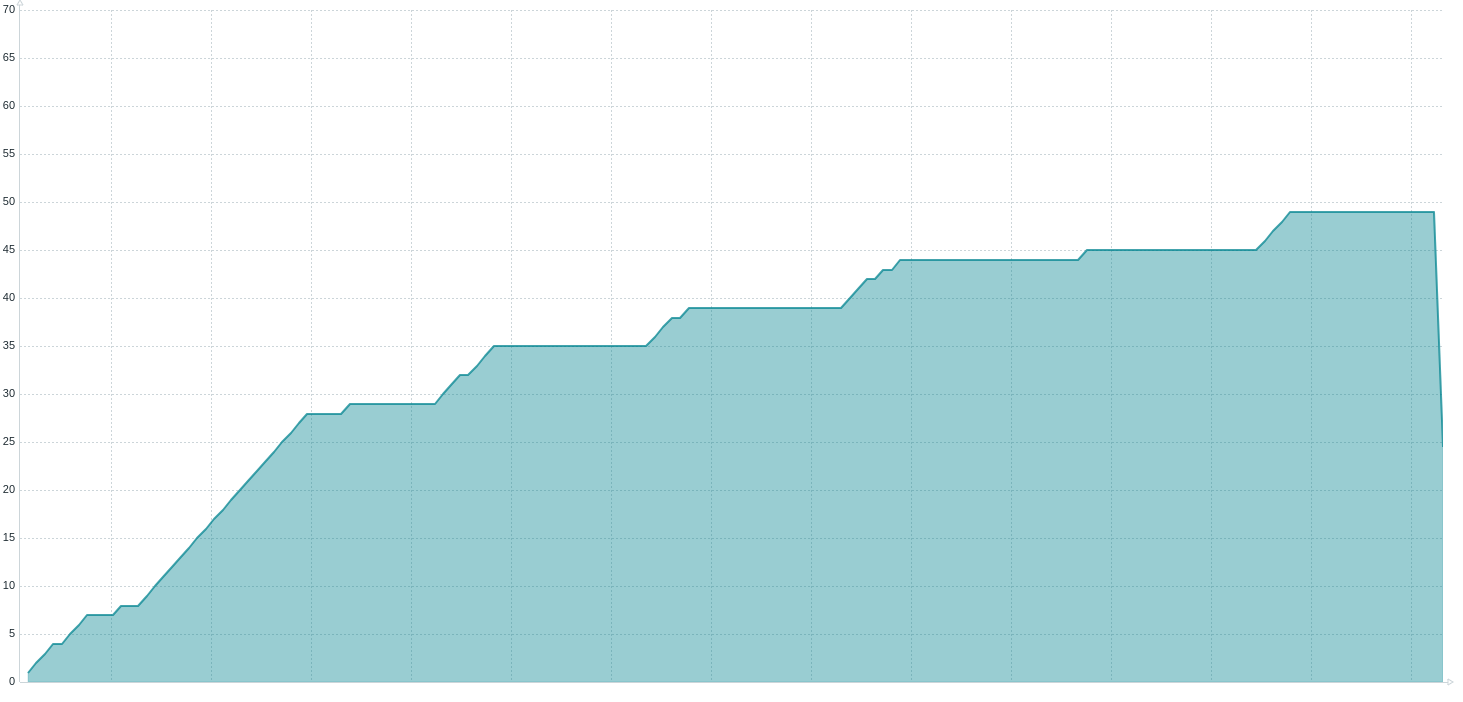
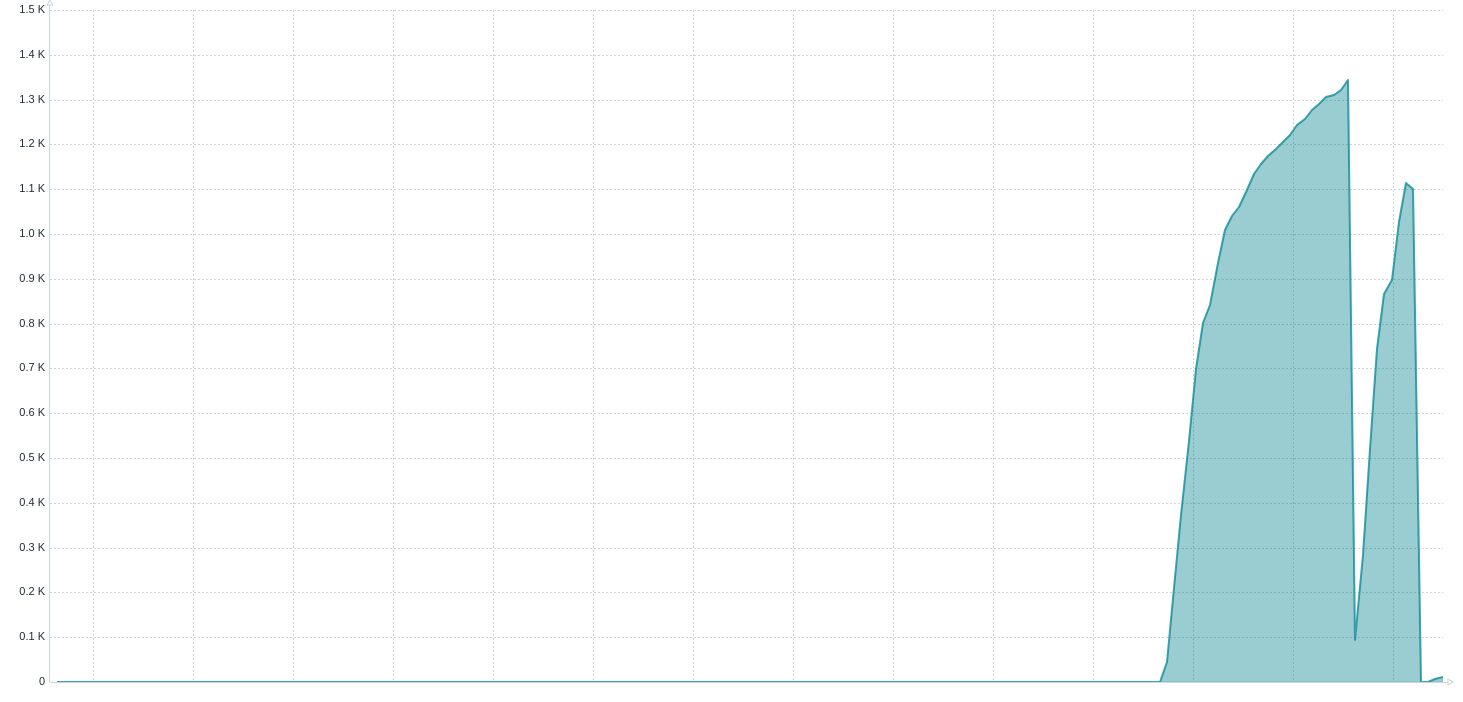
Full GC count (G1GC)
Full GC count chart (7 days)
- Object name -
java.lang:name=G1 Old Generation,type=GarbageCollector - Attributes -
CollectionCount
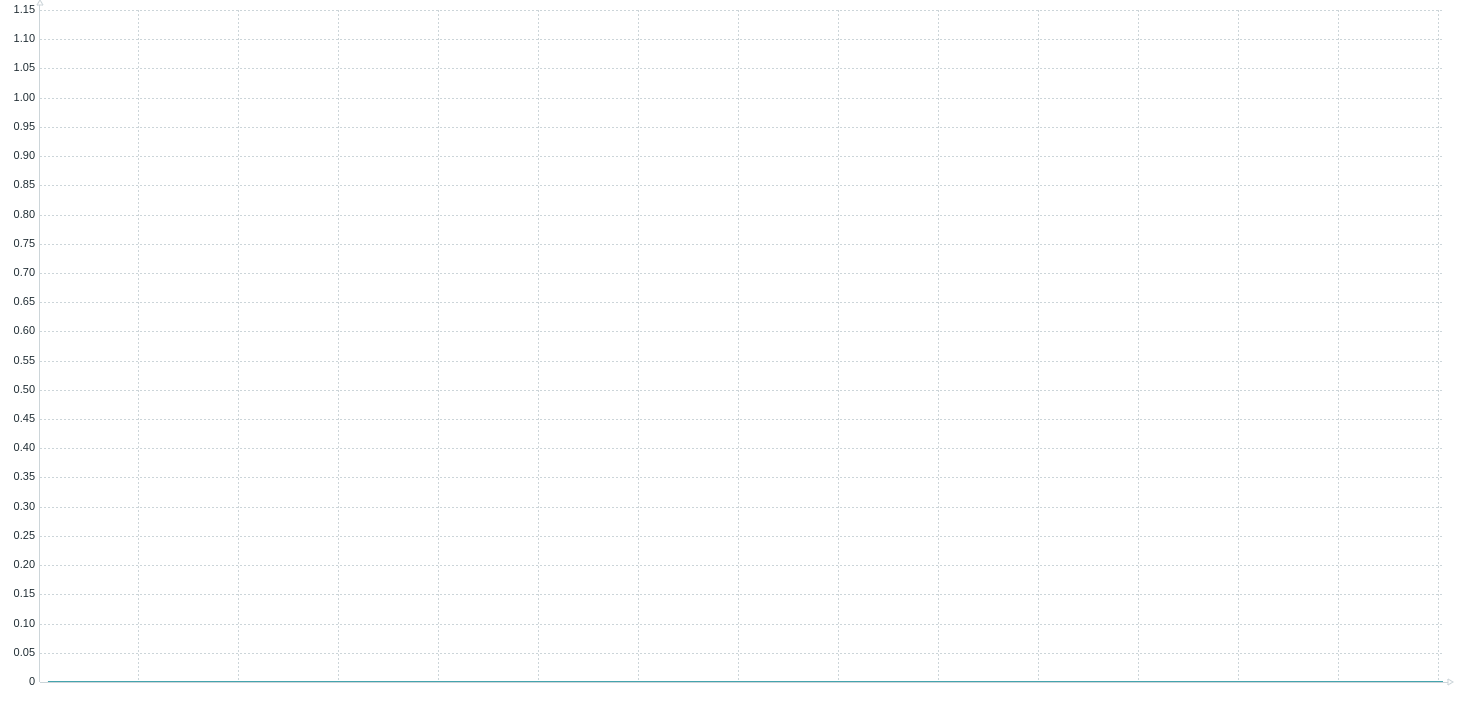
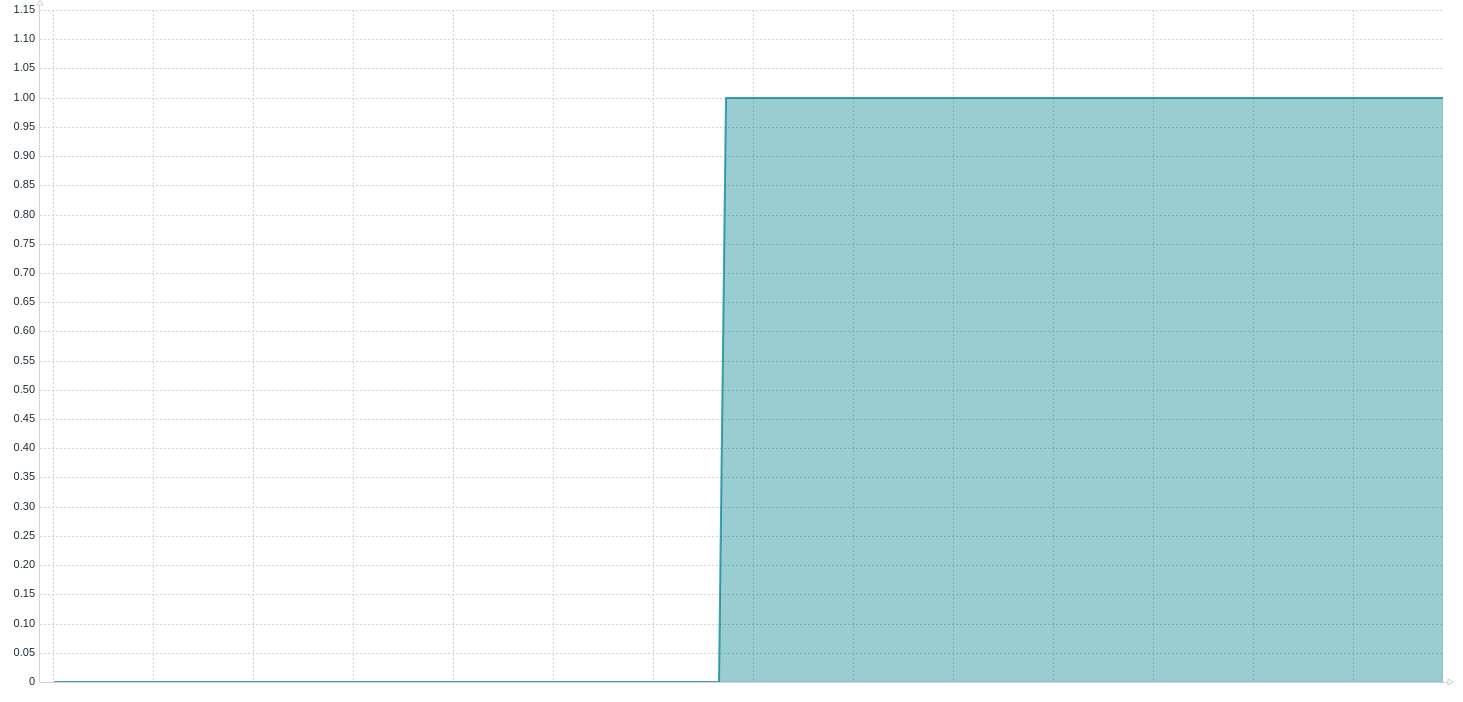
The best situation is presented at the first chart: 0 full GCs. Possible failures:
- Single Full GC (second chart) - for the most of the applications this is not a problem, but yours might be different
- Few Full GCs in a short period (third chart)
- Periodic Full GC (forth chart) - covered in the previous article
- Multiple Full GCs (fifth chart)
If you have a first situation, and it is a problem for you then you need to analyze GC logs. This is a place with information why the G1GC has to run that phase.
If you have a second situation, it usually means that your application runs a part of code that needs almost all the free heap. What I usually do in that situation is to check the access log, and the application log to find out what was going on in the time of full GCs. The continuous profiling is also useful in that case.
The last situation usually means that your application runs a part of code that needs more heap than you have. It usually
ends with OutOfMemoryError. I strongly recommend you to enable -XX:+HeapDumpOnOutOfMemoryError, it will
dump you a heap dump when such a situation occurs, which is the best way to find the cause of it.
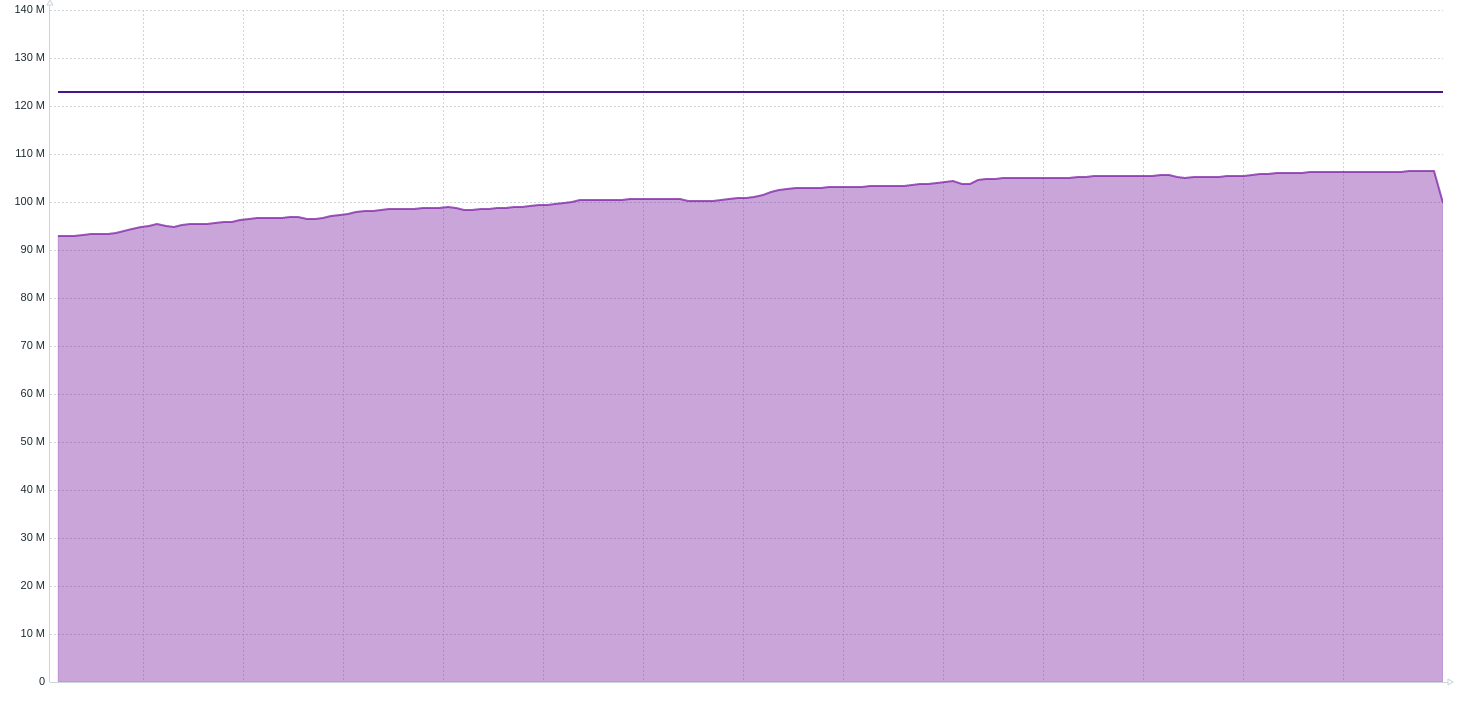
Code cache size
Code cache size chart (7 days)
- Object name -
java.lang:name=CodeHeap 'non-profiled nmethods',type=MemoryPoolandjava.lang:name=CodeHeap 'profiled nmethods',type=MemoryPool - Attributes -
Usage- a complex type withmaxandcommittedattributes
Possible failures:
- Not enough code cache for a new compilation
The code cache contains the JIT compilations. If that part of memory cannot fit a new compilation then the whole JIT disables. After that, your application starts degrading the performance. You need to remember that the code cache can be fragmented. As a rule of thumb I assume that if the application uses >=90% of that part of a memory, then that part needs to be increased.
Off-heap usage
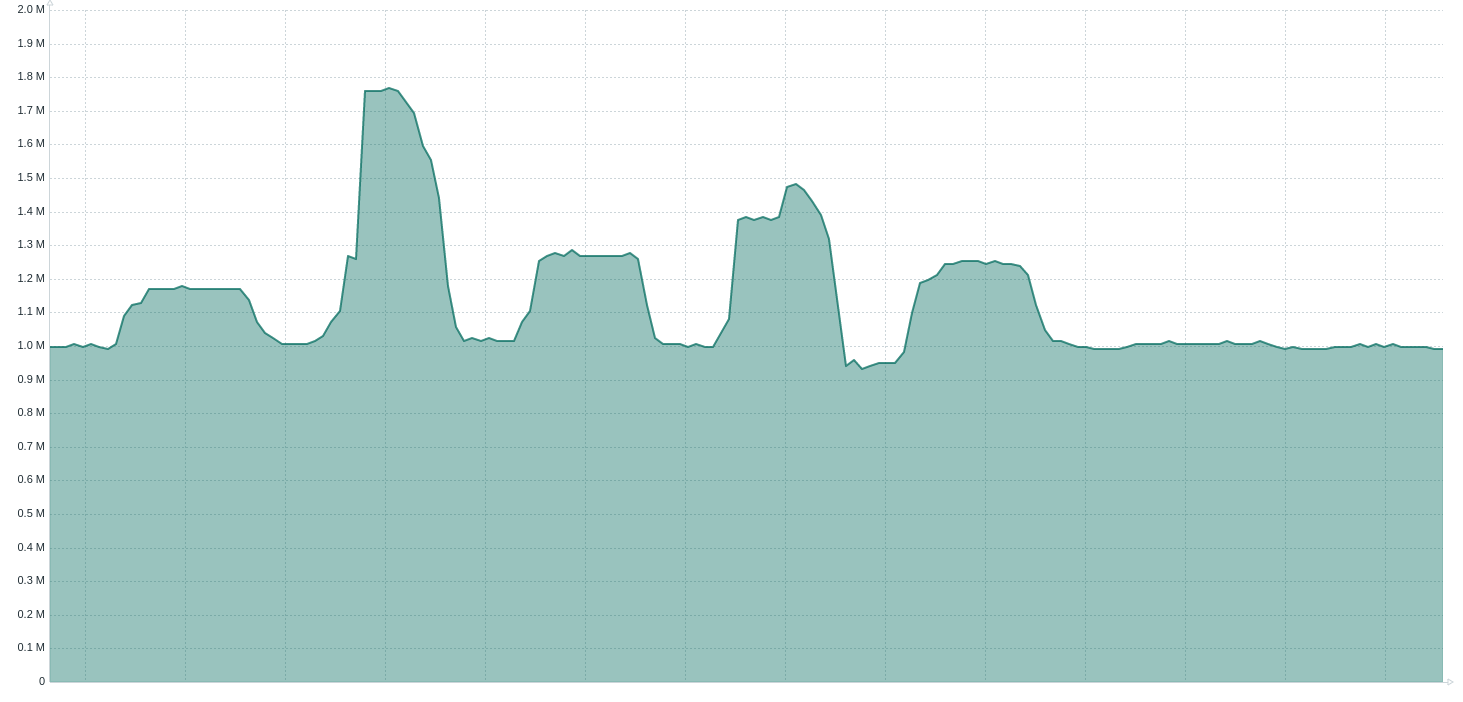
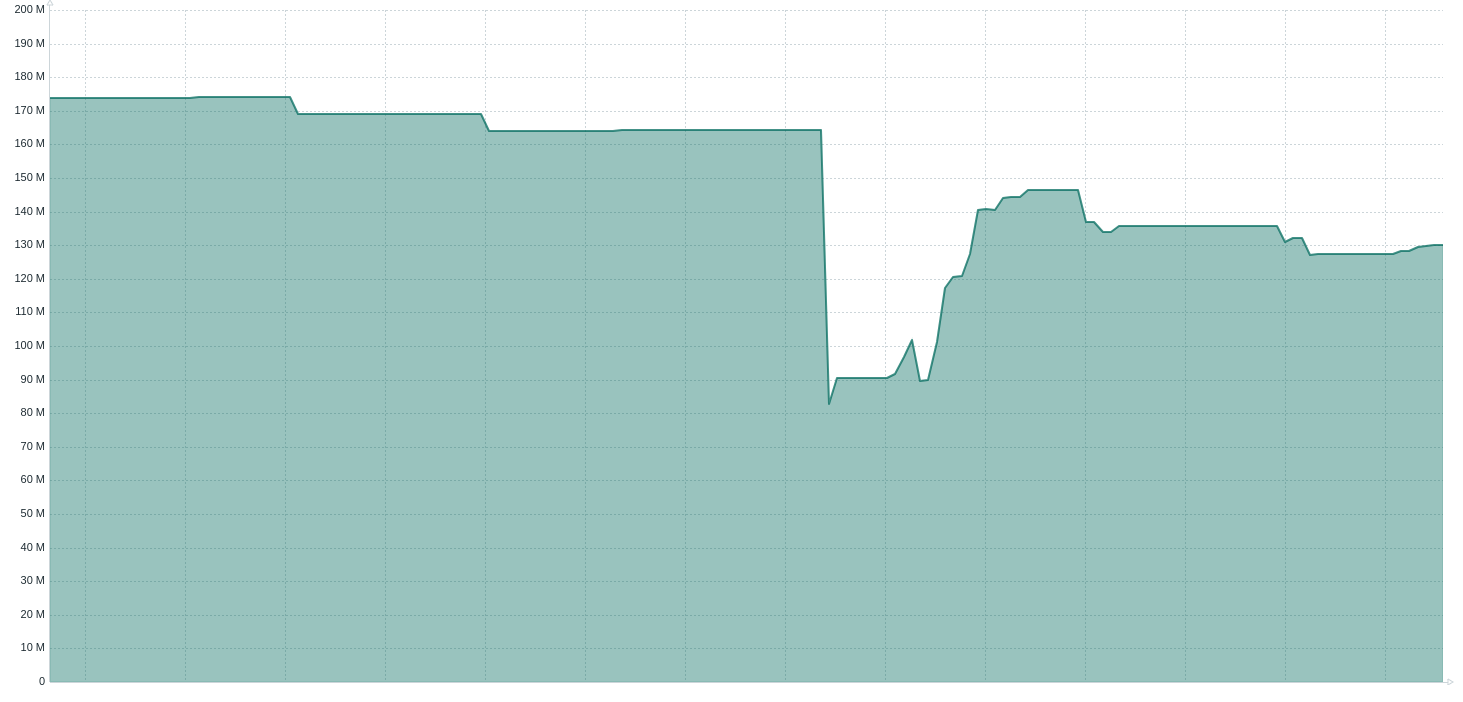
Off-heap usage charts (7 days)
- Object name -
java.nio:name=direct,type=BufferPoolandjava.nio:name=mapped,type=BufferPool - Attributes -
MemoryUsed
Possible failures:
- Too much memory allocated
Most of the time the off-heap is used by frameworks/libraries. Those metrics are useful for control, if there is no memory leak in this area.
To find out what part of your code allocates the memory with these two mechanisms you can use:
- Heap dump for
DirectByteBuffer - Heap dump and
pmapfrom OS level forFileChannel
Loaded class count
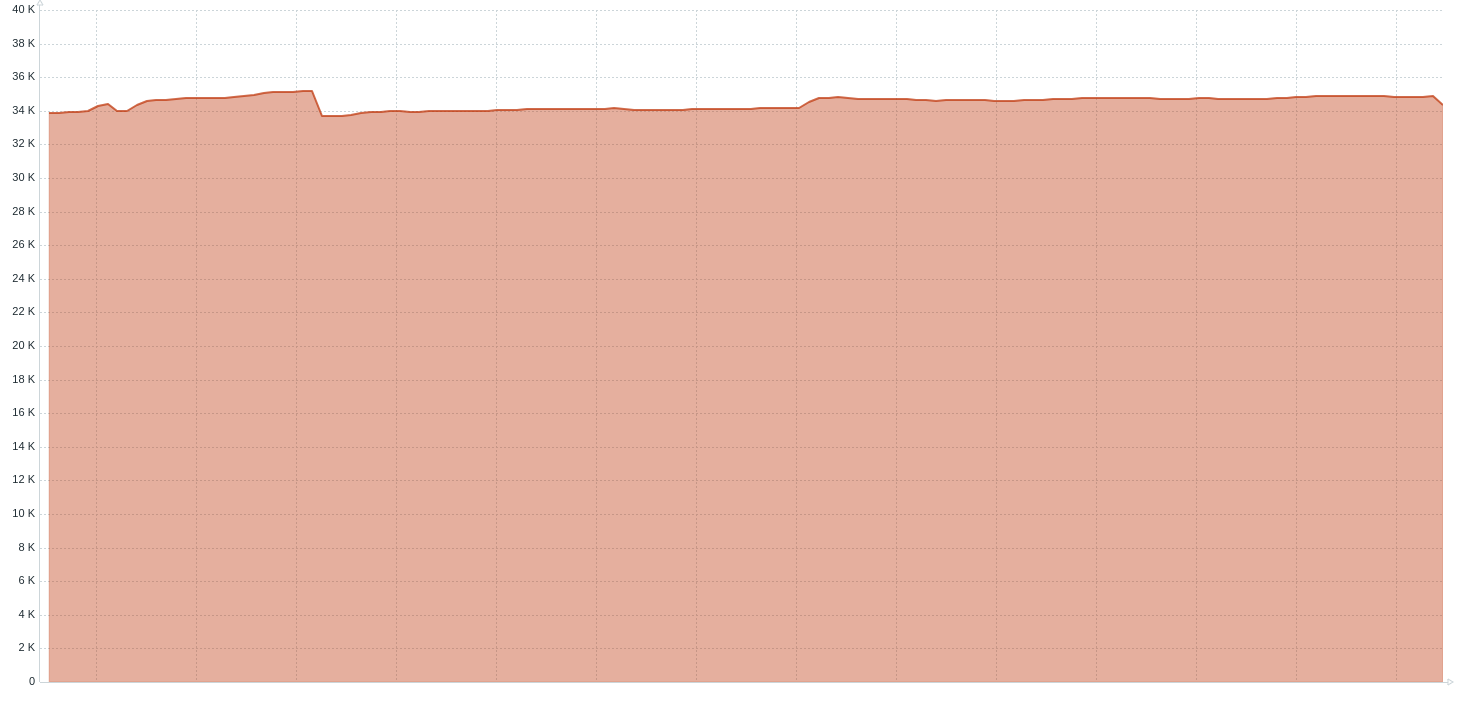
Loaded class count chart (7 days)
- Object name -
java.lang:type=ClassLoading - Attributes -
LoadedClassCount
Possible failures:
- Memory leak at Metaspace
This problem was common in EJB servers. If you do not use hot swap, context reload, there is a little chance you have this leak. You need to remember that it is completely normal for that chart to be ascending. There are mechanisms (like the evil reflection) which create classes at runtime. If you think there is a memory leak the first think you should look at are classloader logs.
The heap dump is also useful in that situation. It contains all class definitions and can tell you why they are alive.
Hikari active connection count
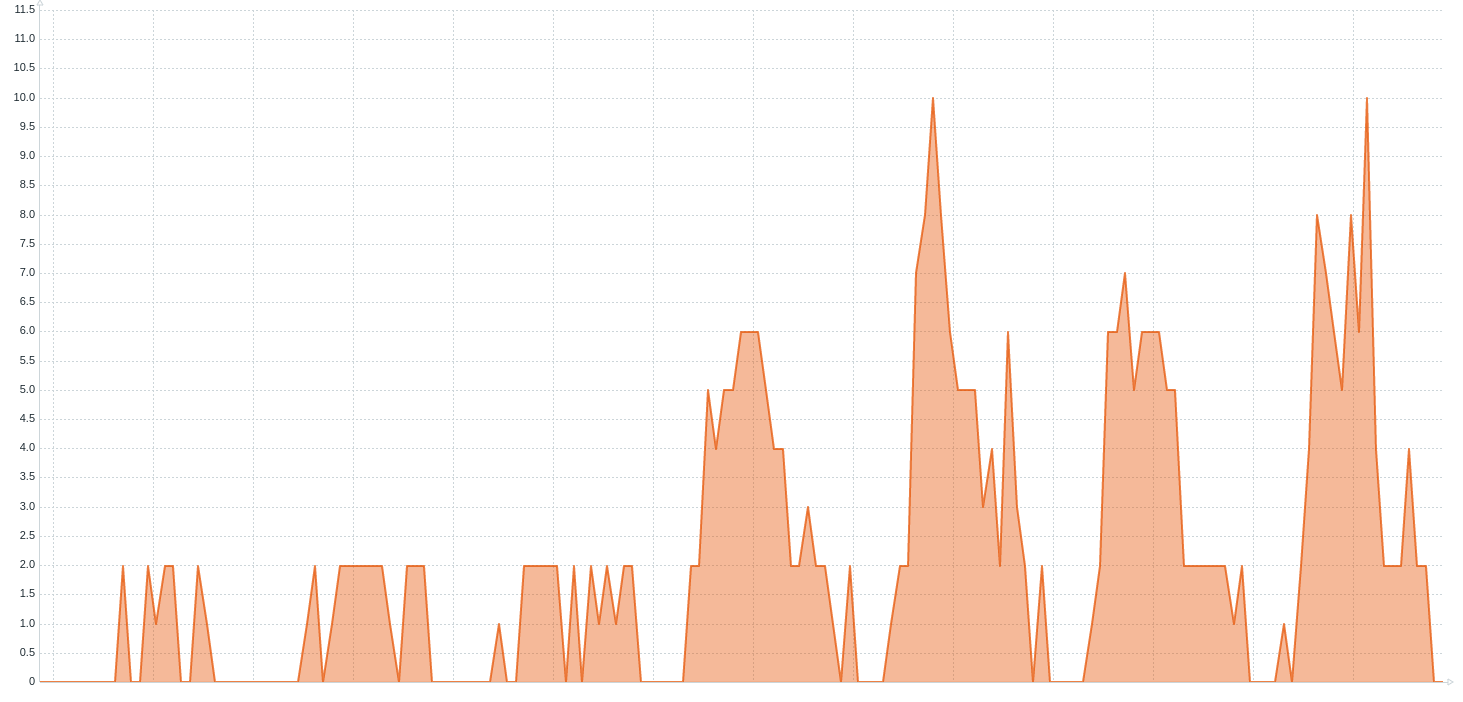
Hikari active connection count chart (7 days)
- Object name -
com.zaxxer.hikari:type=Pool (<pool name>) - Attributes -
ActiveConnections
This metric is useful for scaling and sizing your application. It tells you how many active connections you need to
your database. If this value is too big for you, your code may spend too much time with the opened transaction. The way
I’m finding such a situation in Spring framework is to take output for async-profiler in wall mode and
look for long methods covered with invokeWithinTransaction method.
Hikari threads awaiting connection
Hikari threads awaiting connection chart (7 days)
- Object name -
com.zaxxer.hikari:type=Pool (<pool name>) - Attributes -
ThreadsAwaitingConnection
Possible failures:
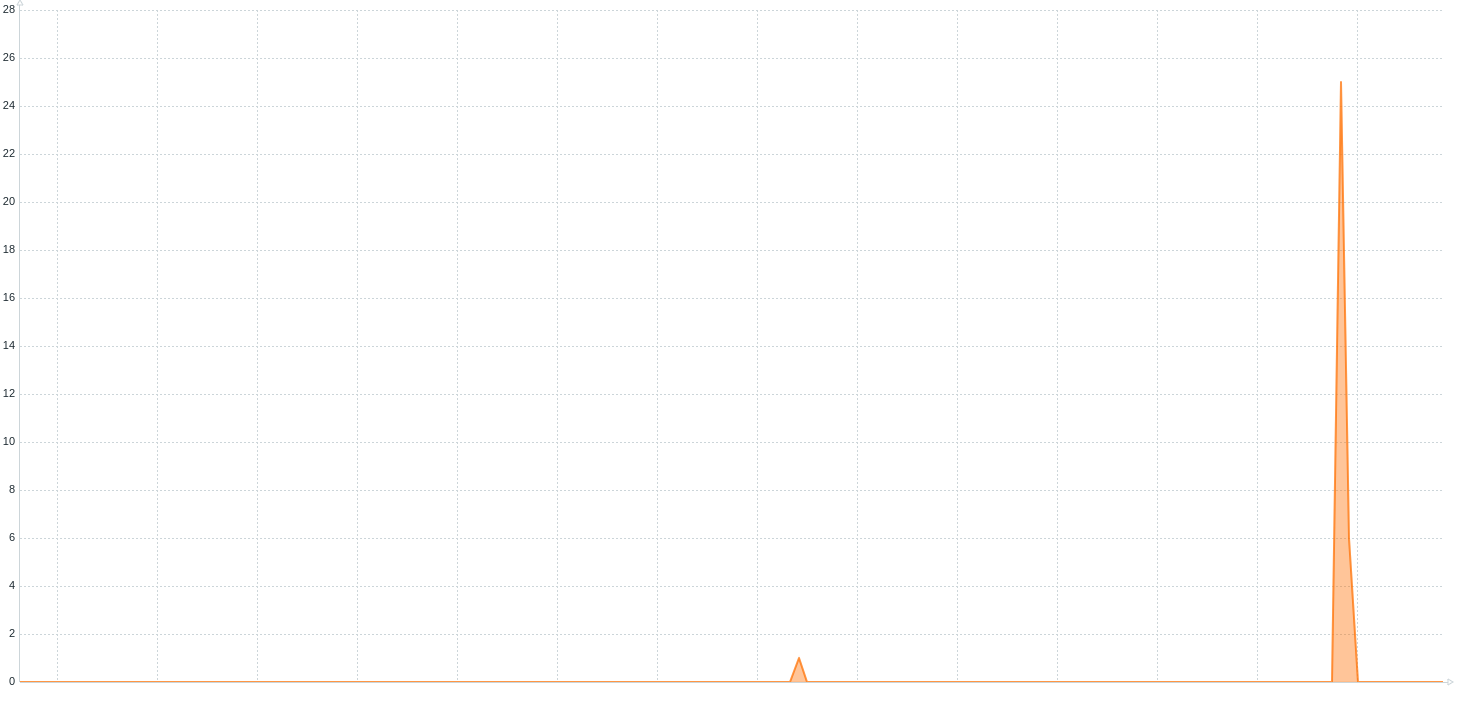
- A rapid increase from 0
- A constant value over 0
The second situation is simple, your database connection pool has too low size to handle all the requests. Either your pool is too short, or you have a situation I’ve explained in the previous chapter.
The first situation (second chart above) means that you have one of the following issues:
- A load to your application increased
- Your database slowed down
- Your application needed more time in transaction
The last situation can be diagnosed the same way I’ve written above. The easiest way to diagnose the second option is to start from database level. There are dedicated tools to monitor that area like Oracle Enterprise Manager
Tomcat connection count
Tomcat connection count charts (7/5 days)
- Object name -
Tomcat:type=ThreadPool,name="<pool name>" - Attributes -
connectionCount
Possible failures:
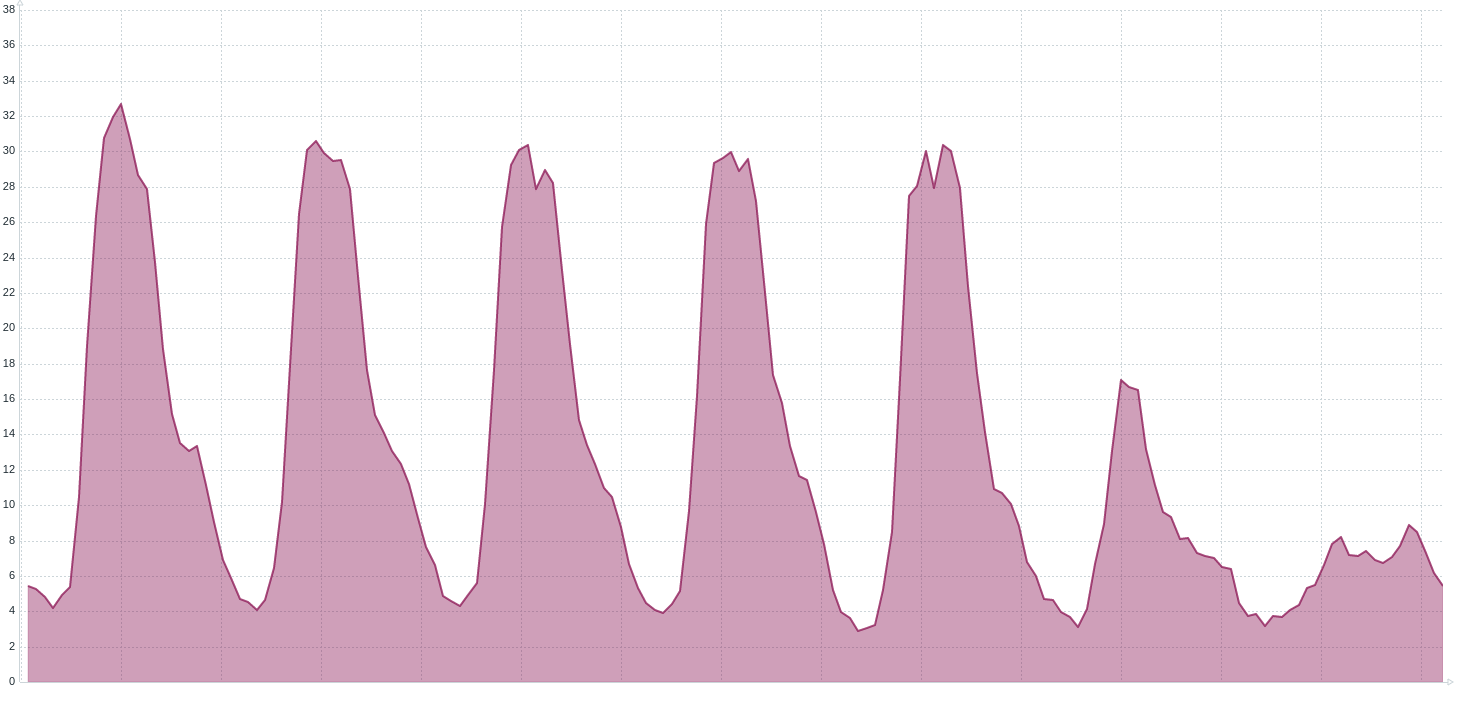
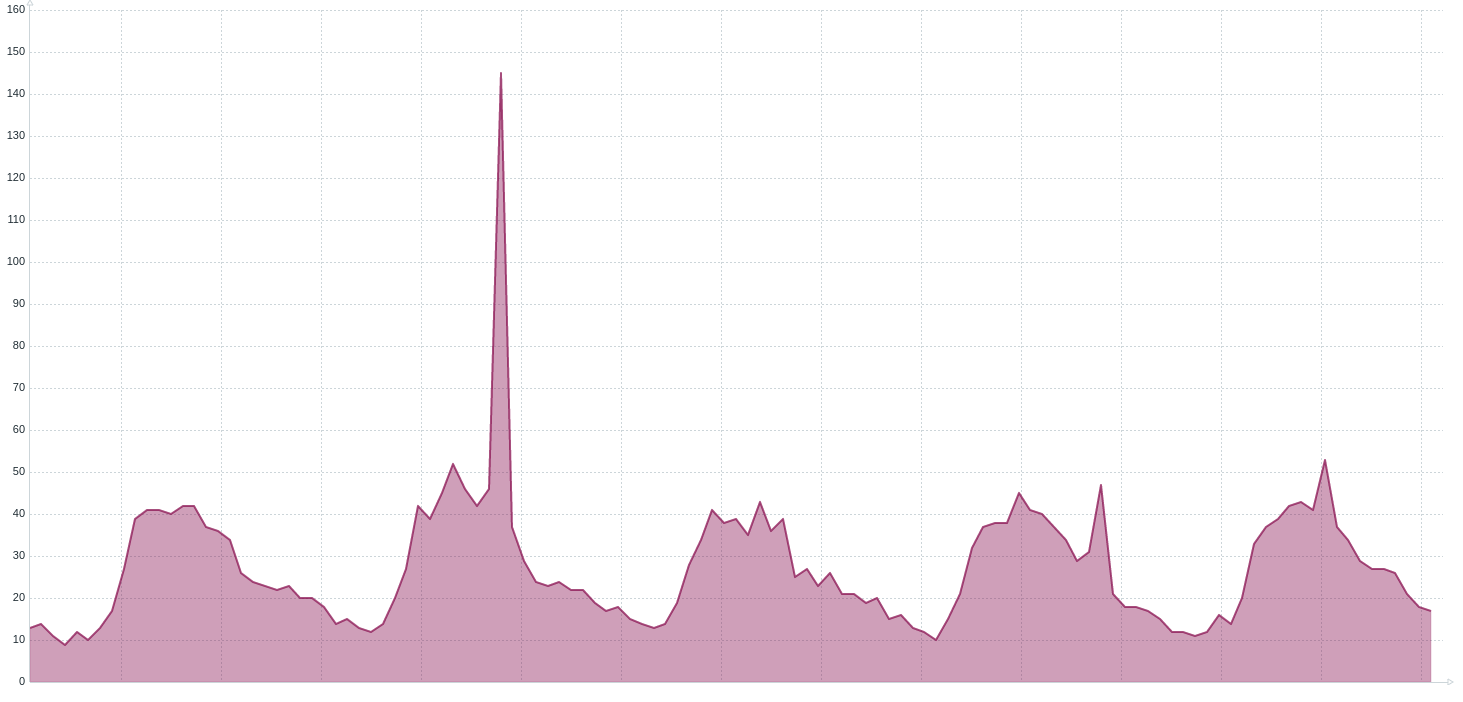
- Huge increase in a short period
This metric tells you how many connections are established to your server. If it is increasing rapidly then most probably you encounter one of the following situations:
- The number of requests is increasing
- The time for your application to handle the request is increasing
You need to remember that if your application slows down the number of incoming requests don’t decrease. The only way for an application server to handle the same amount of requests with slower application is to create more worker threads and accept more connections. If it is your case (the second chart above) then you need to find why your application is slower, the best way from my experiences is async-profiler in wall mode.
Created thread count
Created thread count chart (7 days)
- Object name -
java.lang:type=Threading - Attributes -
TotalStartedThreadCount
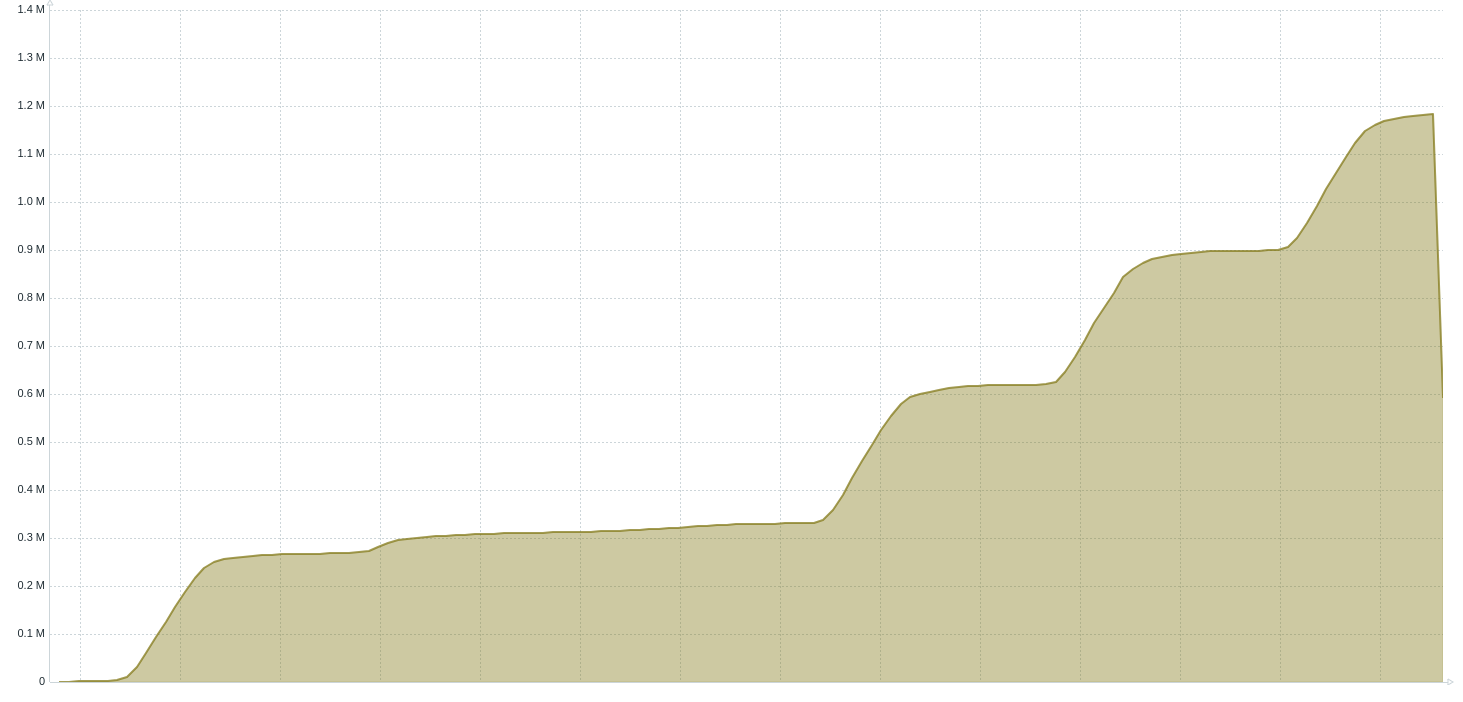
If the number of created threads is increasing it means there is a lack of a thread pool. I’ve written an article explaining how to find the part of code that lacks that pool.
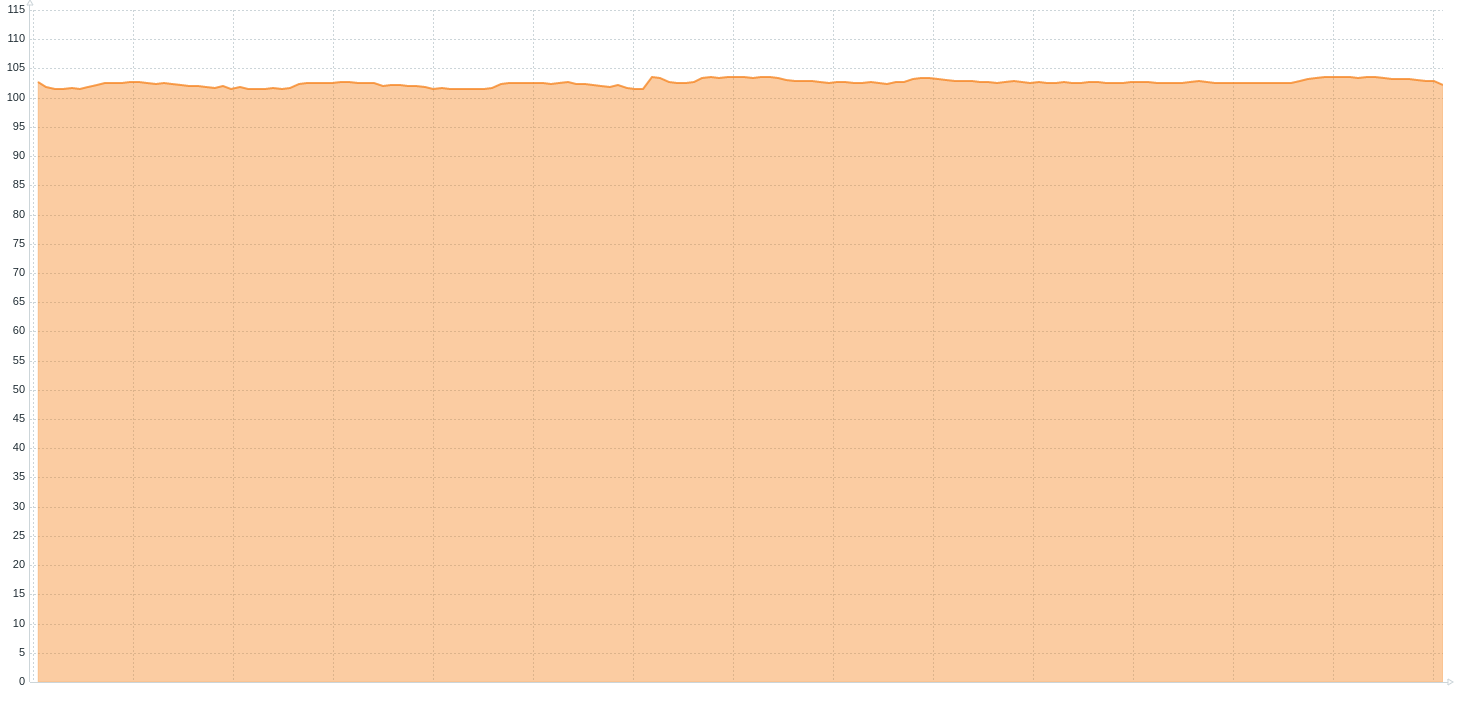
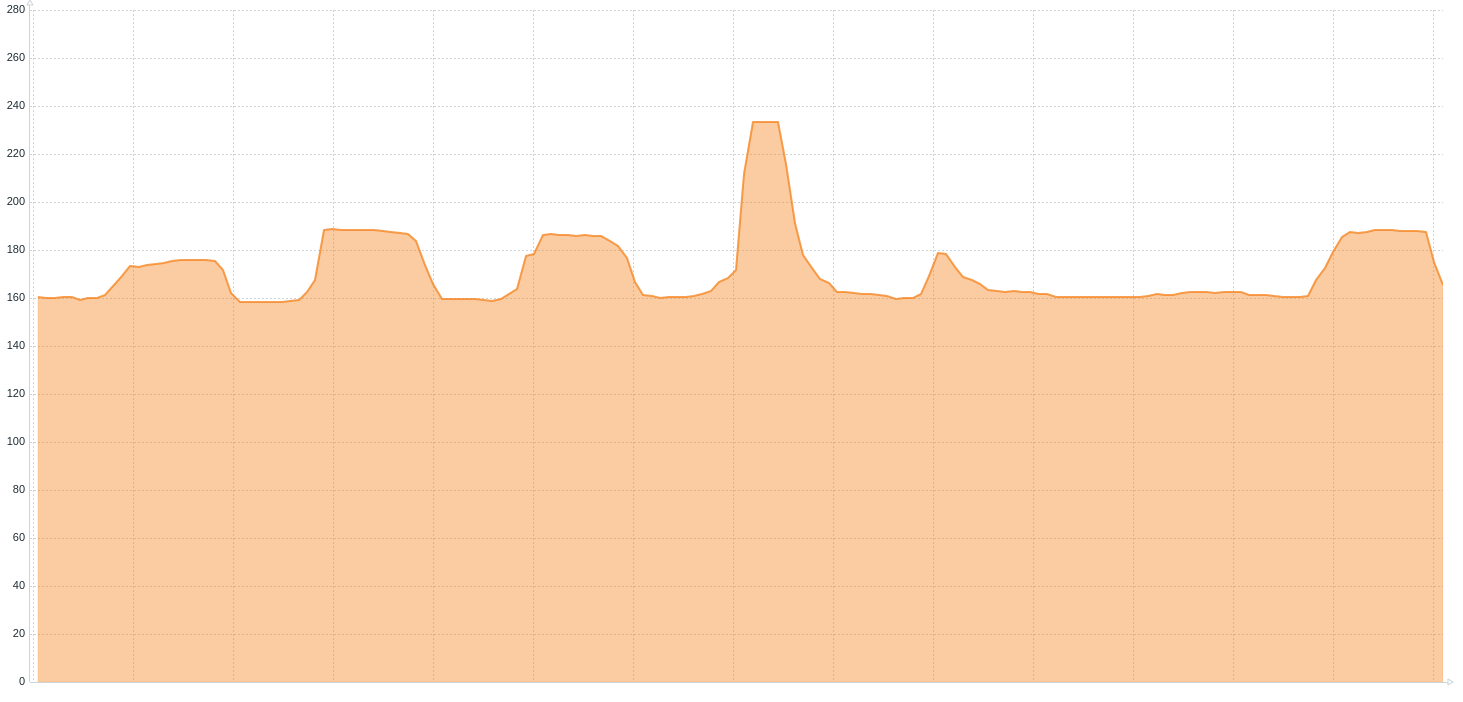
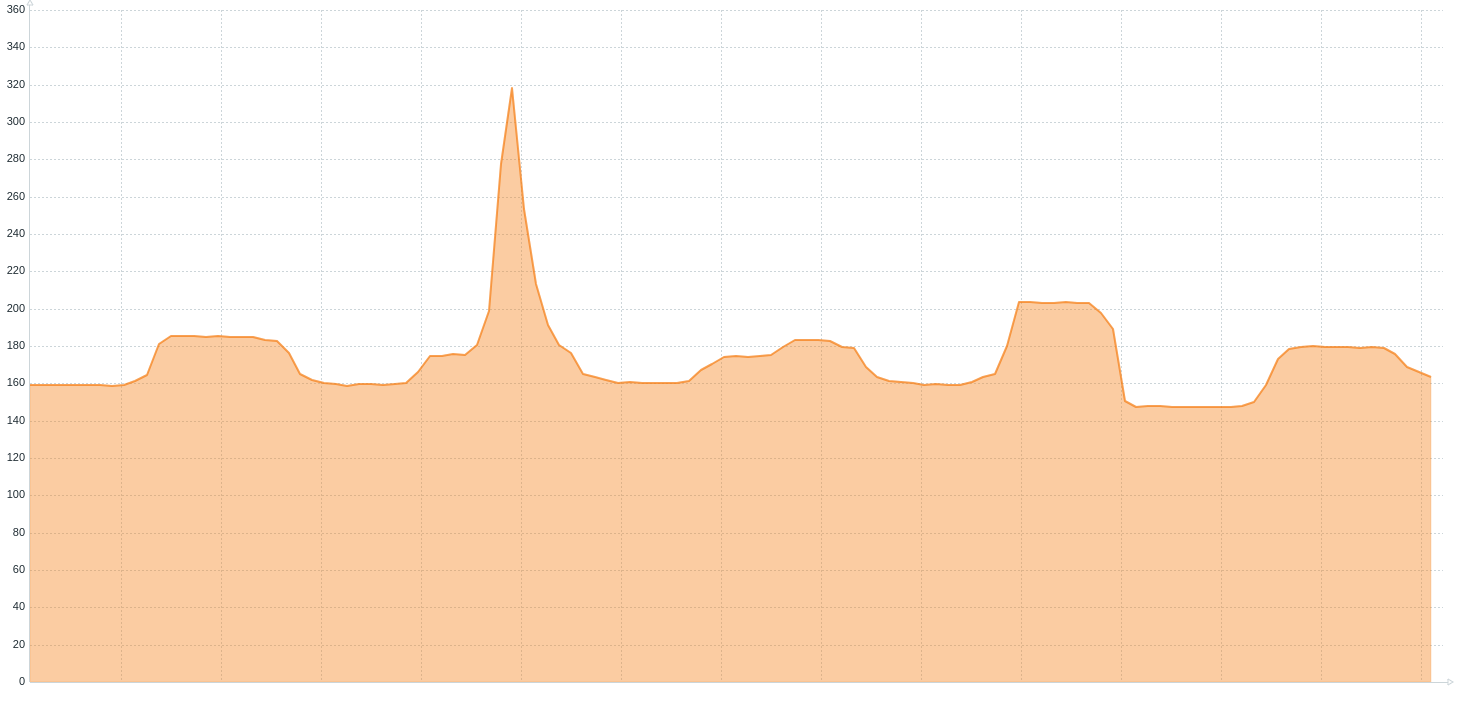
Current thread count
Current thread count charts (7 days)
- Object name -
java.lang:type=Threading - Attributes -
ThreadCount
Possible failures:
- Thread leak
- Huge increase in a short period
There are some situations where the application has thread leak, they are very rare. That situation can be diagnosed the same way as creating too many threads. The huge increase of threads in a short period means pretty much the same as increasing the tomcat connection count. The application needs more threads to do its work. We can find the reason with async-profiler in wall mode.
Afterword
As I said in the foreword, a dashboard with all those metrics helps me handle the outages, here are some examples:
- If there is a huge CPU utilization, and it is not done by my JVM then it’s noisy neighbor situation, we need to deal with the process that eats our resource
- If there is a huge CPU utilization, and it is done by my JVM, the application runs slow, and the code cache is almost full then I look at log if the JIT compiler has been disable
- If there is a huge CPU utilization, and it is done by my JVM, the application runs slow, and the full GC is happening all the time, I need a heap dump and GC logs to diagnose what is going on
- If there is a huge CPU utilization, and it is done by my JVM, and the GC runs very frequently, starting its work too soon then I need GC logs to understand why this is happening
- If there is a huge CPU utilization, and it is done by my JVM (and it is not any of previous situations), I need CPU profiling
- If there are multiple threads awaiting database connection then I need wall profiling and access to DB performance tool
- It there was a 0 available RAM for a while, and now there is no java process then I check in OS logs if there was OOM killer activity logged
… and so on.
Those charts do not solve the outage but show you where you should focus on your diagnosis. Remember, I just covered the technology I use. You may have other metrics worth gathering (MQ, Kafka, custom thread pools and so on).
After fifteen years of handling different kinds of outages I can tell you one thing: I never start the diagnosis from the application log.