[Java][JDK][Spring][Profiling] From one JDK bug to another?
Profiled application
- JDK 11u5 from Oracle
- The application used Spring-WS as SOAP WebService client
- The application was creating ~1000000 short-lived threads per day
A thread creation is considered to be a heavy resource consuming operation. What we want to do is to find out why those threads have been created, so we can use some thread pool there. This issue is easy to reproduce, you can fetch a simplified version of such an application from My GitHub.
Simplified application
Application contains two modules:
- pl.ks.jdkbug.ws.server - contains SOAP server
- pl.ks.jdkbug.ws.client - contains SOAP client for the server mentioned above
The SOAP server endpoint code is:
    @PayloadRoot(namespace = NAMESPACE_URI, localPart = "TempRequest")
    @ResponsePayload
    TempResponse temp(@RequestPayload TempRequest request) {
        response.addHeader("Connection", "close");
        return new TempResponse();
    }
A crucial part of the server is the “Connection: close” header. The server was not a part of original profiled application, it was an external service, so that header was imposed by third party.
The SOAP client can be run by a http request https://localhost:8443/.
Running the simplified application
Let’s run our simplified application with -Xlog:os+thread. When we run SOAP client from our controller:
    @GetMapping(value = "/", produces = MediaType.TEXT_PLAIN_VALUE)
    void get(HttpServletResponse response) {
        log.info("Invoking WS");
        tempClient.temp(new TempRequest());
        log.info("WS Invoked");
        response.getWriter().write("WS Invoked");
        response.getWriter().flush();
    }
In our logs we can see:
2020-12-13 10:12:39.246  INFO 27506 --- [nio-8443-exec-7] pl.ks.jdkbug.ws.client.ClientController  : Invoking WS
[30,994s][info][os,thread] Thread started (pthread id: 139778594207488, attributes: stacksize: 1024k, guardsize: 0k, detached).
[30,994s][info][os,thread] Thread is alive (tid: 27725, pthread id: 139778594207488).
[30,994s][info][os,thread] JavaThread exiting (tid: 27725).
[30,995s][info][os,thread] Thread finished (tid: 27725, pthread id: 139778594207488).
2020-12-13 10:12:39.278  INFO 27506 --- [nio-8443-exec-7] pl.ks.jdkbug.ws.client.ClientController  : WS Invoked
Such a log is created for each request. So our application creates a thread for each request.
How to find where threads are created
Threads in Java are started when we use java.lang.Thread.start(). So we need to find usages of that method.
Debugger
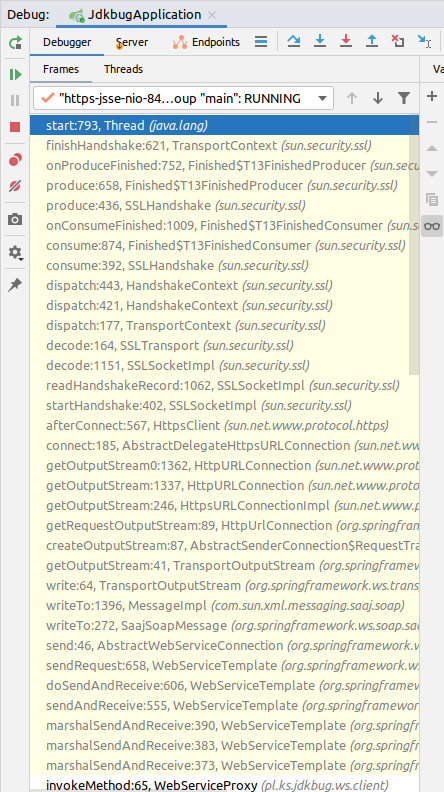
If you can run an application with a debugger attached and recreate this behavior, you can simply add a breakpoint on the method mentioned above. For the simplified application what you will find is such a stacktrace:

Async-profiler
In production environment we can attach to running JVM with async-profiler to find the stacktraces that use any java method. What async-profiler is doing is simple method
instrumentation, and instrumentation of java.lang.Thread.start() method can create multiple JIT decompilations (long story short: first class retransformation
on the running JVM may remove all JIT compilations).
It can be visible when you run an application with -Xlog:jit+compilation=debug. Then you can attach a profiler with method instrumentation:
./profiler.sh -d 10 -f out.html -e "java.lang.Thread.start" JdkBugApplication
A little explanation of the parameters:
- Duration time, ten seconds: -d 10
- Output file: -f out.html - in async-profiler 2.0 this will create a Flame Graph
- Method to instrument is passed as event: -e “java.lang.Thread.start”
- JdkBugApplication is my main class
In the JVM logs you will find multiple entries:
...
[34,033s][debug][jit,compilation]  144       1       java.util.AbstractSet::<init> (5 bytes)   made not entrant
[34,033s][debug][jit,compilation]  159       1       java.util.AbstractMap::<init> (5 bytes)   made not entrant
[34,033s][debug][jit,compilation]  148       1       java.util.concurrent.ConcurrentHashMap::casTabAt (21 bytes)   made not entrant
[34,033s][debug][jit,compilation]  162       1       java.util.HashMap::<init> (11 bytes)   made not entrant
[34,033s][debug][jit,compilation]  158       1       java.util.HashSet::<init> (16 bytes)   made not entrant
[34,033s][debug][jit,compilation]  160       1       java.util.ImmutableCollections$Set12::iterator (9 bytes)   made not entrant
[34,033s][debug][jit,compilation]  161       1       java.util.ImmutableCollections$Set12$1::<init> (21 bytes)   made not entrant
...
A Made not entrant mark means that such a JIT compilation is no longer valid, and a JIT compiler needs to create a new one. This can make your application run slower until new compilations are created (with higher CPU consumption in that period).
To do it in a safer way we need to look inside JVM and JDK source code. Let’s start with JDK java.lang.Thread.start() method:
    public synchronized void start() {
        // ...
        group.add(this);

        boolean started = false;
        try {
            start0();
            started = true;
        } finally {
            try {
                if (!started) {
                    group.threadStartFailed(this);
                }
            } catch (Throwable ignore) {
                /* do nothing. If start0 threw a Throwable then
                  it will be passed up the call stack */
            }
        }
    }

    private native void start0();
So method start() uses method start0() which is native. We can trace its usage, but we need to find its name in JVM C++ source code. In java.base/share/native/libjava/Thread.c
we can find definition of start0():
static JNINativeMethod methods[] = {
    {"start0",           "()V",        (void *)&JVM_StartThread},
    {"stop0",            "(" OBJ ")V", (void *)&JVM_StopThread},
    {"isAlive",          "()Z",        (void *)&JVM_IsThreadAlive},
    {"suspend0",         "()V",        (void *)&JVM_SuspendThread},
    {"resume0",          "()V",        (void *)&JVM_ResumeThread},
    {"setPriority0",     "(I)V",       (void *)&JVM_SetThreadPriority},
    {"yield",            "()V",        (void *)&JVM_Yield},
    {"sleep",            "(J)V",       (void *)&JVM_Sleep},
    {"currentThread",    "()" THD,     (void *)&JVM_CurrentThread},
    {"countStackFrames", "()I",        (void *)&JVM_CountStackFrames},
    {"interrupt0",       "()V",        (void *)&JVM_Interrupt},
    {"isInterrupted",    "(Z)Z",       (void *)&JVM_IsInterrupted},
    {"holdsLock",        "(" OBJ ")Z", (void *)&JVM_HoldsLock},
    {"getThreads",        "()[" THD,   (void *)&JVM_GetAllThreads},
    {"dumpThreads",      "([" THD ")[[" STE, (void *)&JVM_DumpThreads},
    {"setNativeName",    "(" STR ")V", (void *)&JVM_SetNativeThreadName},
};
So we need to find usage of JVM_StartThread, we can trace its usages with async-profiler:
./profiler.sh -d 10 -f out.html -e "JVM_StartThread" JdkBugApplication
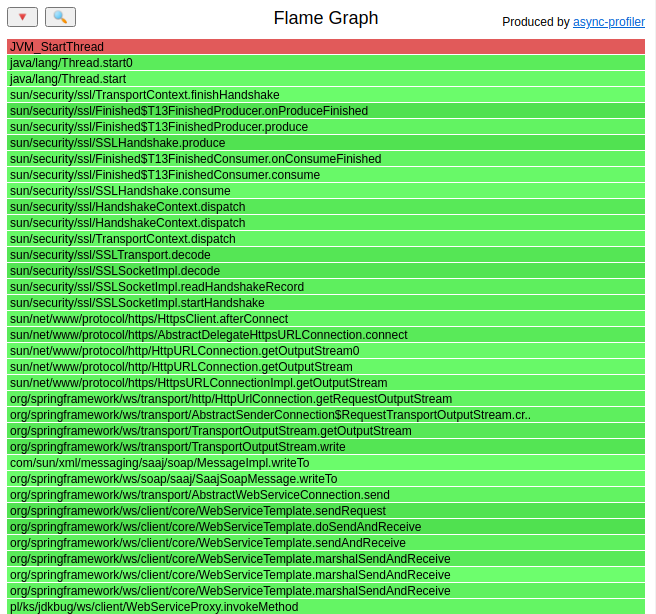
This tracing doesn’t cause massive JIT decompilations. What we can see in the profiling output is the same stacktrace as in the debugger:

finishHandshake()
From our analysis we know that new threads are created in sun.security.ssl.TransportContext.finishHandshake(). Source code of that method is:
    HandshakeStatus finishHandshake() {
        if (protocolVersion.useTLS13PlusSpec()) {
            outputRecord.tc = this;
            inputRecord.tc = this;
            cipherSuite = handshakeContext.negotiatedCipherSuite;
            inputRecord.readCipher.baseSecret =
                    handshakeContext.baseReadSecret;
            outputRecord.writeCipher.baseSecret =
                    handshakeContext.baseWriteSecret;
        }

        handshakeContext = null;
        outputRecord.handshakeHash.finish();
        inputRecord.finishHandshake();
        outputRecord.finishHandshake();
        isNegotiated = true;

        // Tell folk about handshake completion, but do it in a separate thread.
        if (transport instanceof SSLSocket &&
                sslConfig.handshakeListeners != null &&
                !sslConfig.handshakeListeners.isEmpty()) {
            HandshakeCompletedEvent hce =
                new HandshakeCompletedEvent((SSLSocket)transport, conSession);
            Thread thread = new Thread(
                null,
                new NotifyHandshake(sslConfig.handshakeListeners, hce),
                "HandshakeCompletedNotify-Thread",
                0,
                false);
            thread.start();
        }

        return HandshakeStatus.FINISHED;
    }
Yes, there is a new Thread().start() invoked in that method. Profiling of the original application showed that those 1000000 threads were also created
in finishHandshake().
I wanted to issue a bug to JVM, but I found out that it is already issued: JDK-8246039.
What can we do?
We can:
- Disable SSL on that communication - this cannot be done in thr original application because of the security reasons
- Change “Connection” header to “keep-alive” on server side - unfortunately this is third party software, and I cannot change its code
- Try to change connection mechanism from core Java to Apache Http Client or other library
Let’s try to implement the third option.
Changing Spring-WS client to use Apache Http Client
The final code of that change is pushed into the apache branch on GitHub.
The change is simple, we need to define HTTP Client and pass it to Spring. Client definition:
    @Bean
    @SneakyThrows
    HttpClient httpClient(PoolingHttpClientConnectionManager httpClientConnectionManager) {
        // Do not copy paste that configuration, this is simple config for article purposes.
        RequestConfig requestConfig = RequestConfig.custom()
                .build();

        return HttpClients.custom()
                .addInterceptorFirst(new HttpComponentsMessageSender.RemoveSoapHeadersInterceptor())
                .setDefaultRequestConfig(requestConfig)
                .setConnectionManager(httpClientConnectionManager)
                .build();
    }
Passing to Spring is done in pl.ks.jdkbug.ws.client.WebServiceProxy.afterPropertiesSet():
webServiceTemplate.setMessageSender(new HttpComponentsMessageSender(httpClient));
Great, job is done, let’s run the application and see if the threads are not created anymore. One more time we use -Xlog:os+thread flag to trace
thread creation, and run the SOAP client. This time in log file we can see:
2020-12-15 18:16:39.331  INFO 11578 --- [nio-8443-exec-3] pl.ks.jdkbug.ws.client.ClientController  : Invoking WS
2020-12-15 18:16:39.372  INFO 11578 --- [nio-8443-exec-3] pl.ks.jdkbug.ws.client.ClientController  : WS Invoked
2020-12-15 18:16:39.520  INFO 11578 --- [nio-8443-exec-1] pl.ks.jdkbug.ws.client.ClientController  : Invoking WS
2020-12-15 18:16:39.556  INFO 11578 --- [nio-8443-exec-1] pl.ks.jdkbug.ws.client.ClientController  : WS Invoked
2020-12-15 18:16:39.712  INFO 11578 --- [nio-8443-exec-9] pl.ks.jdkbug.ws.client.ClientController  : Invoking WS
2020-12-15 18:16:39.745  INFO 11578 --- [nio-8443-exec-9] pl.ks.jdkbug.ws.client.ClientController  : WS Invoked
Our application stopped creating thread while invoking SOAP WebService. I thought that the problem was solved, and then …
… little disaster :(
After deploying a new application version to the production its performance degraded by ~10%. Let’s see if this also happened to our simplified application.
Before change:
pasq@pasq-MS-7C37:~$ time for i in `seq 1 500`; do curl --insecure -s https://localhost:8443/ > /dev/null; done
real	0m23,093s
After change:
pasq@pasq-MS-7C37:~$ time for i in `seq 1 500`; do curl --insecure -s https://localhost:8443/ > /dev/null; done
real	0m28,930s
So we tried to make the application work better, but it ended with degraded performance. Why?
Continuous profiling to the rescue
The profiled application has attached the async-profiler in the continuous mode, that dumps output every minute to the hard drive. I could fetch profiling results from the old version and new version and compare it.
Let’s do the same with our simplified application:
./profiler.sh -d 10 -t -e wall -o collapsed -f output.txt JdkBugApplication
I use wall-clock mode, it is more suitable when we want to find where end user time is wasted. I use my open source tool to view the profiling result. You can
find it on GitHub. In this tool you can create Flame Graphs for methods you are interested in.
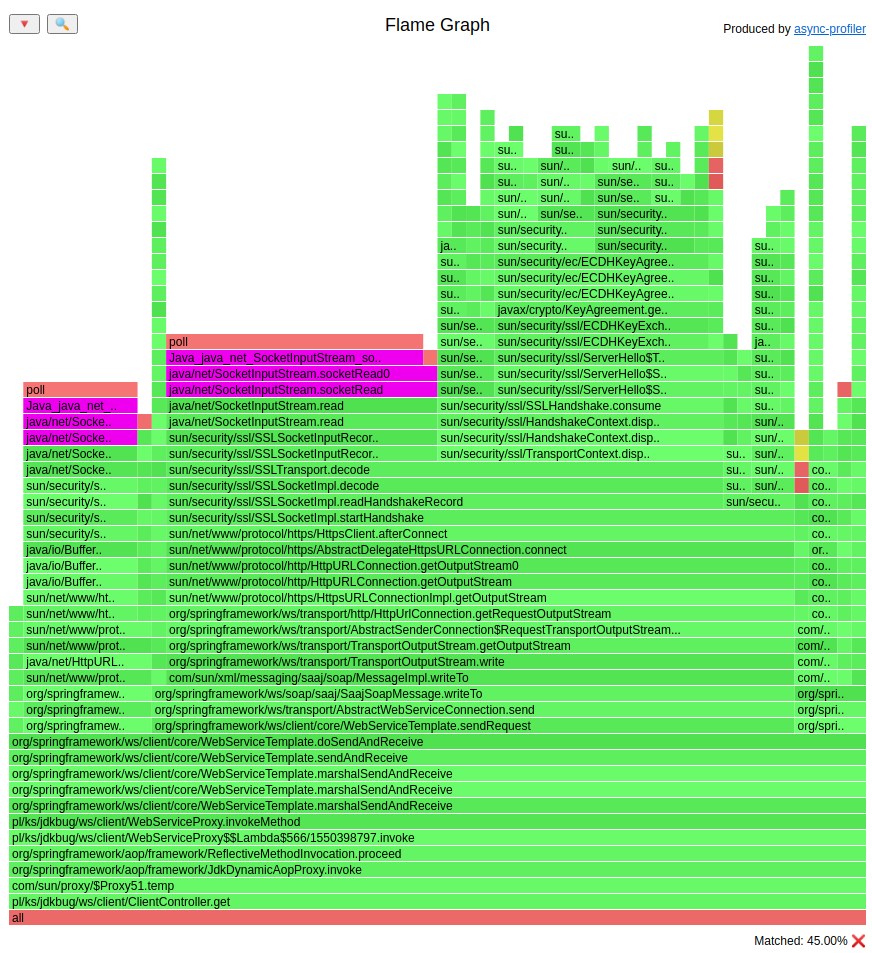
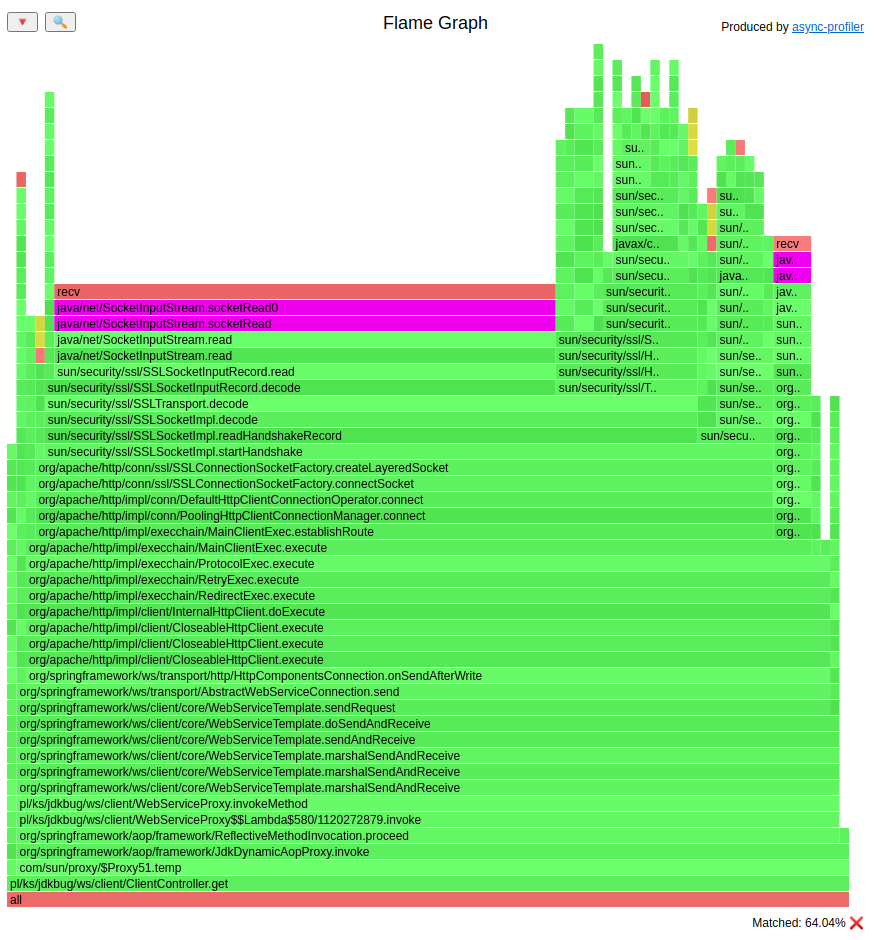
Let’s see Flame Graphs of ClientController.get() and see what has changed.
Flame Graph before change (HTML version):

Flame Graph after change (HTML version):

I highlighted the socketRead method. On the bottom of the Flame Graphs we can see that:
- before change reading from the socket took 45% of the time of
ClientController.get()method - after change reading from the socket took 64% of the time of
ClientController.get()method
In the previous chapter we run our controller 500 times, let’s assign results from that test to results of the profiler.
- before change reading from the socket took
45% * 23,093s = 10,39s - after change reading from the socket took
64% * 28,930s = 18,52s
Little disclaimer: I simplified the situation above, there are situations where some magic is happening before our controller starts its work, but showing such a big Flame Graphs (with all spring/tomcat magic) would be unreadable.
Reading from the socket? WTF
What we have done so far was just an exchange of HTTP client, why Apache spends more time reading from the socket?
Let’s look again on the Flame Graphs. We can see that the socket read is invoked from sun.security.ssl.SSLSocketImpl.startHandshake() method. The JDK
can log its work, we need to add -Djavax.net.debug=all switch to fetch it. After turning that logs on, on the version with Apache we can see such
an exception every request:
javax.net.ssl|ERROR|2D|https-jsse-nio-8443-exec-5|2020-12-15 19:17:24.055 CET|TransportContext.java:312|Fatal (INTERNAL_ERROR): closing inbound before receiving peer's close_notify (
"throwable" : {
  javax.net.ssl.SSLException: closing inbound before receiving peer's close_notify
  	at java.base/sun.security.ssl.Alert.createSSLException(Alert.java:133)
  	at java.base/sun.security.ssl.Alert.createSSLException(Alert.java:117)
  	at java.base/sun.security.ssl.TransportContext.fatal(TransportContext.java:307)
  	at java.base/sun.security.ssl.TransportContext.fatal(TransportContext.java:263)
  	at java.base/sun.security.ssl.TransportContext.fatal(TransportContext.java:254)
  	at java.base/sun.security.ssl.SSLSocketImpl.shutdownInput(SSLSocketImpl.java:645)
  	at java.base/sun.security.ssl.SSLSocketImpl.shutdownInput(SSLSocketImpl.java:624)
  	at org.apache.http.impl.BHttpConnectionBase.close(BHttpConnectionBase.java:325)
  	at org.apache.http.impl.conn.LoggingManagedHttpClientConnection.close(LoggingManagedHttpClientConnection.java:81)
You can see the full log here: before, after.
I believe that this may be a JDK-8253368 bug, but I’m not entirely sure.
Another difference is that core Java fills SSL session id, and Apache does not:
Java:
"ClientHello": {
  "client version"      : "TLSv1.2",
  "random"              : "AF 0D 19 FB 49 DF E4 F5 28 10 00 9C 04 45 21 A0 78 73 CB A2 54 65 64 58 28 C6 23 C4 63 2D 99 E9",
  "session id"          : "62 E9 49 09 67 90 CE BB BD A5 54 95 81 AC 94 33 C8 96 F5 39 A9 AE D0 3C A8 5D FC 4C 4F 33 18 30",
...
}
Apache:
"ClientHello": {
  "client version"      : "TLSv1.2",
  "random"              : "25 2E 2D FB 7F BC 60 54 39 59 52 0B 59 F6 78 F7 23 E9 60 87 0C 08 5A 37 02 33 F5 28 78 F8 07 4E",
  "session id"          : "",
...
}
Last big difference I see is that Apache fetches certificate details every request:
javax.net.ssl|DEBUG|2C|https-jsse-nio-8443-exec-3|2020-12-15 21:27:00.622 CET|CertificateMessage.java:357|Consuming server Certificate handshake message (
"Certificates": [
  "certificate" : {
    "version"            : "v3",
    "serial number"      : "5A C6 4D 01",
    "signature algorithm": "SHA256withRSA",
    "issuer"             : "CN=Unknown, OU=Unknown, O=Unknown, L=Unknown, ST=Unknown, C=Unknown",
...
}]
Core Java does not do it.
Time for theory
I believe that such a behavior is caused by the exception I mentioned above. From TLS specification:
Alert messages with a level of fatal result in the immediate termination of the connection. In this case, other connections corresponding to the session may continue, but the session identifier must be invalidated, preventing the failed session from being used to establish new connections.
In the exception I mentioned we can see:
Fatal (INTERNAL_ERROR): closing inbound before receiving peer’s close_notify
I believe that this is why Apache cannot reuse the SSL session and it needs to fetch a certificate every request.
Let’s go deeper
If we look at the stacktrace of the exception, we can see method sun.security.ssl.SSLSocketImpl.shutdownInput. Its source code:
    @Override
    public void shutdownInput() throws IOException {
        shutdownInput(true);
    }

    private void shutdownInput(
            boolean checkCloseNotify) throws IOException {
        if (isInputShutdown()) {
            return;
        }

        if (SSLLogger.isOn && SSLLogger.isOn("ssl")) {
            SSLLogger.fine("close inbound of SSLSocket");
        }

        if (checkCloseNotify && !conContext.isInputCloseNotified &&
            (conContext.isNegotiated || conContext.handshakeContext != null)) {

            throw conContext.fatal(Alert.INTERNAL_ERROR,
                    "closing inbound before receiving peer's close_notify");
        }

        conContext.closeInbound();
        if ((autoClose || !isLayered()) && !super.isInputShutdown()) {
            super.shutdownInput();
        }
    }
Apache invokes a public method that delegates its work to a private one with true as argument. When argument is set to true then this check is run:
        if (checkCloseNotify && !conContext.isInputCloseNotified &&
            (conContext.isNegotiated || conContext.handshakeContext != null)) {

            throw conContext.fatal(Alert.INTERNAL_ERROR,
                    "closing inbound before receiving peer's close_notify");
        }
Why does core Java not have this problem? You can debug it yourself, it is a nice training, I really recommend it. If you do not want to do it the answer is that core Java uses method:
    private void bruteForceCloseInput(
            boolean hasCloseReceipt) throws IOException {
        if (hasCloseReceipt) {
            try {
                this.shutdown();
            } finally {
                if (!isInputShutdown()) {
                    shutdownInput(false);
                }
            }
        } else {
            if (!conContext.isInboundClosed()) {
                conContext.inputRecord.close();
            }

            if ((autoClose || !isLayered()) && !super.isInputShutdown()) {
                super.shutdownInput();
            }
        }
    }
That method delegates its work to shutdownInput() method, but with argument set to false, and the check I have mentioned above is not run.
Time for: big fat warning
The rest of this article shows how to hack Apache to reuse the SSL session. This code was never deployed to the production, it is so ugly. I created it only to find if I was capable of fixing this problem on the client side.
Hacking Apache
You can fetch a hacked version from the apache-ugly-hack branch. From the stacktrace of the exception we can see that the shutdownInput is invoked from:
  	at java.base/sun.security.ssl.SSLSocketImpl.shutdownInput(SSLSocketImpl.java:624)
  	at org.apache.http.impl.BHttpConnectionBase.close(BHttpConnectionBase.java:325)
  	at org.apache.http.impl.conn.LoggingManagedHttpClientConnection.close(LoggingManagedHttpClientConnection.java:81)
Close method in LoggingManagedHttpClientConnection is:
    @Override
    public void close() throws IOException {

        if (super.isOpen()) {
            if (this.log.isDebugEnabled()) {
                this.log.debug(getId() + ": Close connection");
            }
            super.close();
        }
    }
It delegates its work to BHttpConnectionBase:
    @Override
    public void close() throws IOException {
        final Socket socket = this.socketHolder.getAndSet(null);
        if (socket != null) {
            try {
                this.inBuffer.clear();
                this.outbuffer.flush();
                try {
                    try {
                        socket.shutdownOutput();
                    } catch (final IOException ignore) {
                    }
                    try {
                        socket.shutdownInput();
                    } catch (final IOException ignore) {
                    }
                } catch (final UnsupportedOperationException ignore) {
                }
            } finally {
                socket.close();
            }
        }
    }
What we would like to do is to override that method to invoke shutdownInput with false as argument. Unfortunately that method is private. As I
said before, it’s a hack: we can use reflection:
            if (socket != null) {
                try {
                    inBuffer.clear();
                    outbuffer.flush();
                    try {
                        try {
                            socket.shutdownOutput();
                        } catch (final IOException ignore) {
                        }
                        Method method = socket.getClass().getDeclaredMethod("shutdownInput", boolean.class);
                        method.setAccessible(true);
                        method.invoke(socket, false);
                    } catch (final UnsupportedOperationException ignore) {
                    }
                } finally {
                    socket.close();
                }
            }
This is ugly, yes, and it needs to be wrapped with ConnectionManager and ConnectionFactory. You can see my implementation in these classes:

Did it help?
Almost, the exception is no longer thrown, but the SSL session is not reused. After some debugging I found out the cause in
sun.security.ssl.ClientHello.ClientHelloKickstartProducer.produce method:
                if (!session.getProtocolVersion().useTLS13PlusSpec()) {
                    sessionId = session.getSessionId();
                }
This condition was false in Apache. It can be overwritten with the JVM flag: -Djdk.tls.client.protocols=TLSv1.2. Again, big fat waning: this may be
insecure in your application. After adding that flag the SSL session was reused. Let’s look at the performance of the hacked application:
pasq@pasq-MS-7C37:~$ time for i in `seq 1 500`; do curl --insecure -s https://localhost:8443/ > /dev/null; done
real	0m19,901s
So the performance is better, and no java thread is created every request.
What about the original profiled application?
The team developing the application choose an option to ask the external service provider to change the “Connection: close” header to keep-alive. Unfortunately it has not been done yet, so I cannot present you the results.