[Java][JVM][Profiling] Full GC every hour after deploying new application version
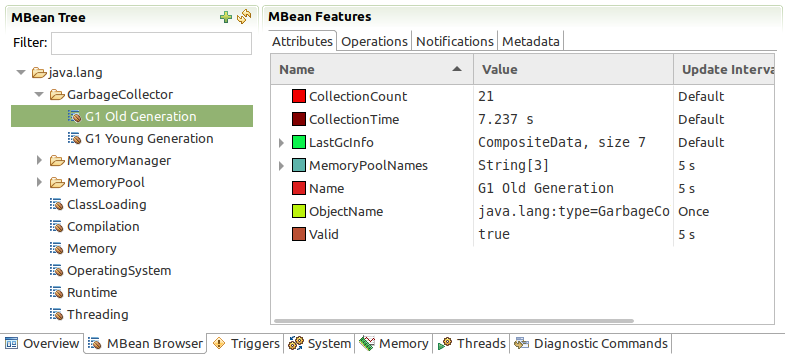
The Full GC count monitoring
Current count of Full GC, if you are using G1GC, can be fetched by JMX. It is in the MBean with name:
java.lang:type=GarbageCollector,name=G1 Old Generation at the attribute CollectionCount:

The Full GC count change
Before new version deployment, the profiled application has around one Full GC per month. After the next deployment, that count started increasing every hour. I have seen such a behaviour before, and it was related to RMI forcing Full GC, you can read about it here.
GC logs
$ cat gc.log | grep "Pause Full"
00:22:52 GC(180) Pause Full (System.gc())
00:22:52 GC(180) Pause Full (System.gc()) 973M->121M(3072M) 276.805ms
01:22:52 GC(181) Pause Full (System.gc())
01:22:53 GC(181) Pause Full (System.gc()) 941M->121M(3072M) 282.143ms
02:59:30 GC(186) Pause Full (System.gc())
02:59:30 GC(186) Pause Full (System.gc()) 989M->126M(3072M) 337.942ms
03:59:30 GC(187) Pause Full (System.gc())
03:59:30 GC(187) Pause Full (System.gc()) 990M->122M(3072M) 337.337ms
05:12:49 GC(197) Pause Full (System.gc())
05:12:49 GC(197) Pause Full (System.gc()) 1141M->121M(3072M) 288.840ms
06:12:49 GC(198) Pause Full (System.gc())
06:12:49 GC(198) Pause Full (System.gc()) 992M->121M(3072M) 324.044ms
07:12:49 GC(199) Pause Full (System.gc())
07:12:50 GC(199) Pause Full (System.gc()) 946M->120M(3072M) 329.932ms
08:12:50 GC(200) Pause Full (System.gc())
08:12:50 GC(200) Pause Full (System.gc()) 942M->120M(3072M) 298.876ms
09:12:50 GC(201) Pause Full (System.gc())
09:12:50 GC(201) Pause Full (System.gc()) 989M->120M(3072M) 325.719ms
10:12:50 GC(202) Pause Full (System.gc())
10:12:51 GC(202) Pause Full (System.gc()) 992M->121M(3072M) 280.892ms
In the GC logs we can see that the reason for Full GC is explicit invocation of the method java.lang.System.gc(). A little warning here, that method is
just a wrapper for next method:
public static void gc() {
    Runtime.getRuntime().gc();
}
Finding stacktrace that uses that method
If we want to find out who is calling that method, we can use Async-profiler at the method mode:
./profiler.sh -e java/lang/System.gc -o collapsed -f gc.txt -d 3600 jps
Even better is to find usages of invocation of method in Runtime class. That method is declared as native:
public native void gc();
To run Async-profiler for native method we need to use its name from JVM source code:
JNIEXPORT void JNICALL
Java_java_lang_Runtime_gc(JNIEnv *env, jobject this)
{
    JVM_GC();
}
So we need to execute:
./profiler.sh -e Java_java_lang_Runtime_gc -o collapsed -f gc.txt -d 3600 jps
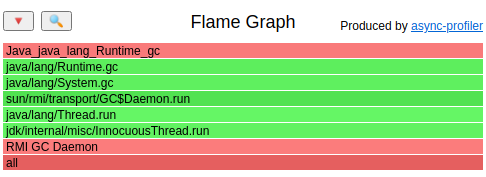
What I saw in the result:

At the bottom we can see that the thread executing that method is RMI GC Daemon.
Why was that thread started in the new version?
The easiest way to find out what part of code is to put a conditional breakpoint in IDE. That breakpoint is set in the Thread class constructor:
private Thread(ThreadGroup g, Runnable target, String name,
               long stackSize, AccessControlContext acc,
               boolean inheritThreadLocals) {
    ...
}
The condition is:

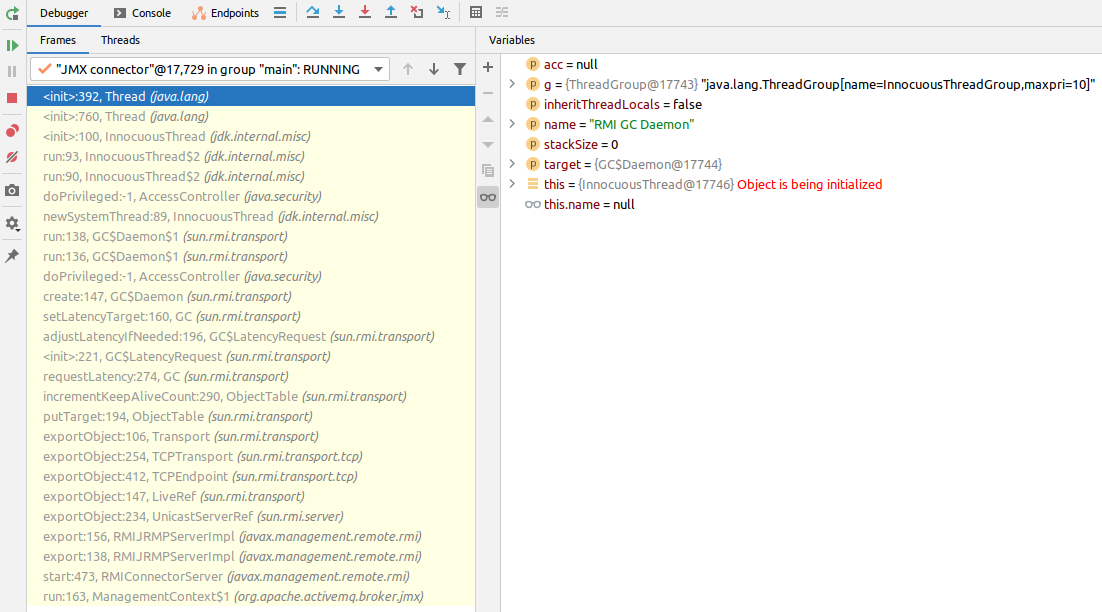
After starting the application at the localhost, it stopped at that breakpoint. The debugger result:

At the bottom of the stacktrace we can see that the thread is run because org.apache.activemq.broker.jmx.ManagementContext$1 starts it. I confirmed
that ActiveMQ was added to the application in the new version, so that addition is the reason behind those FullGCs.
Solution
The problem is very old, there are multiple solutions you can find, the one I’ve decided to go with is to add the JVM parameter
-XX:+ExplicitGCInvokesConcurrent. With that flag the explicit invocation of System.gc() doesn’t run FullGC but starts a
concurrent G1GC phase. Other possible solutions:
- Disabling explicit
System.gc()with-XX:+DisableExplicitGC- that may be dangerous if you are using NIO byte buffers, you can read about it here - Changing the Full GC intervals with flags
-Dsun.rmi.dgc.client.gcInterval=... -Dsun.rmi.dgc.server.gcInterval=...