[Java][JVM Logs][GC Logs][G1GC] Monday with JVM logs - heap before GC - is my heap wasted?
Reference - humongous allocation
I’ve already written two articles about that issue:
To tune or not to tune? G1GC vs humongous allocation.
GC logs
At the end of each GC cycle you can find such an entry in GC logs at info level:
GC(11536) Pause Young (Normal) (G1 Evacuation Pause) 6746M->2016M(8192M) 40.514ms
You can find three sizes in such an entry A->B(C) that are:
- A - used size of a heap before GC cycle
- B - used size of a heap after GC cycle
- C - current size of a whole heap
If we take the A value from each collection and put it on a chart we can generate Heap before GC chart. From such a chart we can find out when our garbage collector starts its work.
Here is an example of such a chart from G1 collector (this chart is from 1 day period):
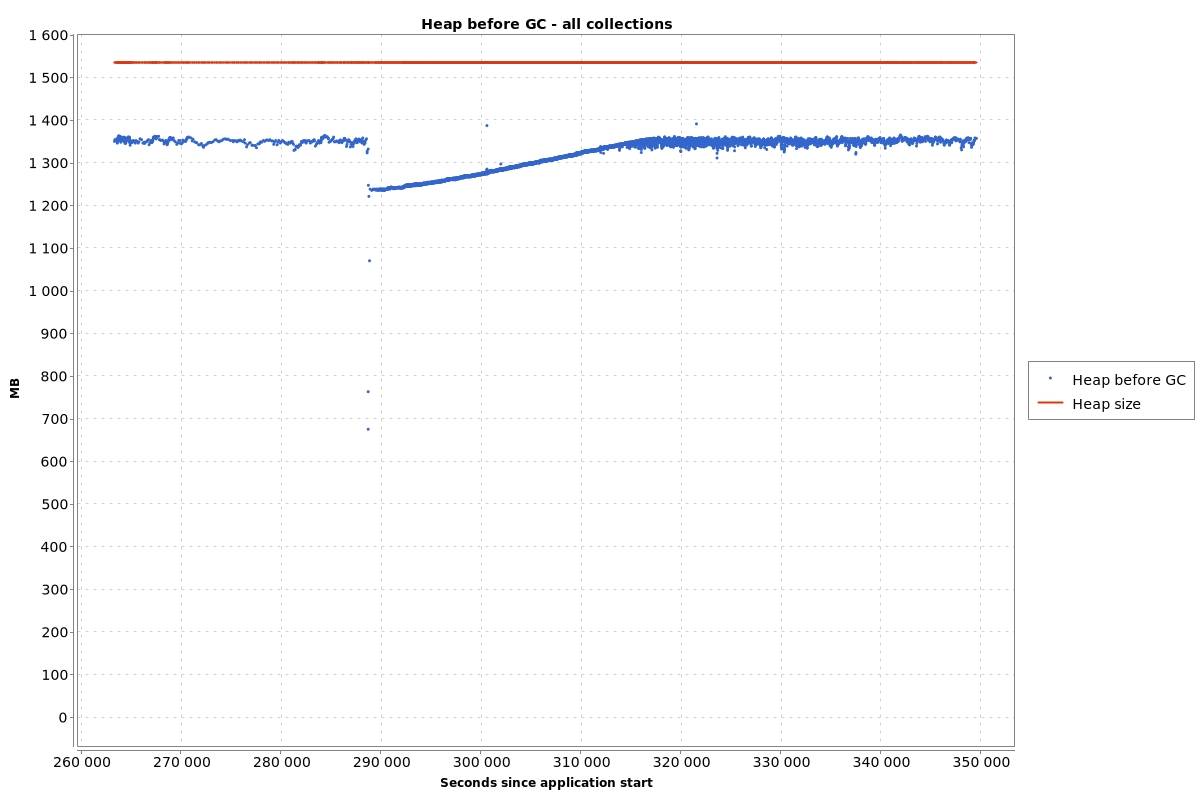
That’s what we would like that graph to look like. Most of the collections are done when the heap is almost full. That gap
between the red, and the blue line is done by the G1 setting called -XX:G1ReservePercent=10. The value 10 is the
default value. This setting means that G1 reserves 10% of the whole heap as free, so it can copy living Objects from eden to survivor space.
Usually that graph looks like:
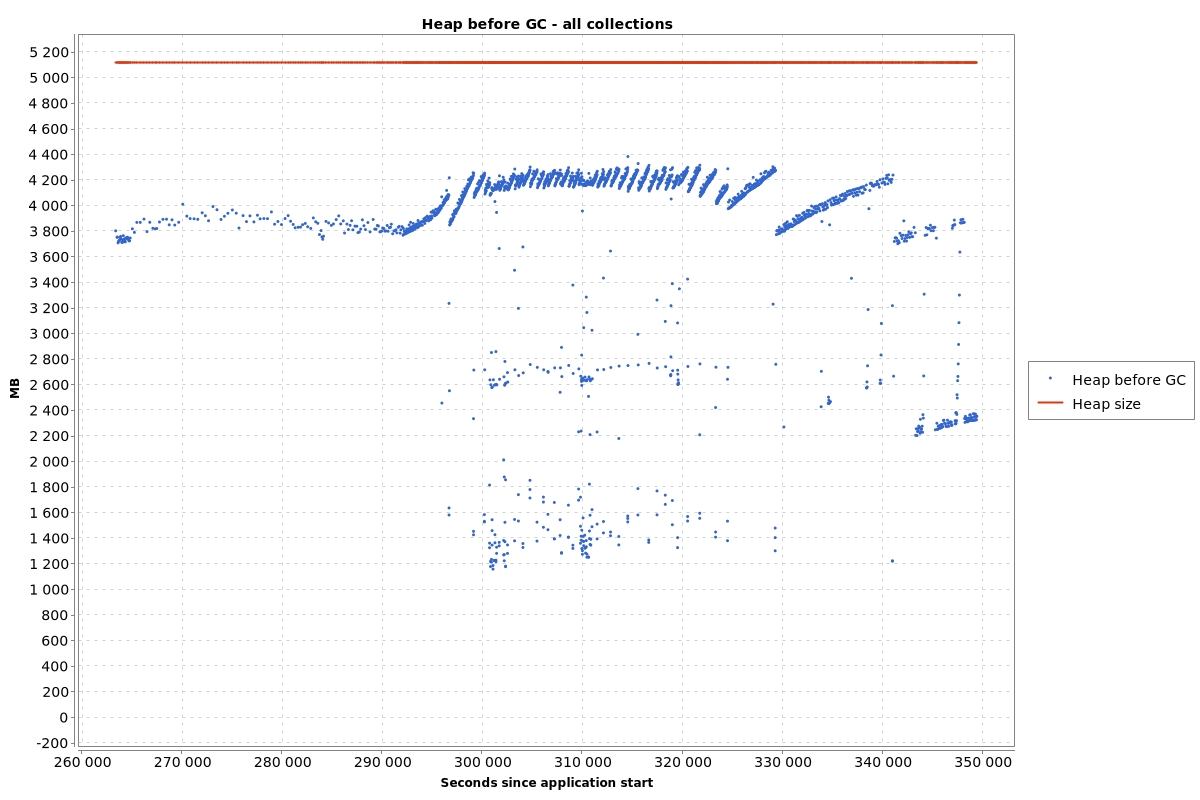
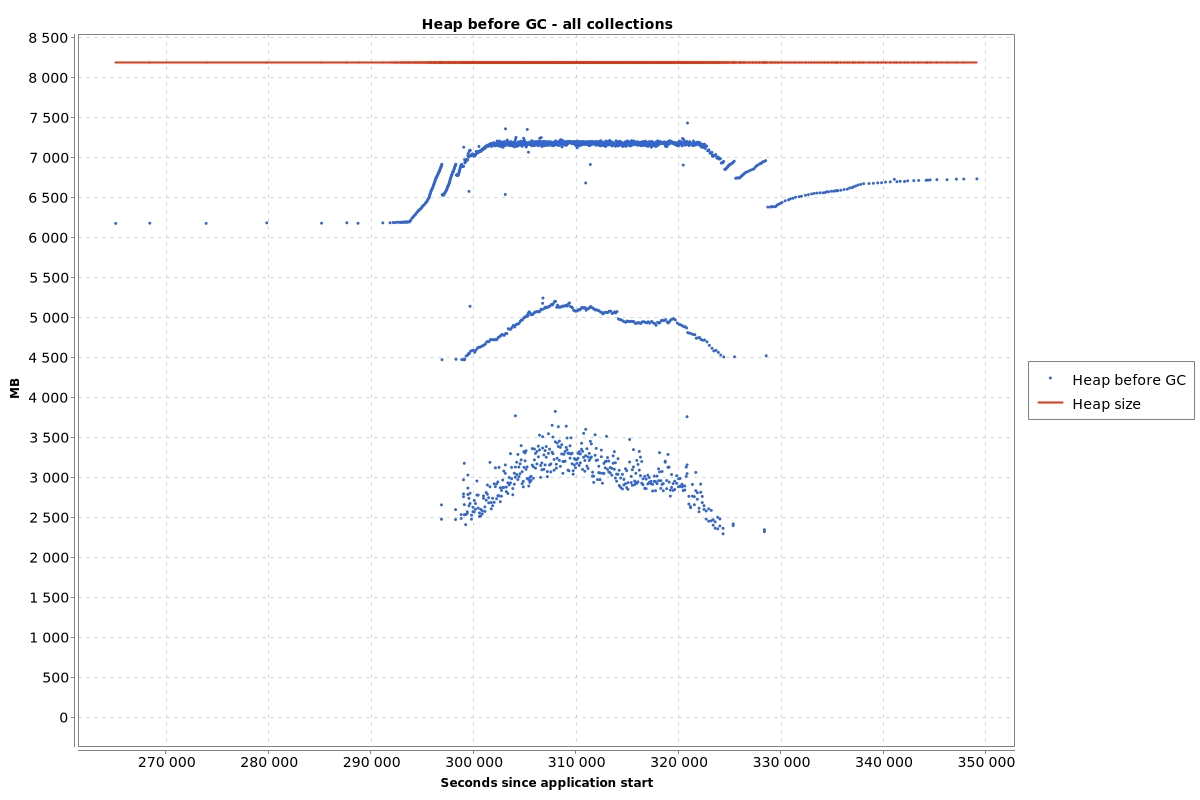
Each chart contains three groups of points. Let’s focus on the second graph. Max heap size is 8GB, and the G1 starts:
- most of the time between 6GB and 7GB
- sometimes between 4GB and 5GB
- sometimes between 2,5GB and 3,5GB
The third group of collections is done by a concurrent part of G1 (concurrent start, remark, cleanup phases). It can be started before eden is filled with Objects. The second group is done by mixed collections. It is done by G1 ergonomics which shrinks the young generation to handle mixed collections within 200ms STW pause time (200ms is the default).
Bad examples
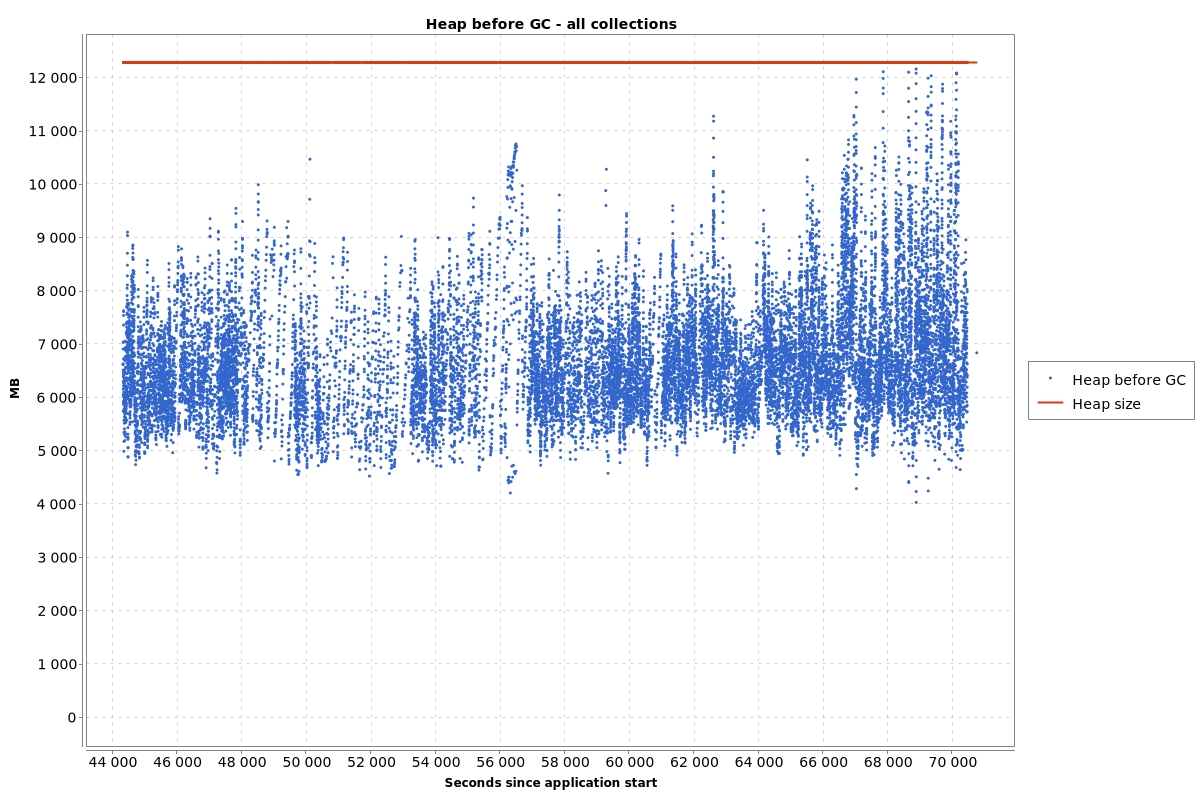
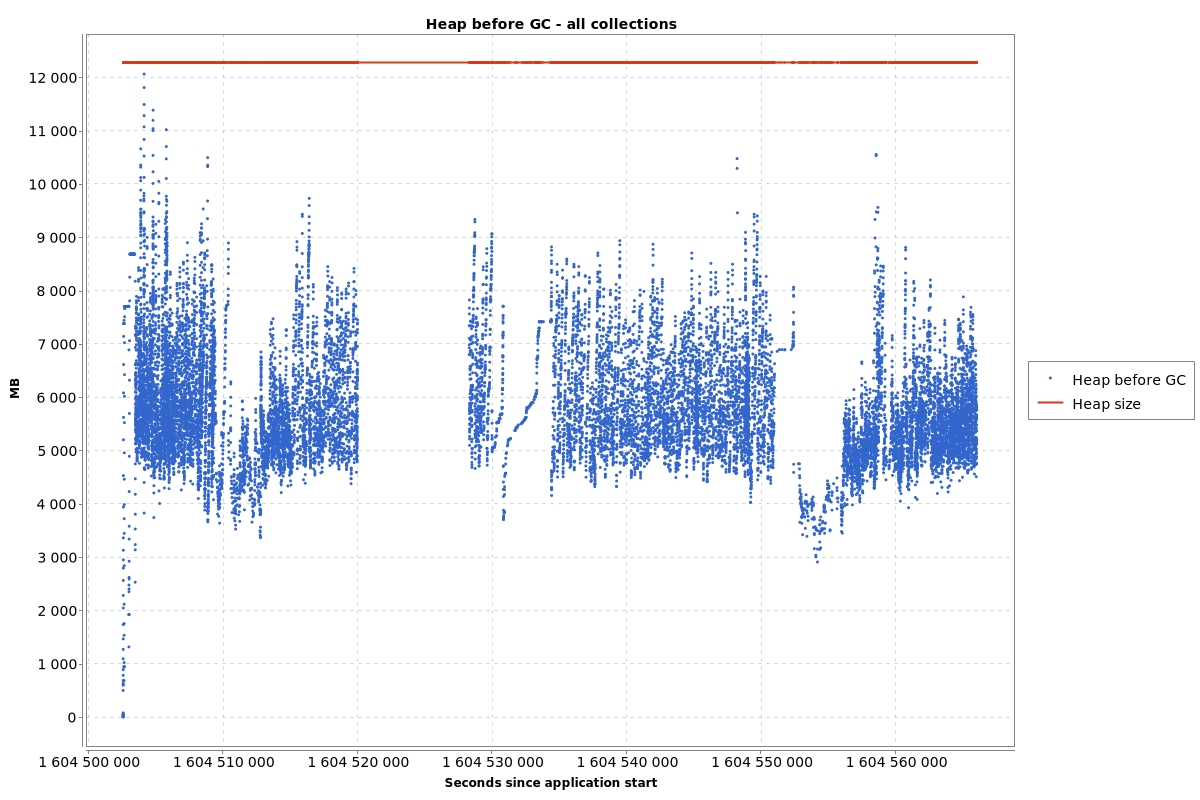
Here are two applications that have a 12GB heap but G1 starts its work at 5GB to 8B. This is a bad result. 4GB of the heap is wasted.
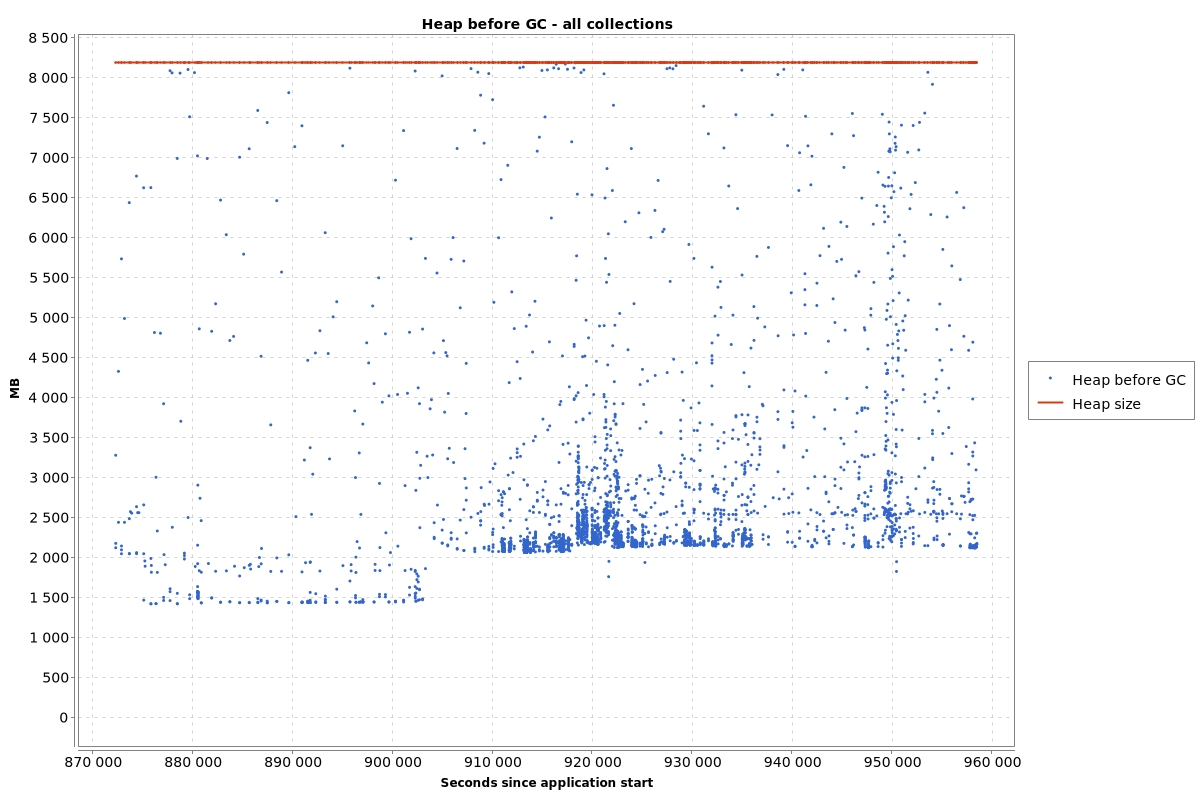
Here is an application that has a 8GB heap but G1 starts its work completely randomly.
Causes
For the G1 most of the time the issue that causes such a behaviour is humongous allocation which is a pain in the ass for every collector.
JMX monitoring
The Heap before GC chart can be generated by probing through JMX. You can generate it the same way as Heap after GC but instead of
#memoryUsageAfterGc you need to fetch #memoryUsageBeforeGc property.