[Java][JVM][Tuning][Profiling][G1] To tune or not to tune? G1GC vs humongous allocation
Big fat warning
This article shows some JVM tuning using some JVM flags. You should never use any JVM flags without knowing what consequences they may produce.
What are humongous objects?
G1 divides the whole heap into regions. The goal is to have 2048 regions, so for 2GB heap G1 will divide it to 2048 regions of 1MB size. The size of region on your JVM is easy to find, the easiest way is to run (Java 11):
java -Xms2G -Xmx2G -Xlog:gc+heap -version
Java will tell you what the region size is:
[0.002s][info][gc,heap] Heap region size: 1M
If you want to know size of region on running JVM you can do it through jcmd and many other tools:
jcmd <pid> GC.heap_info
Sample result:
 garbage-first heap   total 514048K, used 2048K [0x000000060a000000, 0x0000000800000000)
  region size 2048K, 2 young (4096K), 0 survivors (0K)
 Metaspace       used 5925K, capacity 6034K, committed 6272K, reserved 1056768K
  class space    used 500K, capacity 540K, committed 640K, reserved 1048576K
The second line contains region size.
Humongous objects are objects that are bigger than half of region size. They are usually large arrays.
Application details
- JDK 11u5 from Oracle
- 5GB heap size
- Already tuned, region size changed to 8MB, so we have 640 regions
- Tuning mentioned above was done to avoid Full GC after spike of humongous allocation, it helped but didn’t solve the problem entirely
Production example of that fail
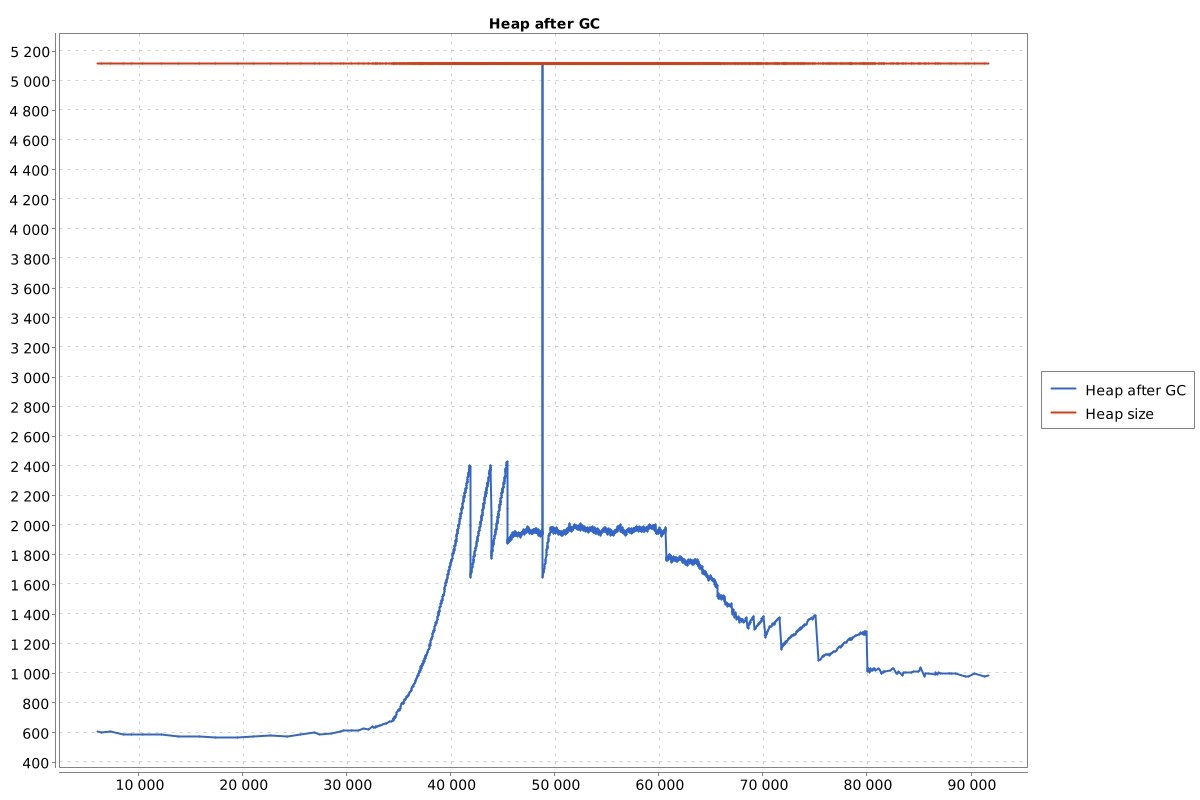
Let’s look at heap size after GC chart:

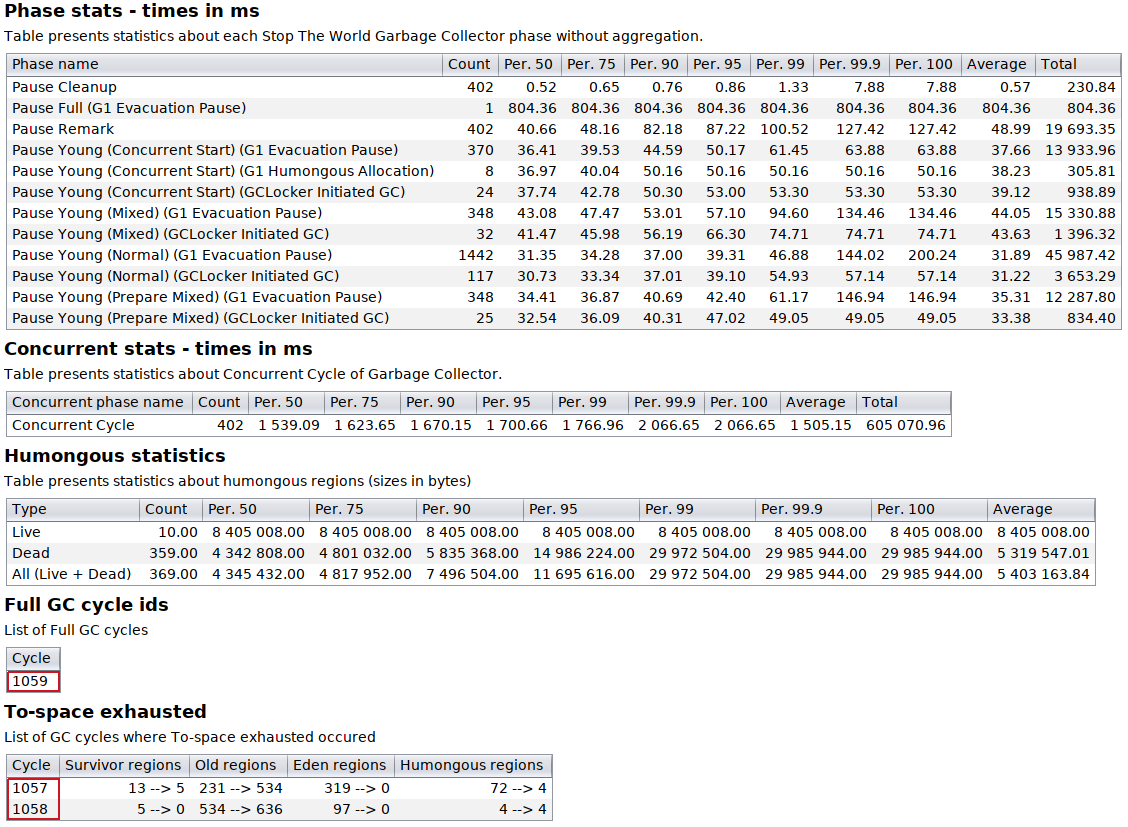
Everything is normal except one spike in the middle. Let’s look at GC stats in the table:

We have one Full GC pause, cycle number 1059. Before that cycle there were two cycles with To-space exhausted situations (no room for GC to copy objects). Let’s look at raw text logs, and see cycles from 1056 to 1058.
GC(1056) Eden regions: 210->0(319)
GC(1056) Survivor regions: 14->13(28)
GC(1056) Old regions: 233->231
GC(1056) Humongous regions: 0->0

GC(1057) To-space exhausted
GC(1057) Eden regions: 319->0(219)
GC(1057) Survivor regions: 13->5(42)
GC(1057) Old regions: 231->534
GC(1057) Humongous regions: 72->4

GC(1058) To-space exhausted
GC(1058) Eden regions: 97->0(224)
GC(1058) Survivor regions: 5->0(28)
GC(1058) Old regions: 534->636
GC(1058) Humongous regions: 4->4
A little tutorial how to interpret those lines:
Line <type> regions: <from>-><to>(<max>), example: Eden regions: 210->0(319) means:
- before GC cycle the number of regions was <from>, 210 in the example above
- after GC cycle the number of regions was <to>, 0 in the example above
- the maximum number of regions in the next cycle for a given <type> is <max>, 319 of Eden in the example above
So in the cycle 1056 everything was normal, then in 1057 we had 72 new humongous objects. GC failed the evacuation process (collection marked by To-space exhausted) and moved almost all objects from the young generation to the old one. It can be seen in line with old regions 231->534, so 303 new old regions appeared. Then G1 simply cannot clean the large old generation in “good enough” time and does a fallback to Full GC. If we count all regions in the 1057 cycle, we have 319+13+231+72=635 regions filled (from 640), so G1 has only 5 regions for his job. It is no wonder that G1 failed.
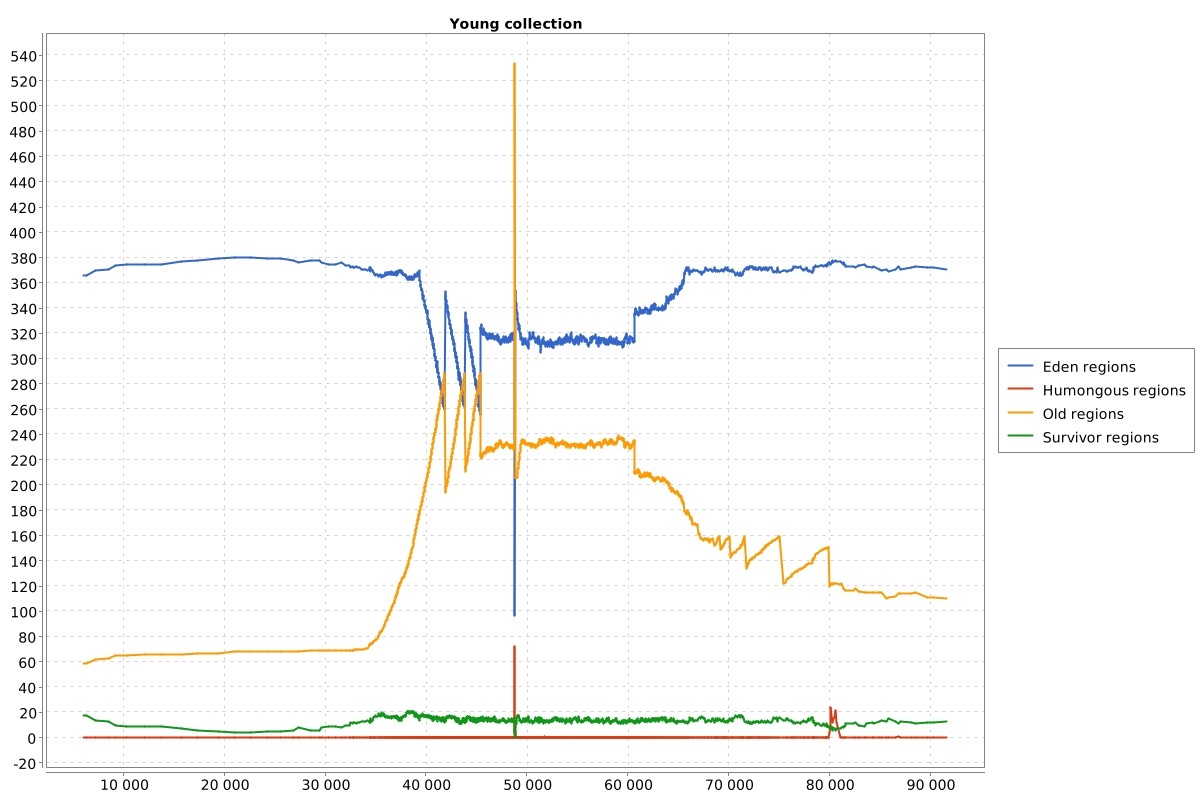
When we look at the region count before the GC chart, we see that there was only one spike of humongous objects during the whole day (logs are from 24h period).

I was told that such a situation occurs once or twice a day on every node of this application.
What can we do to fix it?
If you google, what can you do about it, most of the time you will see suggestions, that you should tune GC by increasing region size. But what’s the impact of this tuning to the rest of your application? Nobody can tell you that. In some situations you can try to do it, but what if a humongous object would have 20MB? You need to increase region size to 64MB to make that humongous object normal young generation objects. Unfortunately you cannot do it, max region size is 32MB (JDK 11u9). Another thing to consider is how long such humongous objects live in your application. If they are not dying very fast then they are going to be copied by the young generation collector, this may be very expensive. They also may occupy most of the young generation, so you may have more frequent GC collections.
The application mentioned above did such tuning twice. First, development team increased region size to 4MB, and after that they increased it to 8MB. The problem still exists.
Is there anything else we can do apart from GC tuning?
Well, we can simply find where those humongous objects are created in our application and change our code. So instead of tuning GC to work better with our application, we can change our application to work better with GC.
How to do it?
When it comes to object on heap we have two points of view:
- we can check where object is located on heap using heap dump,
- or we can find the stack trace of the thread creating those objects using allocation profiler.
- or we can find the stack trace of the thread creating those objects by tracing JVM internal calls.
Since we want to find where humongous objects are created, the second, and the third option are more suitable, but there are situations where heap dump is “good enough”.
Allocation profiler
There are two kinds of allocation profilers:
- profilers that you can run on production systems,
- profilers that degrade performance so much, that you cannot do it.
I will cover only the first type. Two allocation profilers that I know that can be used on production for such purposes are:
- Async-profiler (version >= 2.0) - open source, while writing this article version 2.0 is already in “early access” stage
- Java Flight Recorder - open source since JDK 11
They are using same principle, from Async-profiler readme:
The profiler features TLAB-driven sampling. It relies on HotSpot-specific callbacks to receive two kinds of notifications:
when an object is allocated in a newly created TLAB (aqua frames in a Flame Graph);
when an object is allocated on a slow path outside TLAB (brown frames).
This means not each allocation is counted, but only allocations every N kB, where N is the average size of TLAB. This makes heap sampling very cheap and suitable for production. On the other hand, the collected data may be incomplete, though in practice it will often reflect the top allocation sources.
If you don’t know what TLAB is, I recommend reading this article. Long story short: one TLAB is a small part of eden that is assigned to one thread and only one thread can allocate in it.
Both profilers can dump:
- type of allocated object
- stacktrace where object was created
- timestamp
- thread creating that object
After dumping data we have to post-process output file and find humongous objects.
Async-profiler example
In my opinion, Async-profiler is the best profiler in the world, so I will use it in the following example.
I wrote an example application that does some humongous allocations, let’s try to find out where this allocation is done. I run (from async-profiler directory) profiler.sh command with:
- Duration time, ten seconds: -d 10
- Output file: -f /tmp/humongous.jfr
- I’m interested in the allocation event. so: -e alloc
- Application is my main class
./profiler.sh -d 10 -f /tmp/humongous.jfr -e alloc Application
Now I have to post-process output file and find interesting stacktraces. First, let’s look at GC logs to find sizes :
...
Dead humongous region 182 object size 16777232 start 0x000000074b600000 with remset 0 code roots 0 is marked 0 reclaim candidate 1 type array 1
Dead humongous region 199 object size 33554448 start 0x000000074c700000 with remset 0 code roots 0 is marked 0 reclaim candidate 1 type array 1
Dead humongous region 232 object size 67108880 start 0x000000074e800000 with remset 0 code roots 0 is marked 0 reclaim candidate 1 type array 1
...
So we are looking for objects with sizes: 16777232, 33554448, 67108880. Keep it mind that you have to look at logs from a period of time, when the profiler was running. Since version 2.0 of async-profiler JFR output is in 2.0 version. We can use the jfr command line tool, which is delivered with JDK 11, to parse output file.
First let’s look at content of our output file:
jfr summary humongous.jfr
 Version: 2.0
 Chunks: 1
 Start: 2020-11-10 07:02:10 (UTC)itit
 Duration: 10 s


 Event Type                          Count  Size (bytes)
=========================================================
 jdk.ObjectAllocationInNewTLAB       65632       1107332
 jdk.ObjectAllocationOutsideTLAB       134          2304
 jdk.CPULoad                            10           200
 jdk.Metadata                            1          4191
 jdk.CheckPoint                          1          4449
 jdk.ActiveRecording                     1            73
 jdk.ExecutionSample                     0             0
 jdk.JavaMonitorEnter                    0             0
 jdk.ThreadPark                          0             0
We have registered:
- 134 allocations outside TLAB
- 65632 allocations in new TLAB
Humongous objects are usually allocated outside TLAB, because they are very big. Let’s look at those allocations:
jfr print --events jdk.ObjectAllocationOutsideTLAB humongous.jfr
...
jdk.ObjectAllocationOutsideTLAB {
  startTime = 2020-11-10T07:02:17.329539461Z
  objectClass = byte[] (classLoader = null)
  allocationSize = 16777232
  eventThread = "badguy" (javaThreadId = 37)
  stackTrace = [
    pl.britenet.profiling.demo.nexttry.Application.lambda$main$2() line: 56
    pl.britenet.profiling.demo.nexttry.Application$$Lambda$17.1778535015.run() line: 0
    java.lang.Thread.run() line: 833
  ]
}


jdk.ObjectAllocationOutsideTLAB {
  startTime = 2020-11-10T07:02:17.331986883Z
  objectClass = byte[] (classLoader = null)
  allocationSize = 33554448
  eventThread = "badguy" (javaThreadId = 37)
  stackTrace = [
    pl.britenet.profiling.demo.nexttry.Application.lambda$main$2() line: 56
    pl.britenet.profiling.demo.nexttry.Application$$Lambda$17.1778535015.run() line: 0
    java.lang.Thread.run() line: 833
  ]
}


jdk.ObjectAllocationOutsideTLAB {
  startTime = 2020-11-10T07:02:17.337044969Z
  objectClass = byte[] (classLoader = null)
  allocationSize = 67108880
  eventThread = "badguy" (javaThreadId = 37)
  stackTrace = [
    pl.britenet.profiling.demo.nexttry.Application.lambda$main$2() line: 56
    pl.britenet.profiling.demo.nexttry.Application$$Lambda$17.1778535015.run() line: 0
    java.lang.Thread.run() line: 833
  ]
}

...
Available formats are:
- Plain human readable text - as the example above
- JSON
- XML
By default, stack trace is cut to 5 top frames, you can change it using –stack-depth option.
From the output I put above, we can read that we have 3 objects we were looking for, we can read from it, that our humongous allocation is done with thread “badguy”, and is done in lambda in Application class.
Tracing JVM internals
Humongous allocation is done in g1CollectedHeap.cpp in:
G1CollectedHeap::humongous_obj_allocate(size_t word_size)
To trace its calls we can use:
- Tracing tools from OS level, like eBPF
- Async-profiler using G1CollectedHeap::humongous_obj_allocate event, this works also in 1.8 version (and earlier)
Async-profiler example
Tracing such calls with async-profiler is really easy. We have to run it with options:
- Duration time, ten seconds: -d 10
- Output file: -f /tmp/humongous.svg (for 1.8. version, in 2.0 you should use html extension) for flame graph output
- Method to trace is passed in -e G1CollectedHeap::humongous_obj_allocate
- Application is my main class
./profiler.sh -d 10 -f /tmp/humongous.svg -e G1CollectedHeap::humongous_obj_allocate Application
And we can see humongous allocations:

If you need thread name you can add -t switch while running async-profiler.
Hard part - modifying application
Everything I wrote so far is easy. Now we have to modify our application. Of course, I cannot fix every humongous allocation with one article. All I can do is to write production examples and what has been done with them.
Hazelcast distributed cache
Humongous allocation: Hazelcast distributed cache created large byte[] while distribution between nodes.
Fix: Changing cache provider for those maps where humongous allocation appeared. There were massive byte[] transported through the network, it was not effective at all.
Web application - upload to DMS form
Humongous allocation: Application had HTML form, that allowed to send files with size up to 40MB to DMS (document management system). Content of that file at Java code level was simply byte[], of course such an array was a humongous object.
Fix: Backend for that upload form was moved to a separate application.
Hibernate
Humongous allocation: Hibernate engine was creating a very large Object[]. From the heap dump I could find what kind of objects they were, and what content they had. From the profiler I knew which thread allocated them, and from application log I knew what business operation invoked it. I found following entity in codebase:
@Entity
public class SomeEntity {
    ...
    @OneToMany(fetch = FetchType.EAGER ...)
    private Set<Mapping1> map1;
    @OneToMany(fetch = FetchType.EAGER ...)
    private Set<Mapping2> map2;
    @OneToMany(fetch = FetchType.EAGER ...)
    private Set<Mapping3> map3;
    @OneToMany(fetch = FetchType.EAGER ...)
    private Set<Mapping4> map4;
    @OneToMany(fetch = FetchType.EAGER ...)
    private Set<Mapping5> map5;
    ...
}
Such mapping created multiple joins on SQL level and created duplicated results that had to be processed by Hibernate.
Fix: In this entity it was possible to add FetchType.SELECT, so that’s what was done. Keep in mind that can cause data integrity problems in some cases, so again, this change helped this application, but it can hurt yours.
Big WebService response
Humongous allocation: One application fetched “product catalog” from another application through WebService. That created a huge byte[] (around 100MB) to fetch data from the network.
Fix: Both applications were changed to give possibility to fetch “product catalog” in chunks.
To tune or not to tune?
As I mentioned before, sometimes instead of tuning GC to work better with our application, we can change our application to work better with GC. Now what are pros and cons?
Changing application - pros
- We have full control of the code of our applications, so we can change it as we want
- Does not require deep understanding of JVM internals, after analysis it can be done by any developer from our team
Changing application - cons
- Deployment
- Release management
- Other corpo-related issues
Tuning GC - pros
- It only needs to change JVM flags, sometimes it can be done on production without deployment
Tuning GC - cons
- Require deep understanding of JVM internals
- Those internals can change in time, so after JDK update your application can have other performance issues
As a rule of thumb I suggest changing application first if this can solve your GC problems.