[Java][JVM Logs][GC Logs] Monday with JVM logs - heap after GC - do I have a memory leak?
Memory leak definition
Let’s start with the definition from Wikipedia:
In computer science, a memory leak is a type of resource leak that occurs when a computer program incorrectly manages memory allocations in a way that memory which is no longer needed is not released.
Unfortunately that definition doesn’t fit to the JVM with Garbage Collector. The JVM allocates memory for a heap, our applications create Objects on it. The definition for the heap should look like:
A memory leak occurs when a Garbage Collector cannot collect Objects that are no longer needed by the Java application.
What else can it be?
A heap memory leak is only one kind of problem that may occur on Java heap. The top three kinds are:
- a memory leak - the definition above
- not enough space on a heap - sometimes Java application may work fine on a heap it has, but there is a possibility to run a part of an application that needs more heap than -Xmx - it is not a memory leak
- gray area between - these are cases when we allocate memory indefinitely, but our application needs these Objects
GC logs
At the end of each GC cycle you can find such an entry in GC logs at info level:
GC(11536) Pause Young (Normal) (G1 Evacuation Pause) 6746M->2016M(8192M) 40.514ms
You can find three sizes in such an entry A->B(C) that are:
- A - used size of a heap before GC cycle
- B - used size of a heap after GC cycle
- C - current size of a whole heap
If we take the B value from each collection and put it on a chart we can generate Heap after GC chart. From such a chart we can detect if we have a memory leak on a heap. If a chart looks like those (those are charts from 7 days period):
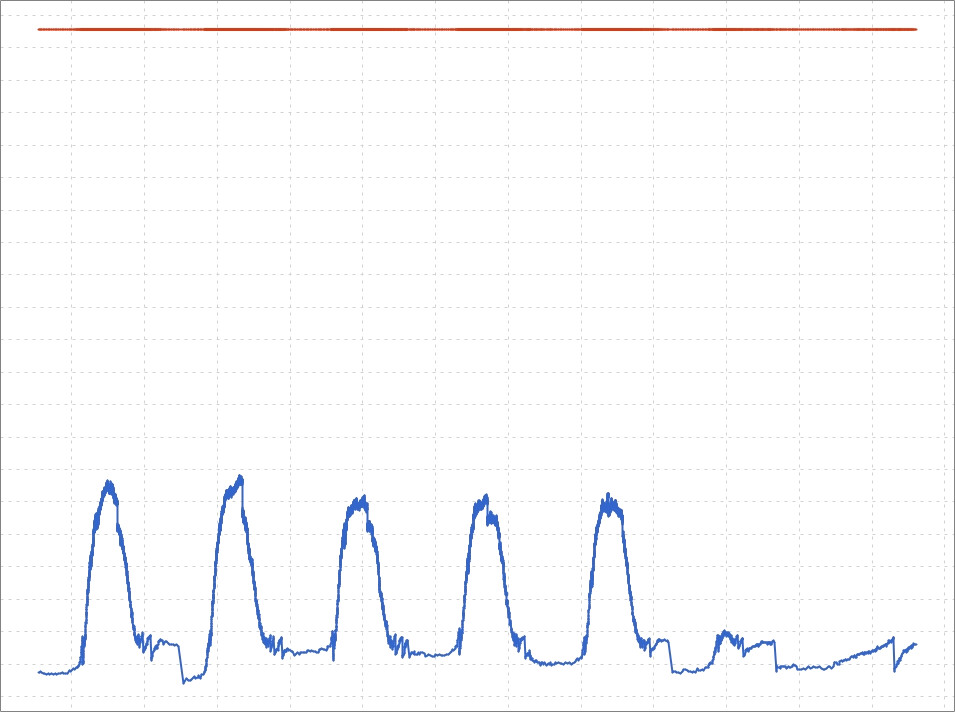
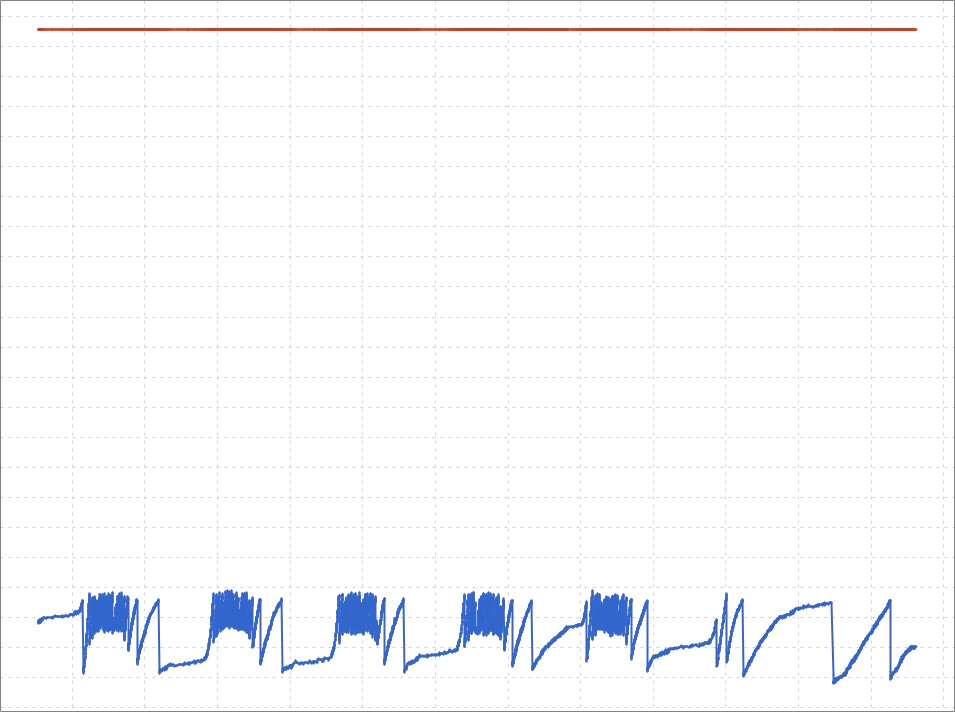
then there is no memory leak. The garbage collector can clean up the heap to the same level every day. The chart with memory leak looks like this one:
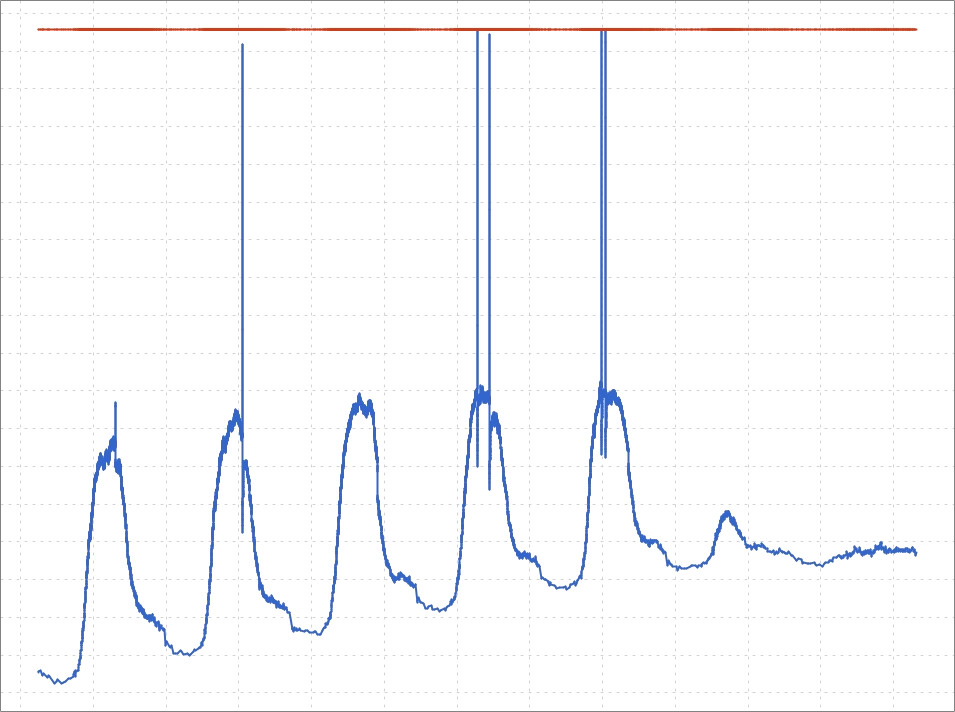
These spikes to the roof are to-space exhausted situations in the G1 algorithm, those are not OutOfMemoryErrors. After each of those spikes there was Full GC phase that is a failover in that algorithm.
Here is an example of not enough space on a heap problem:
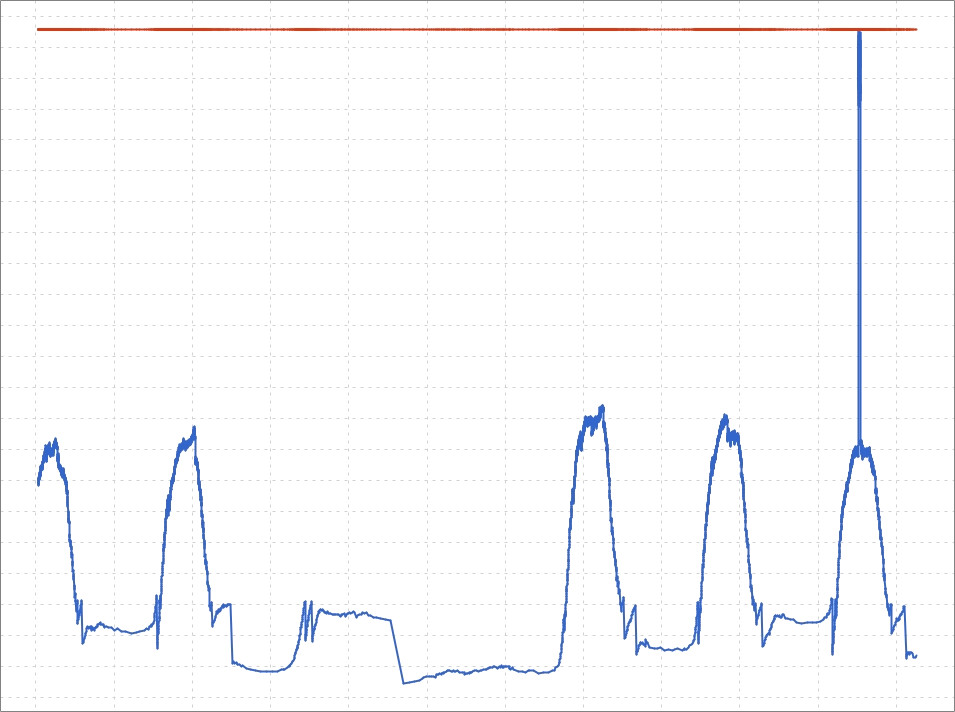
This one spike is an OutOfMemoryError. One service was run with arguments that needed ~16GB on a heap to complete. Unfortunately -Xmx was set to 4GB. It is not a memory leak.
Stateless applications
You have to be careful if your application is completely stateless and you use GC with young/old generations (like G1, parallel, serial and CMS). You need to remember that Objects from memory leak live in the old generation. In stateless application that part of the heap can be cleared even once a week. Here is an example - 3 days of the stateless application:
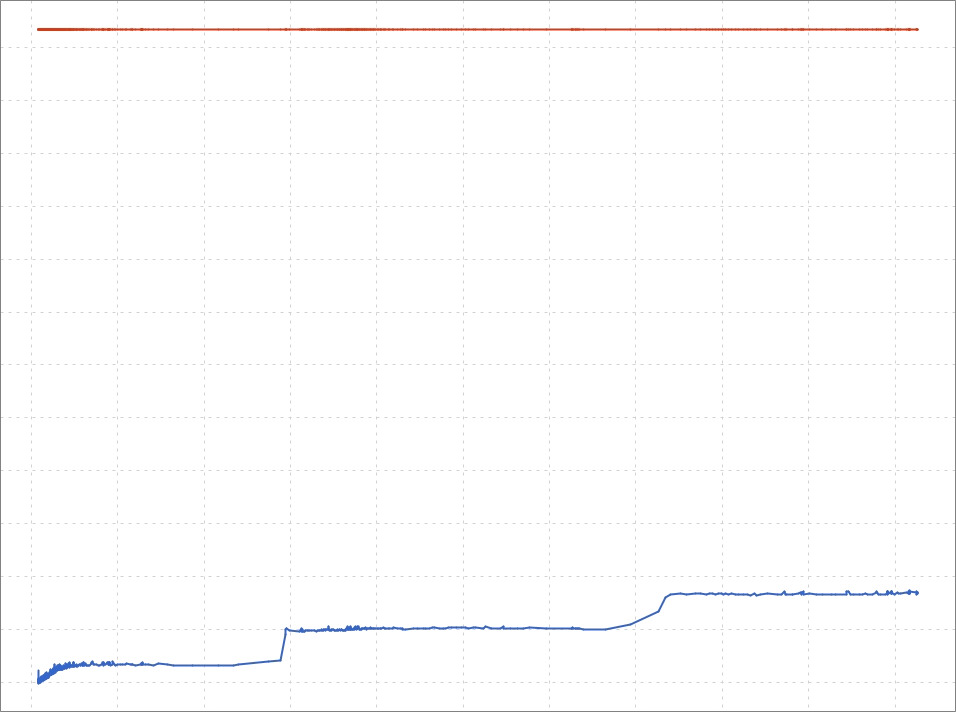
It looks like memory leak, the min(heap after gc) increasing every day, but if we look at the same chart with one additional day:
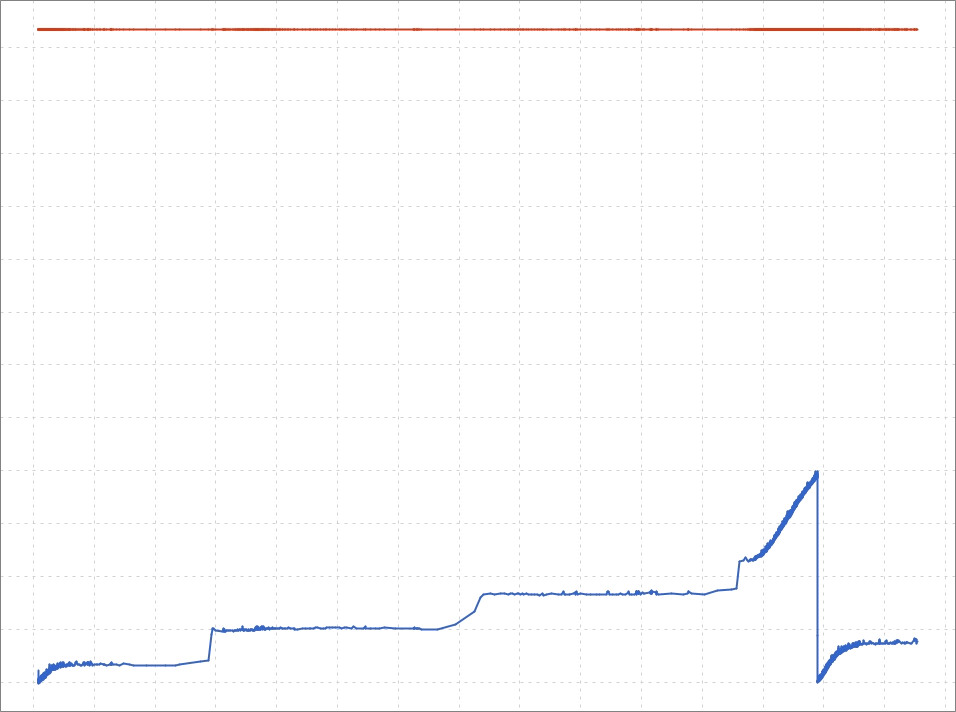
The GC cleared the heap to the previous level. This was done by old genereation cleanup that didn’t happen in previous days.
JMX monitoring
The Heap after GC chart can be generated by probing through JMX. The JVM gives that information by mBeans:
java.lang:type=GarbageCollector,name=G1 Young Generationjava.lang:type=GarbageCollector,name=G1 Old Generation
The G1 Old Generation mBean shows you information of Full GC with G1GC. With G1GC more useful information are in G1 Young Generation
mBean.
Both mBeans provide you attribute with name LastGcInfo. That attribute is composite and contains property #memoryUsageAfterGc which is a map
with keys:
MetaspaceCompressed Class SpaceCodeHeap 'profiled nmethods'CodeHeap 'non-profiled nmethods'CodeHeap 'non-nmethods'G1 Old GenG1 Survivor SpaceG1 Eden Space
The last three entries contain information about the heap. Each entry contains four values:
committedinitmaxused
The last value is the one we need. So if you want to fetch Heap after GC by JMX you need to sum used value from three entries in the map.
Here is a Java code (works on Java 11):
private static long calculateHeapAfterGC() throws IOException {
    MBeanServerConnection mBeanServerConnection = ManagementFactory.getPlatformMBeanServer();
    GarbageCollectorMXBean mxBean = ManagementFactory.newPlatformMXBeanProxy(mBeanServerConnection, "java.lang:name=G1 Young Generation,type=GarbageCollector", GarbageCollectorMXBean.class);
    GcInfo lastGcInfo = mxBean.getLastGcInfo();
    long value = 0;
    for (Map.Entry<String, MemoryUsage> usageEntry : lastGcInfo.getMemoryUsageAfterGc().entrySet()) {
        if (usageEntry.getKey().startsWith("G1")) {
            value += usageEntry.getValue().getUsed();
        }
    }
    return value;
}