[Java][Profiling][JVM] Continuous profiling with async-profiler - long time to safepoint - logs vs swap
Previous articles
If you are not familiar with safepoints please read this article first.
I’ve already written about finding the cause of long a time to safepoint with the async-profiler here. Today I’m going to show you another way.
The article about running the async-profiler in continuous mode is here.
JVM Logs
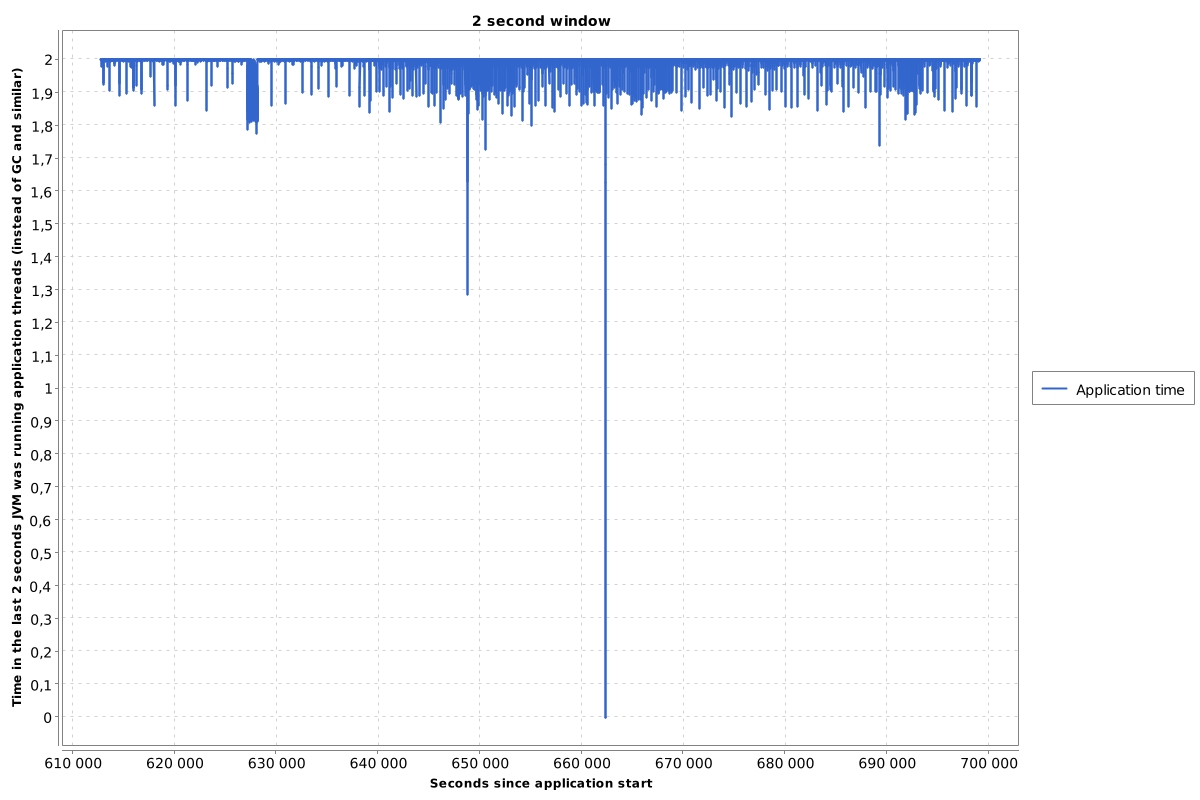
The story begins with simple JVM log file analysis. I opened the log from one day in my analyzer, and I looked at the chart that presented how long the application was working in a 2 second window (the rest was wasted by the JVM stop the world phases). That’s what I saw:

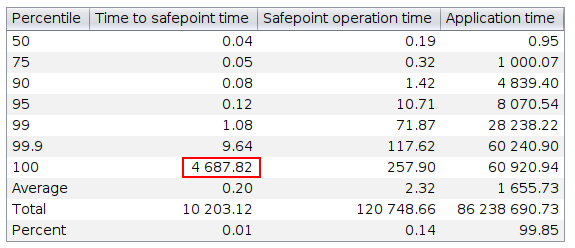
That drop to 0 means that there has been a period of time when that application have not worked at all. I looked at the sefepoint statistics:

It occurred that there was a stop the world phase that needed 4,5 seconds to reach the safepoint. I grepped the logs for the whole month. It occurred that it was not a single case. Here are stop the world operations that needed over 100 millisecond to reach the safepoint:
[2021-07-04T22:25:36.153+0200] Total time for which application threads were stopped: 0.1675529 seconds, Stopping threads took: 0.1659346 seconds
[2021-07-04T22:25:37.805+0200] Total time for which application threads were stopped: 0.2100031 seconds, Stopping threads took: 0.1444436 seconds
[2021-07-04T22:25:38.163+0200] Total time for which application threads were stopped: 0.1222631 seconds, Stopping threads took: 0.1207478 seconds
[2021-07-05T12:45:11.301+0200] Total time for which application threads were stopped: 0.4169348 seconds, Stopping threads took: 0.4166311 seconds
[2021-07-06T16:15:25.838+0200] Total time for which application threads were stopped: 0.5288704 seconds, Stopping threads took: 0.5286098 seconds
[2021-07-06T17:00:07.407+0200] Total time for which application threads were stopped: 1.0101894 seconds, Stopping threads took: 1.0098807 seconds
[2021-07-07T10:00:28.459+0200] Total time for which application threads were stopped: 0.7089137 seconds, Stopping threads took: 0.7084303 seconds
[2021-07-07T13:45:43.699+0200] Total time for which application threads were stopped: 4.6881576 seconds, Stopping threads took: 4.6878224 seconds
[2021-07-14T10:00:06.797+0200] Total time for which application threads were stopped: 0.3579812 seconds, Stopping threads took: 0.3575204 seconds
[2021-07-16T21:30:16.599+0200] Total time for which application threads were stopped: 0.3393362 seconds, Stopping threads took: 0.3390131 seconds
[2021-07-17T07:40:06.928+0200] Total time for which application threads were stopped: 0.2041511 seconds, Stopping threads took: 0.2026051 seconds
[2021-07-17T07:40:58.015+0200] Total time for which application threads were stopped: 0.2121446 seconds, Stopping threads took: 0.1336573 seconds
[2021-07-20T09:15:53.945+0200] Total time for which application threads were stopped: 0.3101399 seconds, Stopping threads took: 0.2368420 seconds
[2021-07-20T22:30:05.985+0200] Total time for which application threads were stopped: 0.6592559 seconds, Stopping threads took: 0.5688055 seconds
[2021-07-21T11:15:05.633+0200] Total time for which application threads were stopped: 0.8062940 seconds, Stopping threads took: 0.6723112 seconds
[2021-07-21T15:15:35.215+0200] Total time for which application threads were stopped: 0.7121567 seconds, Stopping threads took: 0.6002424 seconds
[2021-07-21T15:45:18.002+0200] Total time for which application threads were stopped: 0.3557823 seconds, Stopping threads took: 0.2718226 seconds
[2021-07-21T15:45:21.444+0200] Total time for which application threads were stopped: 2.3523095 seconds, Stopping threads took: 2.2783501 seconds
[2021-07-21T16:15:21.355+0200] Total time for which application threads were stopped: 1.7491264 seconds, Stopping threads took: 1.7472508 seconds
[2021-07-22T20:00:25.696+0200] Total time for which application threads were stopped: 0.9512975 seconds, Stopping threads took: 0.9506695 seconds
[2021-07-22T20:15:18.918+0200] Total time for which application threads were stopped: 1.1644567 seconds, Stopping threads took: 1.1628988 seconds
[2021-07-30T13:15:18.929+0200] Total time for which application threads were stopped: 0.4226869 seconds, Stopping threads took: 0.4220569 seconds
I wouldn’t say it is a disaster for that particular application, but I wanted to know what was going on there. At this application we run async-profiler in continuous mode. I was wondering if it is enough to diagnose a long time to safepoint. Let’s take a single situation:
[2021-08-17T07:30:33.556+0200] Application time: 0.8693884 seconds
[2021-08-17T07:30:33.729+0200] Entering safepoint region: CGC_Operation
[2021-08-17T07:30:33.958+0200] Leaving safepoint region
[2021-08-17T07:30:33.958+0200] Total time for which application threads were stopped: 0.4012551 seconds, Stopping threads took: 0.1725062 seconds
I took an output from async-profiler, JFR output format, wall mode. Using my collapse JFR tool I generated flat collapsed stack output file with thread name and timestamps.
From the log above we can read that the safepoint request was performed at 2021-08-17T07:30:33.556 and threads reached
the safepoint at 2021-08-17T07:30:33.729. So what I needed to find were threads that were in the CPU in that time period.
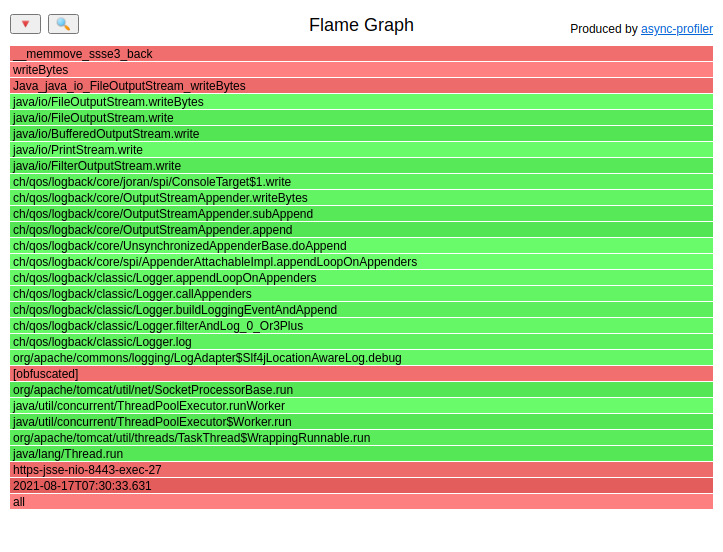
There was only one stacktrace that could be responsible for preventing the JVM to reach the safepoint:

Unfortunately the CPU file generated from wall mode JFR output doesn’t have the kernel frames. I switched the profiler to run in the CPU mode to fetch more details.
Switching to the CPU mode
I had to wait for another long time to safepoint:
[2021-08-17T13:15:05.759+0200] Application time: 0.1722344 seconds
[2021-08-17T13:15:06.321+0200] Entering safepoint region: RevokeBias
[2021-08-17T13:15:06.322+0200] Leaving safepoint region
[2021-08-17T13:15:06.322+0200] Total time for which application threads were stopped: 0.5629636 seconds, Stopping threads took: 0.5624099 seconds
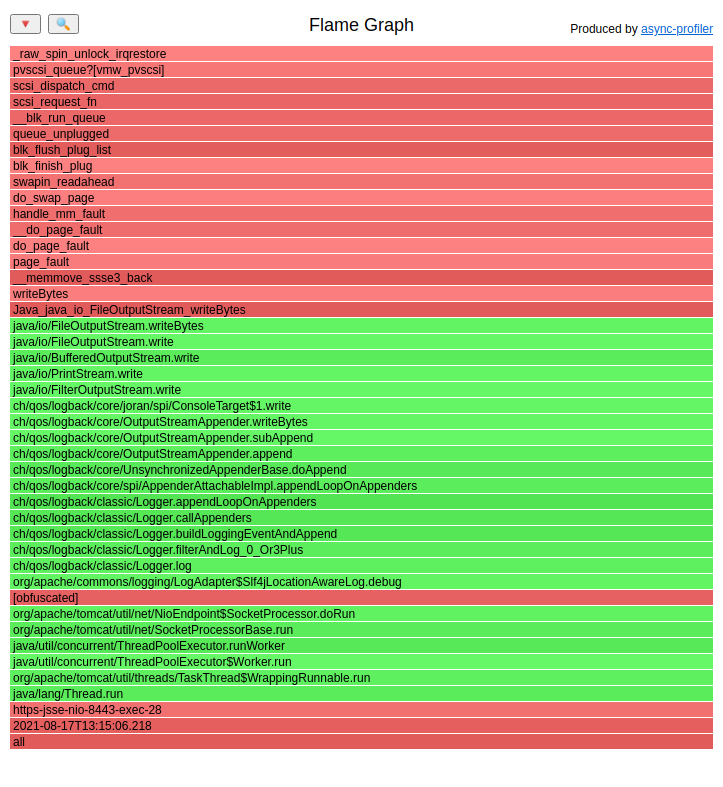
In CPU mode the stack had much more data:

What could I learn from such a stacktrace:
- There was a
logbackon it - so probably application wanted to log something - The thread executed
writeBytes - On the stacktrace there was a frame
do_page_faultanddo_swap_page
The first one was easy to check and indeed, every time there was a long time to safepoint in the application log there was a huge amount of bytes (around 10 MB) logged in one line.
The last one suggested to me that there was some memory allocation involved in that process. I looked at the sources of the JVM.
JVM sources
File io_util.c:
#define BUF_SIZE 8192

void
writeBytes(JNIEnv *env, jobject this, jbyteArray bytes,
           jint off, jint len, jboolean append, jfieldID fid)
{
    ...
    if (len == 0) {
        return;
    } else if (len > BUF_SIZE) {
        buf = malloc(len);
        if (buf == NULL) {
            JNU_ThrowOutOfMemoryError(env, NULL);
            return;
        }
    } else {
        buf = stackBuf;
    }
    (*env)->GetByteArrayRegion(env, bytes, off, len, (jbyte *)buf);
    ...
    if (buf != stackBuf) {
        free(buf);
    }
}
And yes, there was a malloc, there was a free. That native code of the JVM manages native memory, so it could do
page faults.
Can code in native stop thread from reaching the safepoint?
You can find multiple publications on the internet saying that executing native code is done at safepoint so it cannot stop the thread from reaching it. So why does that particular one do? Well, let’s try to understand it with an example:
Bug reproduction:
import java.io.BufferedOutputStream;
import java.io.FileOutputStream;

class Temp {
    public static void main(String[] args) throws Exception {
        new Thread(() -> {
            while (true) {
                Thread.getAllStackTraces();
                try {
                    Thread.sleep(1);
                } catch (InterruptedException e) {
                    return;
                }
            }
        }).start();

        byte[] arr = new byte[300 * 1024 * 1024];
        for (int i = 0; i < arr.length; i++) {
            arr[i] = (byte) i;
        }

        while (true) {
            try (BufferedOutputStream bos = new BufferedOutputStream(new FileOutputStream("/home/<username>/tmp.tmp"))) {
                bos.write(arr);
            }
        }
    }
}
The thread created in the first lines does a safepoint operation every 1 millisecond. The rest of the code simply writes a 300 MB file to the disk. Let’s run that code with such arguments:
java -Xmx700M -XX:+AlwaysPreTouch -XX:+SafepointTimeout -XX:SafepointTimeoutDelay=100 -XX:+UnlockDiagnosticVMOptions -XX:+AbortVMOnSafepointTimeout Temp
Those arguments mean that if there is any thread that time to safepoint is longer than 100 milliseconds then the JVM should crash. Here is the output:
# SafepointSynchronize::begin: Timeout detected:
# SafepointSynchronize::begin: Timed out while waiting for threads to stop.
# SafepointSynchronize::begin: Threads which did not reach the safepoint:
# "main" #1 prio=5 os_prio=0 cpu=426,71ms elapsed=0,78s tid=0x00007f43ec029000 nid=0xd9f runnable  [0x00007f43f4e92000]
   java.lang.Thread.State: RUNNABLE

# SafepointSynchronize::begin: (End of list)
#
# A fatal error has been detected by the Java Runtime Environment:
#
#  SIGILL (0x4) at pc=0x00007f43f43d5ba1 (sent by kill), pid=3486, tid=3487
#
# JRE version: OpenJDK Runtime Environment Corretto-11.0.11.9.1 (11.0.11+9) (build 11.0.11+9-LTS)
# Java VM: OpenJDK 64-Bit Server VM Corretto-11.0.11.9.1 (11.0.11+9-LTS, mixed mode, tiered, compressed oops, g1 gc, linux-amd64)
# Problematic frame:
# C  [libc.so.6+0x15bba1]  __memmove_ssse3_back+0x1b11
#
# No core dump will be written. Core dumps have been disabled. To enable core dumping, try "ulimit -c unlimited" before starting Java again
#
# An error report file with more information is saved as:
# /home/<username>/hs_err_pid3486.log
#
# If you would like to submit a bug report, please visit:
#   https://github.com/corretto/corretto-11/issues/
#
Again the problematic stacktrace contained the __memmove_ssse3_back. Let’s look at the thread area of the hs_err_pid3486.log file:
---------------  T H R E A D  ---------------
Current thread (0x00007f43ec029000):  JavaThread "main" [_thread_in_vm, id=3487, stack(0x00007f43f4d93000,0x00007f43f4e94000)]

Stack: [0x00007f43f4d93000,0x00007f43f4e94000],  sp=0x00007f43f4e90648,  free space=1013k
Native frames: (J=compiled Java code, A=aot compiled Java code, j=interpreted, Vv=VM code, C=native code)
C  [libc.so.6+0x15bba1]  __memmove_ssse3_back+0x1b11
C  [libjava.so+0x19ebc]  writeBytes+0x1fc
C  [libjava.so+0xfed7]  Java_java_io_FileOutputStream_writeBytes+0x17
j  java.io.FileOutputStream.writeBytes([BIIZ)V+0 java.base@11.0.11
j  java.io.FileOutputStream.write([BII)V+16 java.base@11.0.11
j  java.io.BufferedOutputStream.write([BII)V+20 java.base@11.0.11
j  java.io.FilterOutputStream.write([B)V+5 java.base@11.0.11
j  Temp.main([Ljava/lang/String;)V+58
v  ~StubRoutines::call_stub
V  [libjvm.so+0x8c4db9]  JavaCalls::call_helper(JavaValue*, methodHandle const&, JavaCallArguments*, Thread*)+0x3b9
V  [libjvm.so+0x942c8c]  jni_invoke_static(JNIEnv_*, JavaValue*, _jobject*, JNICallType, _jmethodID*, JNI_ArgumentPusher*, Thread*) [clone .isra.71] [clone .constprop.266]+0x19c
V  [libjvm.so+0x944dbe]  jni_CallStaticVoidMethod+0x15e
C  [libjli.so+0xb15a]  JavaMain+0xd5a
C  [libjli.so+0xebc9]  ThreadJavaMain+0x9

Java frames: (J=compiled Java code, j=interpreted, Vv=VM code)
j  java.io.FileOutputStream.writeBytes([BIIZ)V+0 java.base@11.0.11
j  java.io.FileOutputStream.write([BII)V+16 java.base@11.0.11
j  java.io.BufferedOutputStream.write([BII)V+20 java.base@11.0.11
j  java.io.FilterOutputStream.write([B)V+5 java.base@11.0.11
j  Temp.main([Ljava/lang/String;)V+58
v  ~StubRoutines::call_stub
In the first line after the header you can find the thread state which is _thread_in_vm. You can find all possible
states in the File globalDefinitions.hpp:
There are 4 essential states:
_thread_new : Just started, but not executed init. code yet (most likely still in OS init code)
_thread_in_native : In native code. This is a safepoint region, since all oops will be in jobject handles
_thread_in_vm : Executing in the vm
_thread_in_Java : Executing either interpreted or compiled Java code (or could be in a stub)
The key thing is that if your thread is in the _thread_in_native state then it is at the ssafepoint and it
doesn’t affect the time to safepoint. But if your thread is in the _thread_in_vm state, well, you are screwed.
That state completely stops the thread from reaching the safepoint.
Fix
What can we do in that application? Here are possible solutions:
- disable swap - at this server there is the swap that is used with 200 MB, we can easily disable it
- stop logging so much at one line
TBC
Check this article for a deeper explanation.