[Java][JVM][Tuning][Profiling] Time to safepoint - finally there is a tool to find long ones, and yes it is the async-profiler
What are safepoints and time to safepoint?
If you are not familiar with those terms please read this article first.
Problem to fix
As I mentioned in the article above one compilation can make a whole application slow. To do this it needs to have a long time to safepoint. This problem is more visible if:
- there are multiple application threads running
- the JVM is doing many safepoint operations
- compilations with long time to safepoint are run frequently
How can we diagnose such a problem?
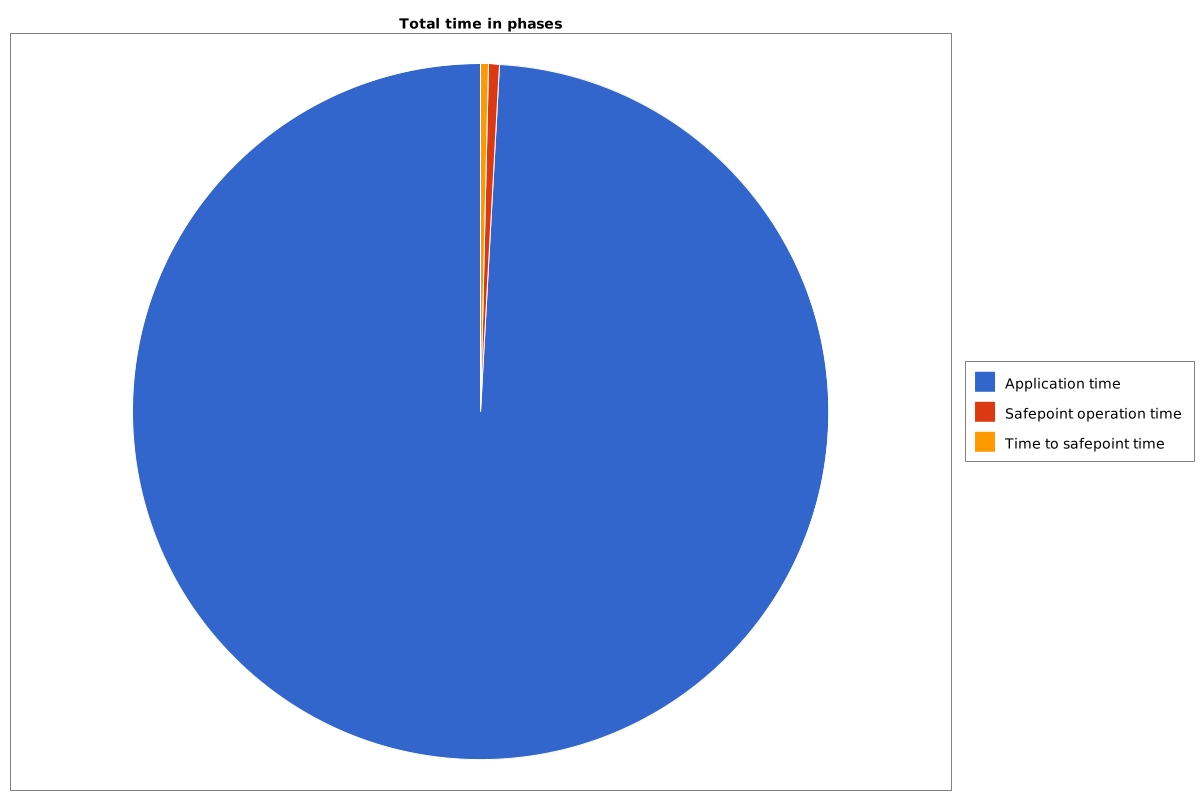
The easiest way is to enable safepoint logs and do an analysis of its output. I wrote how to do it in the article mentioned above. We can see on a following pie chart, that there is some visible time spent on time to safepoint (orange part of chart):
We can also calculate average and percentiles:
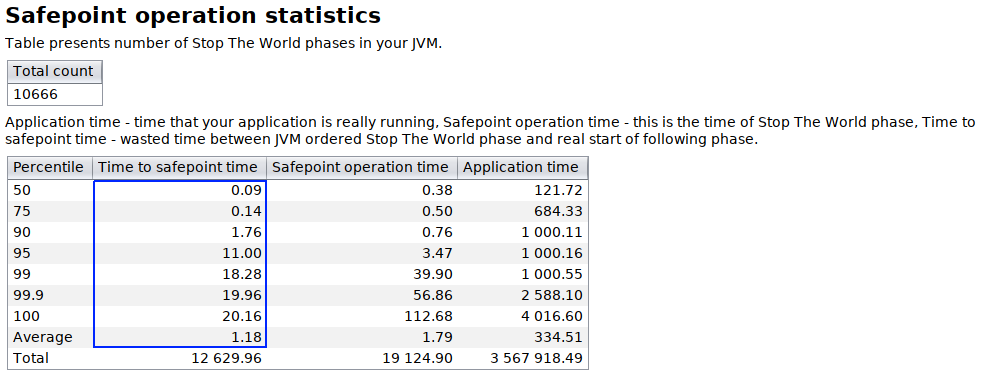
The “100 percentile” shows that there was a STW phase, where at least one thread needed 20.16ms to reach safepoint. That is not a good result.
What JVM offers us to find such a compilation?
There are 2 flags that can help us in detection of long time to safepoint.
-XX:+SafepointTimeout
-XX:SafepointTimeoutDelay=100
Such settings will print an information about a thread that time to safepoint was longer than 100ms. Sample output of that situation:
# SafepointSynchronize::begin: Timeout detected:
# SafepointSynchronize::begin: Timed out while spinning to reach a safepoint.
# SafepointSynchronize::begin: Threads which did not reach the safepoint:
# "main" #1 prio=5 os_prio=0 cpu=1191,10ms elapsed=16,19s tid=0x00007f58bc014000 nid=0x130d runnable  [0x0000000000000000]
   java.lang.Thread.State: RUNNABLE
# SafepointSynchronize::begin: (End of list)
In the fourth line we can see thread name that is causing troubles: main.
The other thing that we can do in newest JDKs is to add:
-XX:+UnlockDiagnosticVMOptions
-XX:+AbortVMOnSafepointTimeout
Sample output:
# A fatal error has been detected by the Java Runtime Environment:
#
#  SIGILL (0x4) at pc=0x00007f020091191f (sent by kill), pid=12321, tid=12325
#
# JRE version: OpenJDK Runtime Environment (11.0.6+10) (build 11.0.6+10-LTS)
# Java VM: OpenJDK 64-Bit Server VM (11.0.6+10-LTS, mixed mode, tiered, compressed oops, g1 gc, linux-amd64)
# Problematic frame:
# v  ~StubRoutines::libmPow
#
# Core dump will be written. Default location: Core dumps may be processed with "/lib/systemd/systemd-coredump %P %u %g %s %t 9223372036854775808 %h" (or dumping to /tmp/core.12321)
#
# An error report file with more information is saved as:
# /tmp/hs_err_pid12321.log
Compiled method (c2)   16223  221       4       pl.britenet.codecache.math.MathLock::calculateSomething (29 bytes)
 total in heap  [0x00007f02084be990,0x00007f02084beeb0] = 1312
 relocation     [0x00007f02084beb08,0x00007f02084beb10] = 8
 main code      [0x00007f02084beb20,0x00007f02084bee60] = 832
 stub code      [0x00007f02084bee60,0x00007f02084bee78] = 24
 oops           [0x00007f02084bee78,0x00007f02084bee80] = 8
 scopes data    [0x00007f02084bee80,0x00007f02084bee88] = 8
 scopes pcs     [0x00007f02084bee88,0x00007f02084beea8] = 32
 dependencies   [0x00007f02084beea8,0x00007f02084beeb0] = 8
Could not load hsdis-amd64.so; library not loadable; PrintAssembly is disabled
#
# If you would like to submit a bug report, please visit:
#   http://bugreport.java.com/bugreport/crash.jsp
#
Unfortunately this option kills JVM when it hits time to safepoint timeout. Most useful information from that output is:
# Problematic frame:
# v  ~StubRoutines::libmPow
It can also create core dump if you have proper settings on your OS level.
Now you have to connect that StubRoutines::libmPow is an intrinsic method, and in the Java code it is
java.lang.Math.pow(). It is not an easy task to do
if you are not familiar with JIT internals.
At last: solution! Async-profiler
There is a new feature in the async-profiler that allow you to pass to profiler:
- on which method the profiler should start its work
- on which method the profiler should end its work
As described in the issue #74 it can be used to track time to safepoints. We simply need to pass following parameters to async-profiler.
--begin SafepointSynchronize::begin --end RuntimeService::record_safepoint_synchronized
This feature is available in version 2.0. While writing this article this version is already in “early access” stage.
Demo time
Long time ago I prepared an application that suffered from a long time to safepoint issue. Let’s run the profiler on this application with parameters:
- -t - dump also thread names
- -d 10 - duration time is 10 seconds
- -o collapsed - result file will be in collapsed stack format
- -f /tmp/tts.collased - result file path
- –begin SafepointSynchronize::begin –end RuntimeService::record_safepoint_synchronized - time to safepoint profiling
- SafepointApplication - it is a name of my main class
./profiler.sh -t -d 10 -o collapsed -f /tmp/tts.collased --begin SafepointSynchronize::begin --end RuntimeService::record_safepoint_synchronized SafepointApplication
Demo result
The result is in collapsed stack format, I will use my own open source tool collapsed-stack-viewer to view it. First, let’s generate a flame graph:
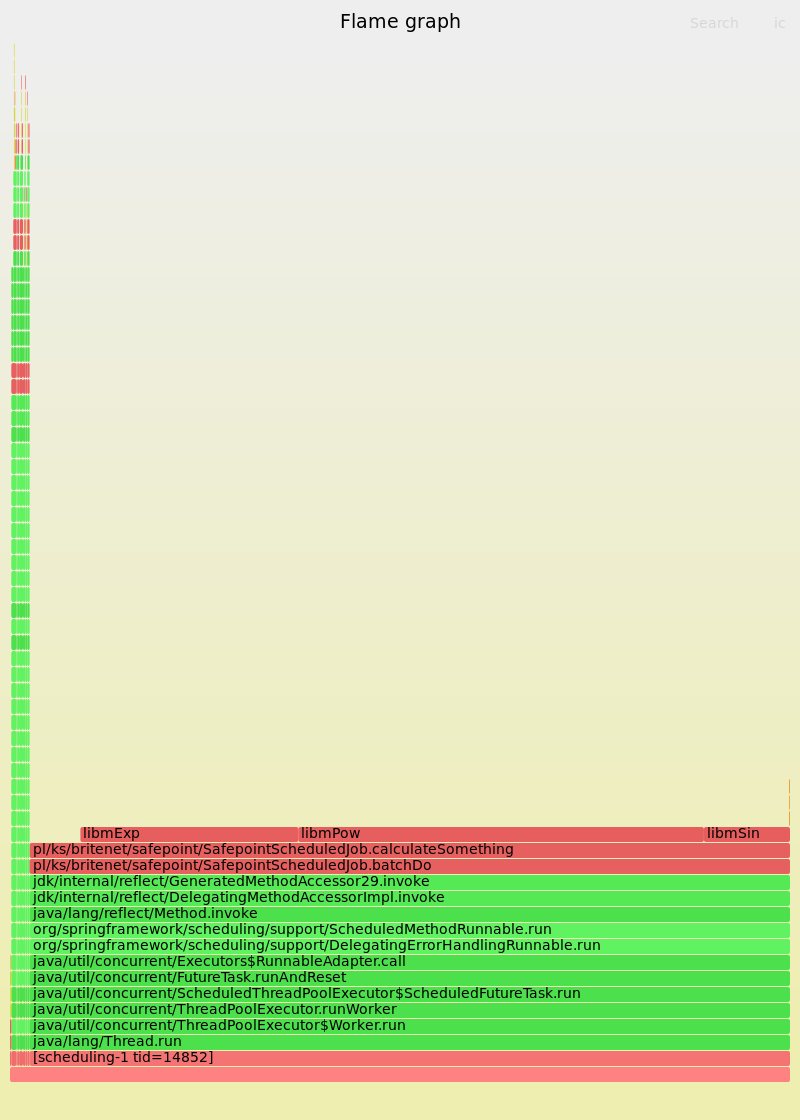
This flame graph starts with a thread name at the bottom. From this one we can see that:
- There is one thread that caused long time to safepoint:
scheduling-1 - Almost all the time application waited to reach the safepoint was spent in method
pl/ks/britenet/safepoint/SafepointScheduledJob.calculateSomething
Source code of that method:
static double calculateSomething(int iterations, double start) {
    for (int i = 0; i < iterations; i++) {
        start += Math.pow(Math.exp(start), Math.sin(start));
    }
    return start;
}
What is wrong with that method?
If you look in the source code of JDK you will find, that Math.pow(), Math.exp(), Math.sin() are intrinsic methods:
@HotSpotIntrinsicCandidate
public static double pow(double a, double b) {
    return StrictMath.pow(a, b); // default impl. delegates to StrictMath
}

@HotSpotIntrinsicCandidate
public static double exp(double a) {
    return StrictMath.exp(a); // default impl. delegates to StrictMath
}

@HotSpotIntrinsicCandidate
public static double sin(double a) {
    return StrictMath.sin(a); // default impl. delegates to StrictMath
}
Mind that the @HotSpotIntrinsicCandidate annotation was introduced in Java 9.
So this method is basically a loop where we count something using 3 intrinsic methods. In the loop there is used int as incremental value with known
end value. For JVM this is something that is called counted loop. Now:
- Counted loops didn’t have safepoint before optimization loop strip mining (introduced in Java 10, working good in Java 11u4, after fixing JDK-8220374)
- Intrinsics doesn’t have safepoint
So the first safepoint in calculateSomething after being JIT compiled is at the end of the method.
One more thing about the loop strip mining: it is not enabled by default with every GC. As far as I know it is enabled only with G1, Z and Shenandoah. In other collectors, like parallel or CMS, you need to add additional VM arguments to make it work:
-XX:+UseCountedLoopSafepoints
-XX:LoopStripMiningIter=1000
Problem with one thread is an easy one
If the flame graph with threads names would show that problem exists in multiple threads then I would generate a hotspot flame graph:
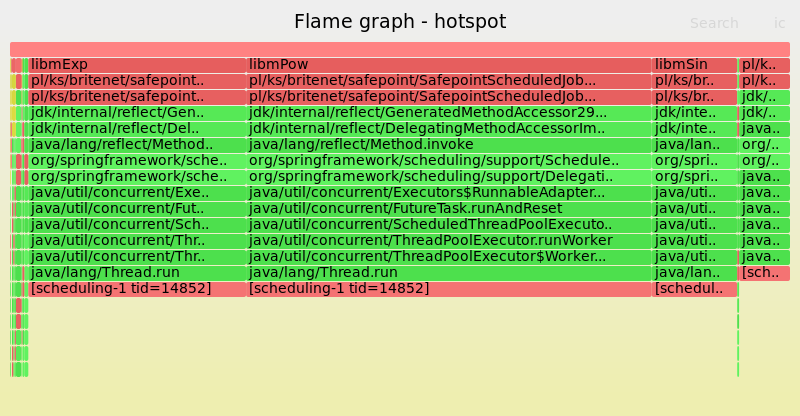
Also I would look for methods with a long total time in collapsed-stack-viewer.
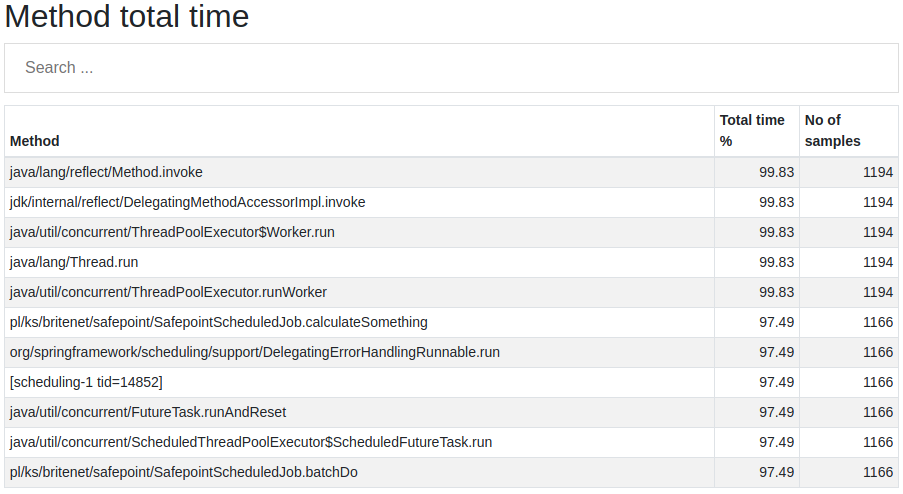
That is how I usually look for any resource consuming methods in my Java applications.
Great, but how to fix it?
Upgrade, upgrade, upgrade
I saw applications where simple upgrades form Java 11u2 to 11u4 solved the problem. The loop strip mining optimization helped.
Counted loops
If you have an issue with counted loops you can make them uncounted, usually this is very simple, but you have to know which loop is counted. if you don’t know it here is an article for you.
Array copy :(
From JDK source code:
@HotSpotIntrinsicCandidate
public static native void arraycopy(Object src,  int  srcPos,
                                    Object dest, int destPos,
                                    int length);
I saw an application where this method was a problem. Whole arraycopy method has no safepoint at all, so if you are copying large arrays it may cause
a long time to safepoint. If your application uses this method directly you can write your own arraycopy. Your implementation will not be as fast
as the intrinsic one, but only the thread that uses it will suffer, not the whole application.
If problematic arraycopy is used by deep JDK internals or any of your framework then, well, you are screwed. I know some solutions, but they are very
ugly.
Divide and conquer
There are situations where you can take the problematic part of the application and move it to another one (or completely new). With this method you won’t eliminate the problem, but you will make the rest of your application not vulnerable to long time to safepoint issue.