[Java][JVM][Tuning][Profiling][G1] Can G1GC cause outage?
Big fat warning
This article shows some JVM tuning using some JVM flags. It helped with the application described below, but it doesn’t mean that it will help your application. You should never use any JVM flags without knowing what consequences they may produce.
Outage description
- Normally the application needs ~55% of 8GB heap
- When the application has ~10% of heap left the GC runs frequently
- The application becomes not responsible
- After an outage young generation is empty, all objects are in old generation
- Application is stateless
- JDK 11
- I have no idea what flags are used, will be fun :) All I have are GC logs
Steps done to mitigate problem
Person who had that problem decided to add 4GB more heap, it didn’t help.
GC logs
Unfortunately we don’t have GC logs during the outage. All we have are GC logs after adding more heap, ~24h from the start of a new instance of the application.
Let’s draw some charts from that log. First one is the heap size after the GC that show to what level G1 can free the heap:
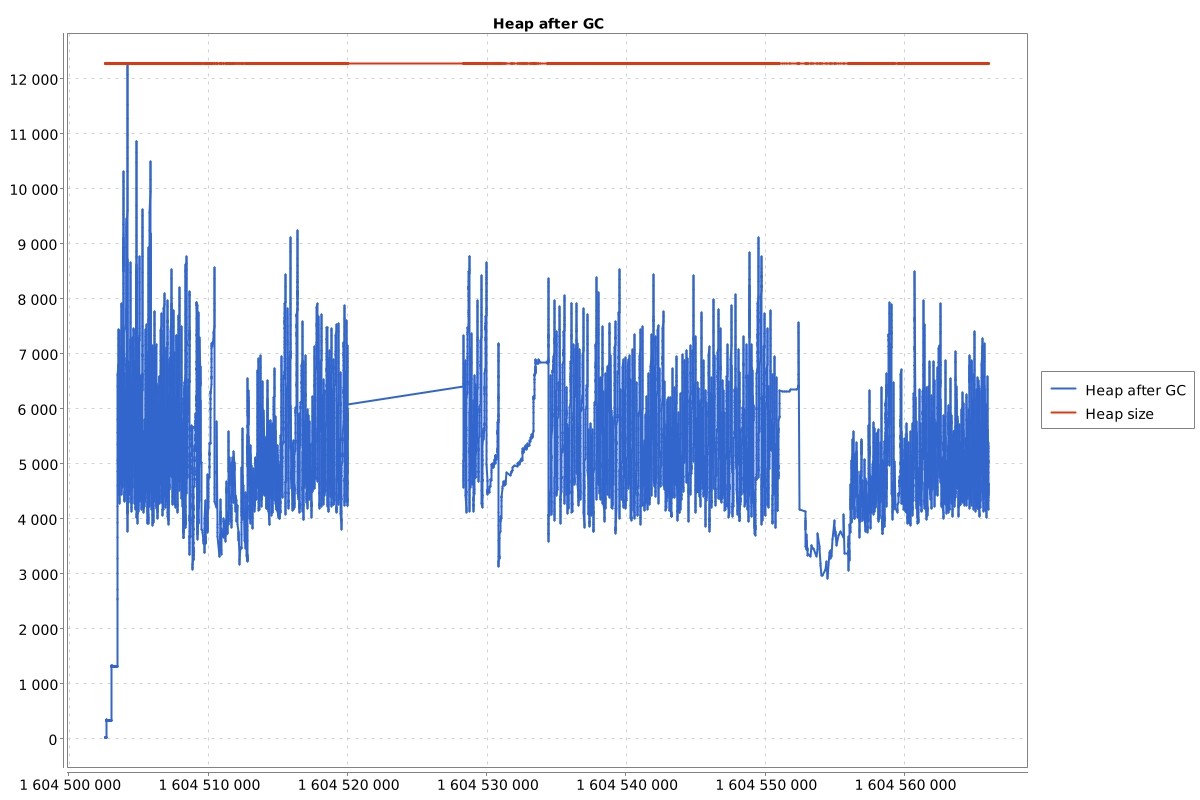
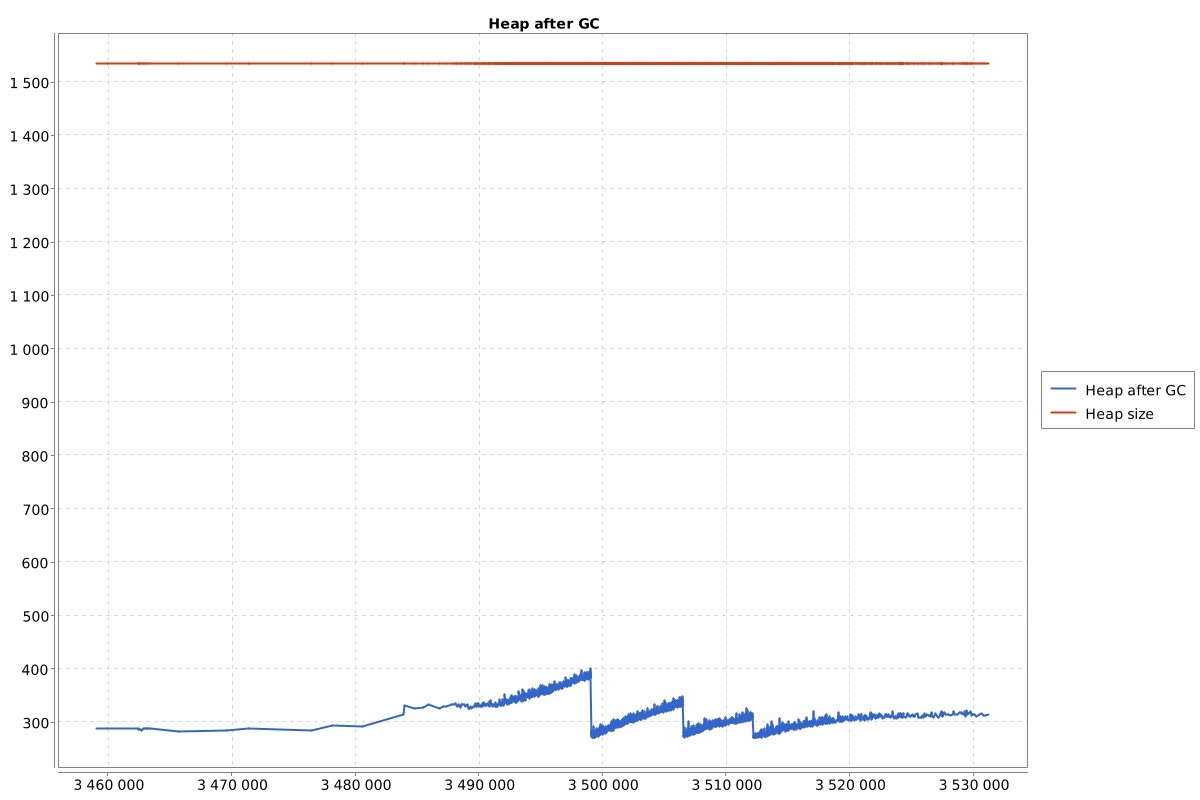
This chart is really really crazy. Usually (from my experience) that chart for a stateless application looks like this:
One think is also visible in the first chart, at the very beginning we can see big peak, lets see some table stats of GC:
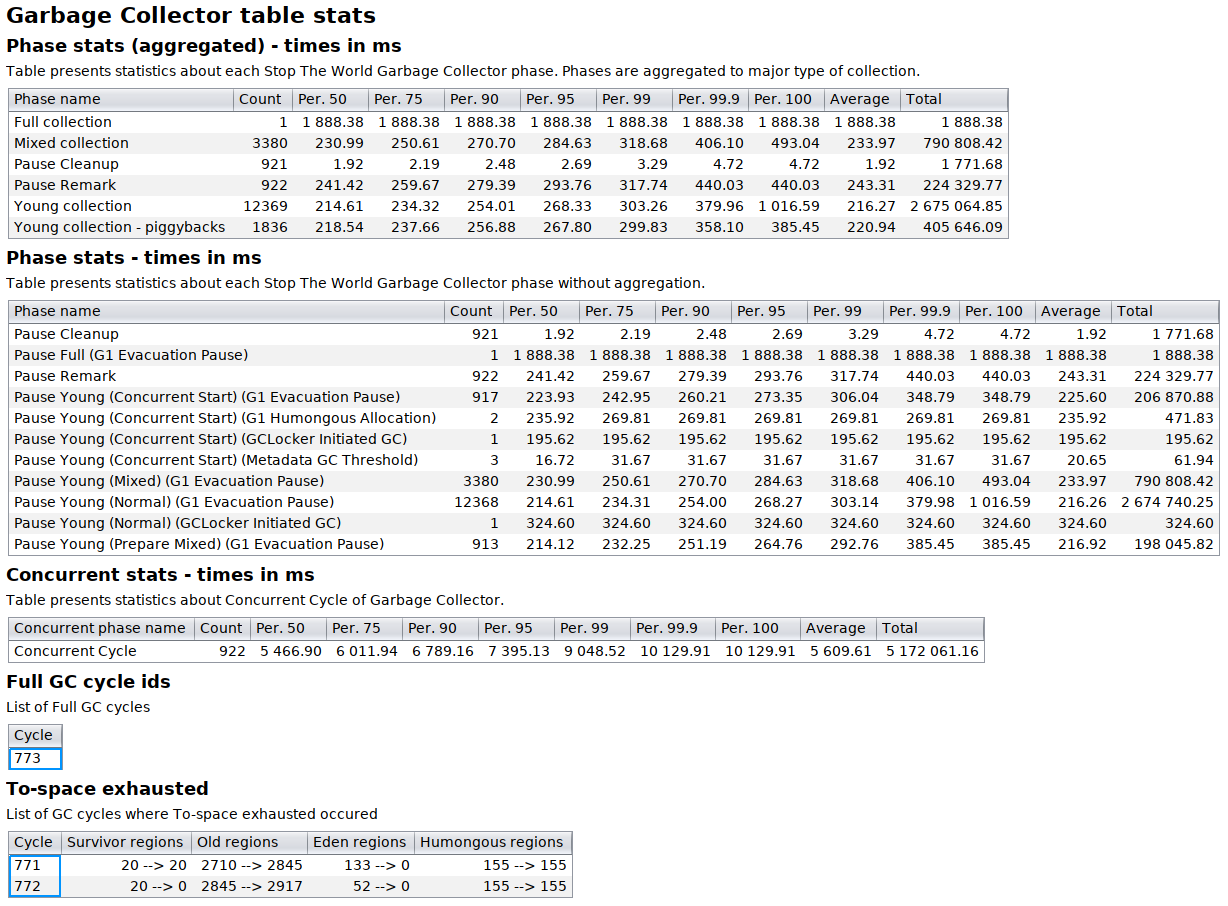
At the bottom of these stats we can see (in the blue frames), that there was one Full GC cycle (number 773), that has occurred soon after two of to-space exhausted (no room for GC to copy objects). Let’s look at those collections in plain text GC log.
GC(768) Pause Young (Normal) (G1 Evacuation Pause) 11290M->10968M(12288M) 290.167ms
GC(769) Pause Young (Normal) (G1 Evacuation Pause) 11500M->11286M(12288M) 255.971ms
GC(770) Pause Young (Normal) (G1 Evacuation Pause) 11818M->11538M(12288M) 240.065ms
GC(771) To-space exhausted
GC(771) Pause Young (Normal) (G1 Evacuation Pause) 12070M->12080M(12288M) 260.683ms
GC(772) To-space exhausted
GC(772) Pause Young (Normal) (G1 Evacuation Pause) 12288M->12288M(12288M) 301.251ms
GC(773) Pause Full (G1 Evacuation Pause) 12288M->3781M(12288M) 1888.382ms
So the heap is almost maxed out, ~90% is used, and then Full GC clears the heap to 31%. Pause young couldn’t free those objects, so probably ~60% of garbage is in the old generation.
The other thing that we can see in the table with to-space exhausted statistics is that there are over 2700 old regions, and only 50-130 young regions. Let’s see another chart that shows us how many eden and survivor regions are calculated to be “optimal” by G1.
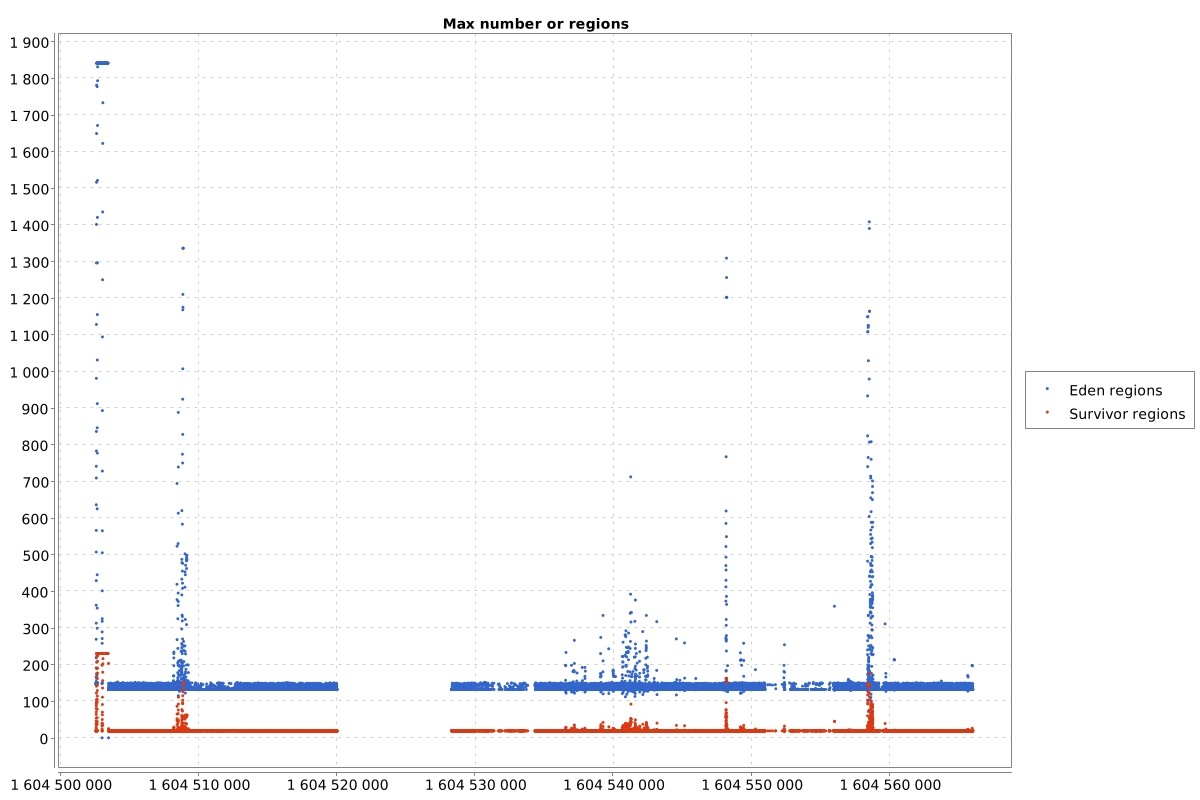
So at the beginning G1 believes that there should be ~1850, but after that it changes its mind, and uses only ~150 eden regions. There are moments in time when G1 tries to increase that number, but soon after that it drops again to ~150. Region size is 4M, so we have ~600MB of young generation. If you want to know how to find the region size in your JVM check my previous article. Let’s look at the allocation rate:
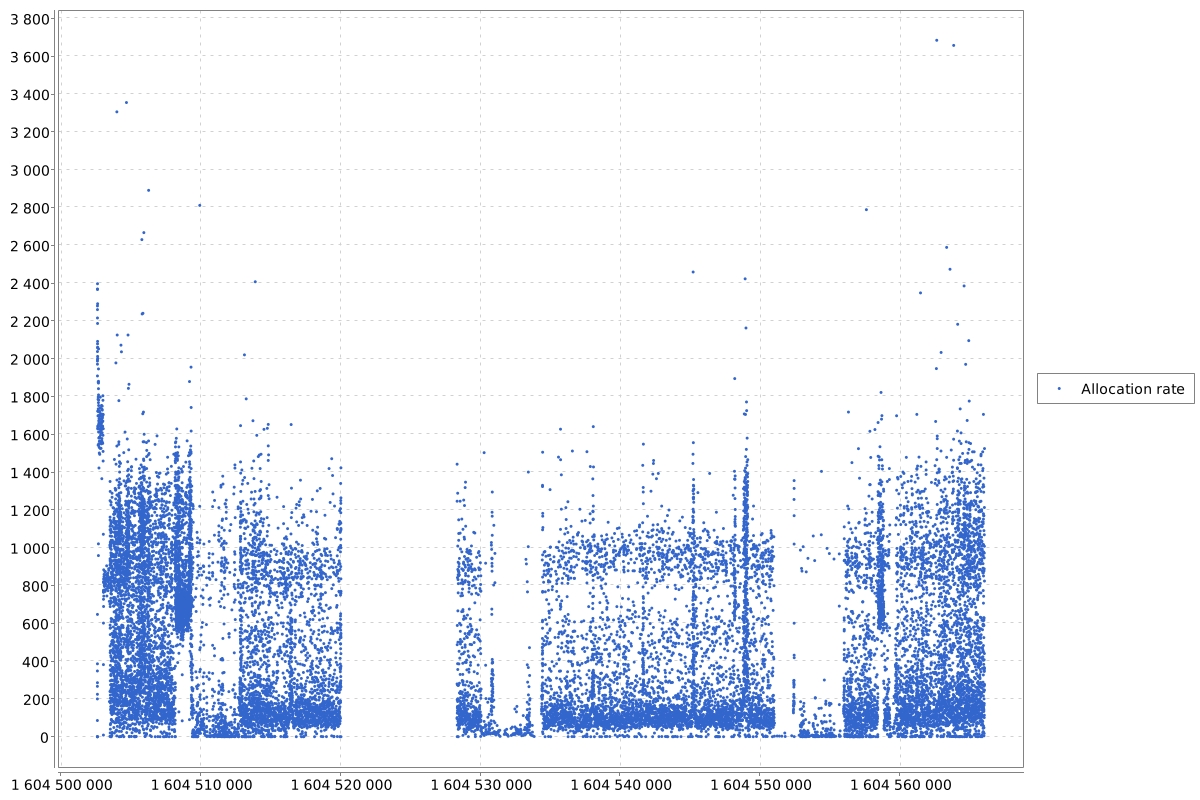
You can calculate allocation rate by yourself. You need to look at the two consecutive GC cycle logs with timestamps:
[53792.194s] GC(45920) Pause Young (Normal) (G1 Evacuation Pause) 5031M->4733M(12288M) 189.428ms
[53795.607s] GC(45921) Pause Young (Normal) (G1 Evacuation Pause) 5265M->4807M(12288M) 205.214ms
In this log a->b means that the GC started cycle when the heap had size a, and cleaned it to size b. The allocation rate is simply difference between the size at the start of next cycle and the size at the end of previous one, divided by time difference. So in the example above the allocation rate is:
(5265M - 4733M) / (53795.607s - 53792.194s) = 155,87 M/s
Let’s go back to the chart I presented above. When application is used it creates ~400MB/s of objects. So it fills the young generation in the 1,5s. Great, so when there is some peak in allocation it can be even worse. Let’s see when GC starts its work:
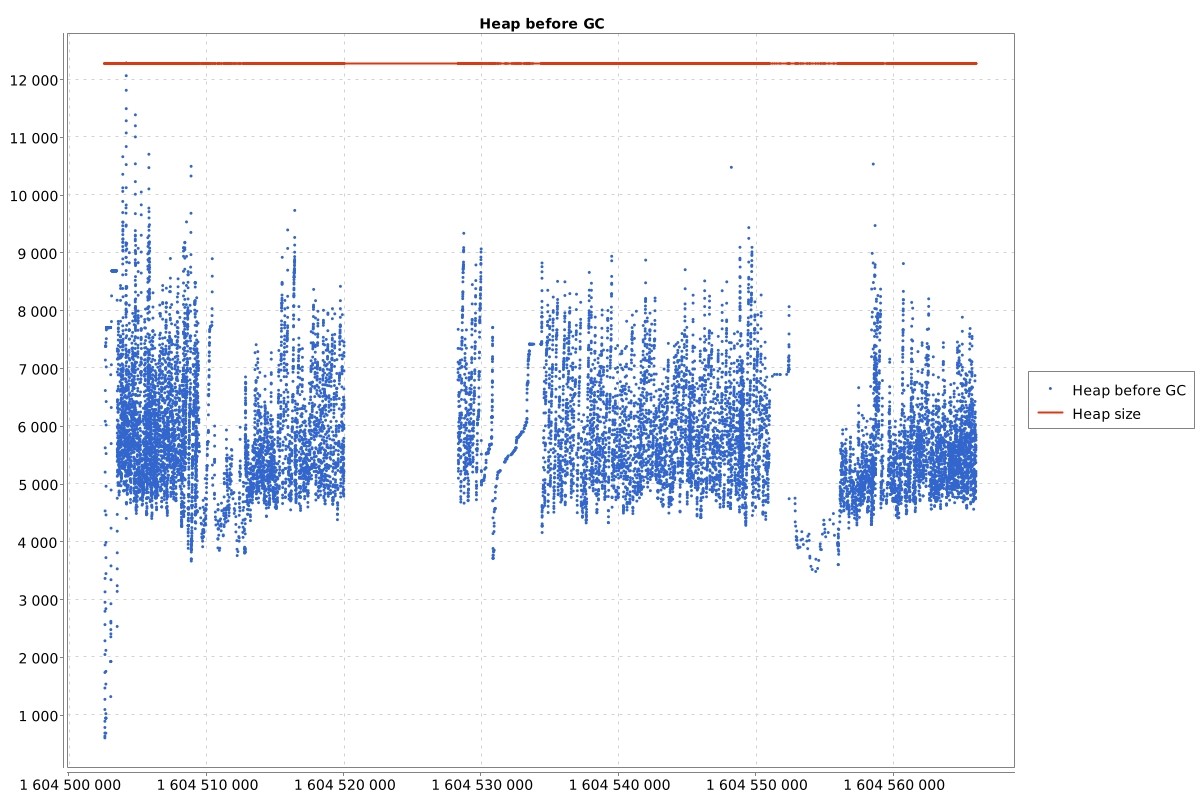
So G1 has 30-70% of heap free and starts its work. That is not good behavior.
Defaults
Let’s talk about default G1 settings:
- MaxGCPauseMillis = 200ms
- G1NewSizePercent = 5%
- G1MaxNewSizePercent = 60%
Simplifying G1 can manipulate the young generation between 5% and 60% of the whole heap, and it tries to finish Stop-the-world (STW) paused collections in 200ms.
Let’s go deeper
It looks that G1 thinks that young collection should be 5% of the whole heap. Let’s try to find out why. I saw such behavior before, but dropping eden size was done just before mixed collections. This situation is completely different. Let’s look at pure text GC logs, and see what G1 is doing during the GC cycles, and see if it can manage to deliver 200ms STW time.
GC(21370) Pause Young (Prepare Mixed) (G1 Evacuation Pause) 5961M->5457M(12288M) 217.795ms
GC(21371) Pause Young (Mixed) (G1 Evacuation Pause) 6017M->5209M(12288M) 221.104ms
GC(21372) Pause Young (Mixed) (G1 Evacuation Pause) 5741M->5001M(12288M) 210.296ms
GC(21373) Pause Young (Mixed) (G1 Evacuation Pause) 5533M->4773M(12288M) 213.343ms
GC(21374) Pause Young (Mixed) (G1 Evacuation Pause) 5305M->4703M(12288M) 206.145ms
GC(21375) Pause Young (Mixed) (G1 Evacuation Pause) 5235M->4673M(12288M) 212.913ms
GC(21376) Pause Young (Normal) (G1 Evacuation Pause) 5205M->5003M(12288M) 229.900ms
GC(21377) Pause Young (Normal) (G1 Evacuation Pause) 5535M->5219M(12288M) 222.417ms
GC(21378) Pause Young (Normal) (G1 Evacuation Pause) 5751M->5377M(12288M) 242.207ms
GC(21379) Pause Young (Normal) (G1 Evacuation Pause) 5909M->5581M(12288M) 222.517ms
GC(21380) Pause Young (Normal) (G1 Evacuation Pause) 6113M->5669M(12288M) 216.024ms
GC(21381) Pause Young (Normal) (G1 Evacuation Pause) 6201M->5665M(12288M) 184.403ms
GC(21382) Pause Young (Normal) (G1 Evacuation Pause) 6241M->5734M(12288M) 168.545ms
GC(21383) Pause Young (Normal) (G1 Evacuation Pause) 6266M->5749M(12288M) 179.863ms
GC(21384) Pause Young (Normal) (G1 Evacuation Pause) 6281M->5780M(12288M) 187.929ms
GC(21385) Pause Young (Normal) (G1 Evacuation Pause) 6352M->5871M(12288M) 197.393ms
GC(21386) Pause Young (Normal) (G1 Evacuation Pause) 6403M->5929M(12288M) 192.253ms
GC(21387) Pause Young (Normal) (G1 Evacuation Pause) 6461M->6143M(12288M) 212.958ms
GC(21388) Pause Young (Normal) (G1 Evacuation Pause) 6675M->6377M(12288M) 186.021ms
All the GC STW pauses are ~200ms +- 30ms. Hmmmm. That is strange, the young generation is only 5% of the whole heap, cleaning of 600MB should not last so long. Let’s see the details of one collection:
GC(21383) Pause Young (Normal) (G1 Evacuation Pause)
GC(21383) Using 8 workers of 8 for evacuation
GC(21383)   Pre Evacuate Collection Set: 0.1ms
GC(21383)     Prepare TLABs: 0.0ms
GC(21383)     Choose Collection Set: 0.0ms
GC(21383)     Humongous Register: 0.1ms
GC(21383)   Evacuate Collection Set: 11.4ms
GC(21383)     Ext Root Scanning (ms):   Min:  0.2, Avg:  0.2, Max:  0.2, Diff:  0.0, Sum:  1.7, Workers: 8
GC(21383)     Update RS (ms):           Min:  0.2, Avg:  0.5, Max:  1.3, Diff:  1.1, Sum:  3.7, Workers: 8
GC(21383)       Processed Buffers:        Min: 1, Avg:  3.9, Max: 13, Diff: 12, Sum: 31, Workers: 8
GC(21383)       Scanned Cards:            Min: 79, Avg: 169.6, Max: 256, Diff: 177, Sum: 1357, Workers: 8
GC(21383)       Skipped Cards:            Min: 0, Avg:  0.0, Max: 0, Diff: 0, Sum: 0, Workers: 8
GC(21383)     Scan RS (ms):             Min:  0.0, Avg:  0.0, Max:  0.1, Diff:  0.1, Sum:  0.2, Workers: 8
GC(21383)       Scanned Cards:            Min: 0, Avg:  0.0, Max: 0, Diff: 0, Sum: 0, Workers: 8
GC(21383)       Claimed Cards:            Min: 0, Avg:  0.0, Max: 0, Diff: 0, Sum: 0, Workers: 8
GC(21383)       Skipped Cards:            Min: 0, Avg:  0.0, Max: 0, Diff: 0, Sum: 0, Workers: 8
GC(21383)     Code Root Scanning (ms):  Min:  0.0, Avg:  0.0, Max:  0.0, Diff:  0.0, Sum:  0.0, Workers: 8
GC(21383)     AOT Root Scanning (ms):   skipped
GC(21383)     Object Copy (ms):         Min:  9.8, Avg: 10.6, Max: 10.9, Diff:  1.1, Sum: 84.7, Workers: 8
GC(21383)     Termination (ms):         Min:  0.0, Avg:  0.0, Max:  0.0, Diff:  0.0, Sum:  0.0, Workers: 8
GC(21383)       Termination Attempts:     Min: 1, Avg:  1.2, Max: 2, Diff: 1, Sum: 10, Workers: 8
GC(21383)     GC Worker Other (ms):     Min:  0.0, Avg:  0.0, Max:  0.0, Diff:  0.0, Sum:  0.2, Workers: 8
GC(21383)     GC Worker Total (ms):     Min: 11.3, Avg: 11.3, Max: 11.3, Diff:  0.0, Sum: 90.5, Workers: 8
GC(21383)   Post Evacuate Collection Set: 167.0ms
GC(21383)     Code Roots Fixup: 0.0ms
GC(21383)     Clear Card Table: 0.3ms
GC(21383)     Reference Processing: 0.2ms
GC(21383)     Weak Processing: 0.1ms
GC(21383)     String Dedup Fixup: 165.5ms
GC(21383)     Queue Fixup (ms):         Min:  0.0, Avg:  0.0, Max:  0.0, Diff:  0.0, Sum:  0.0, Workers: 8
GC(21383)     Table Fixup (ms):         Min: 165.3, Avg: 165.4, Max: 165.4, Diff:  0.1, Sum: 1323.0, Workers: 8
GC(21383)     Merge Per-Thread State: 0.0ms
GC(21383)     Code Roots Purge: 0.0ms
GC(21383)     Redirty Cards: 0.1ms
GC(21383)     DerivedPointerTable Update: 0.0ms
GC(21383)     Free Collection Set: 0.6ms
GC(21383)     Humongous Reclaim: 0.3ms
GC(21383)     Start New Collection Set: 0.0ms
GC(21383)     Resize TLABs: 0.0ms
GC(21383)     Expand Heap After Collection: 0.0ms
GC(21383)   Other: 0.5ms
GC(21383) Eden regions: 133->0(133)
GC(21383) Survivor regions: 20->20(20)
GC(21383) Old regions: 1259->1263
GC(21383) Humongous regions: 155->155
GC(21383) Metaspace: 88857K->88857K(1128448K)
GC(21383) Pause Young (Normal) (G1 Evacuation Pause) 6266M->5749M(12288M) 179.863ms
GC(21383) User=1.37s Sys=0.04s Real=0.18s
We can also see aggregated stats from whole log file:
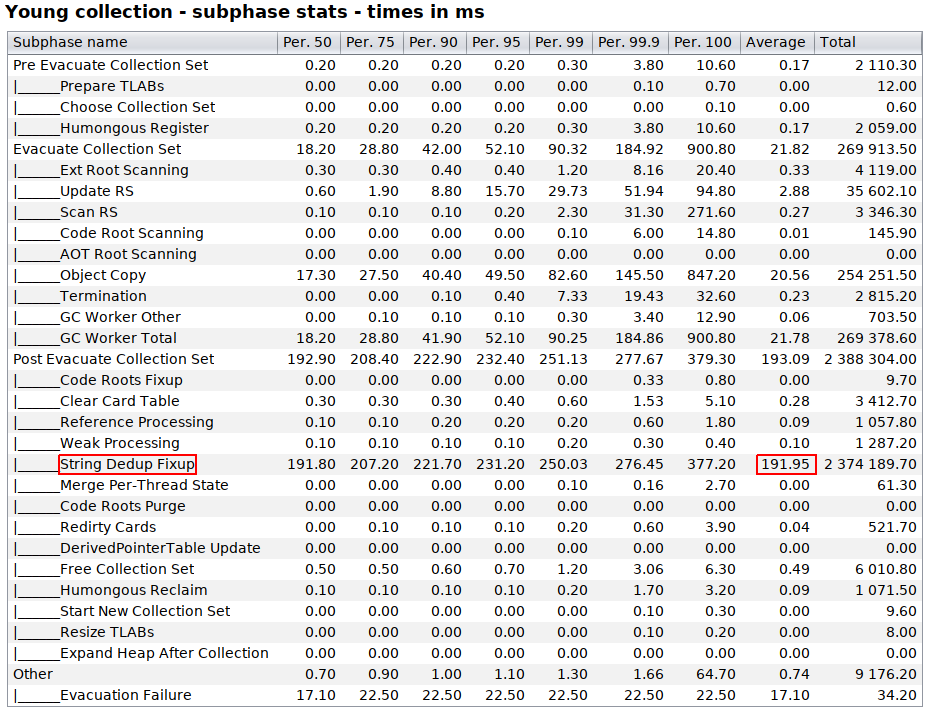
We can see that >90% of time the GC spends during string dedup fixup (marked in red frames). So G1 is doing a good job, it should spend 200ms in STW phase, but it needs ~190ms to fix string deduplications, so it has 10ms for cleaning the young collection. That is why it drops the young collection size to 5%.
String deduplication
String deduplication was introduced in JDK 8 with JEP 192. Long story short if we have in our application multiple String instances with the same value, this optimization will remove unnecessary duplicated char[]/byte[] from the heap. It can be done, because Strings are immutable. So if we have two Strings with “some text” value, we have such a structure on the heap:
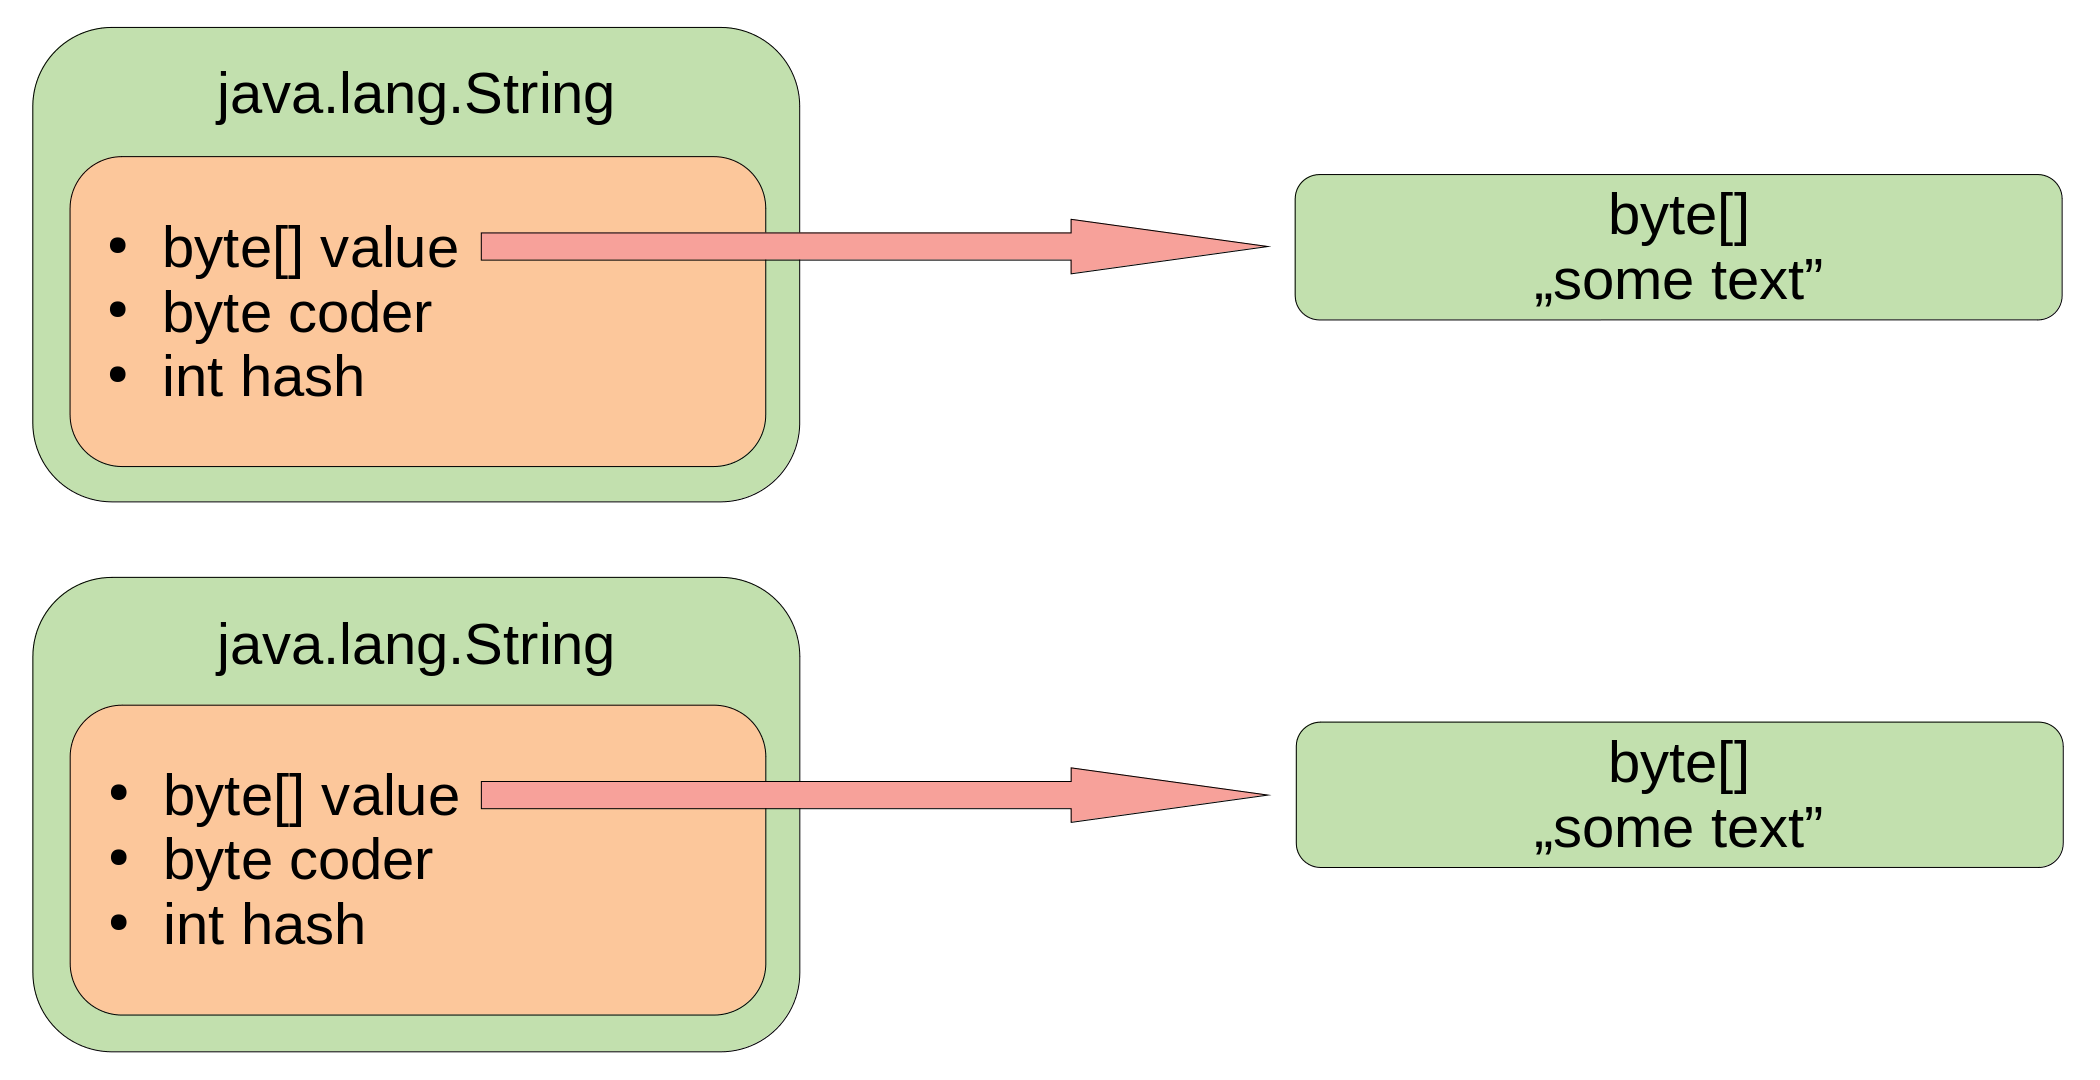
After string deduplication we have:
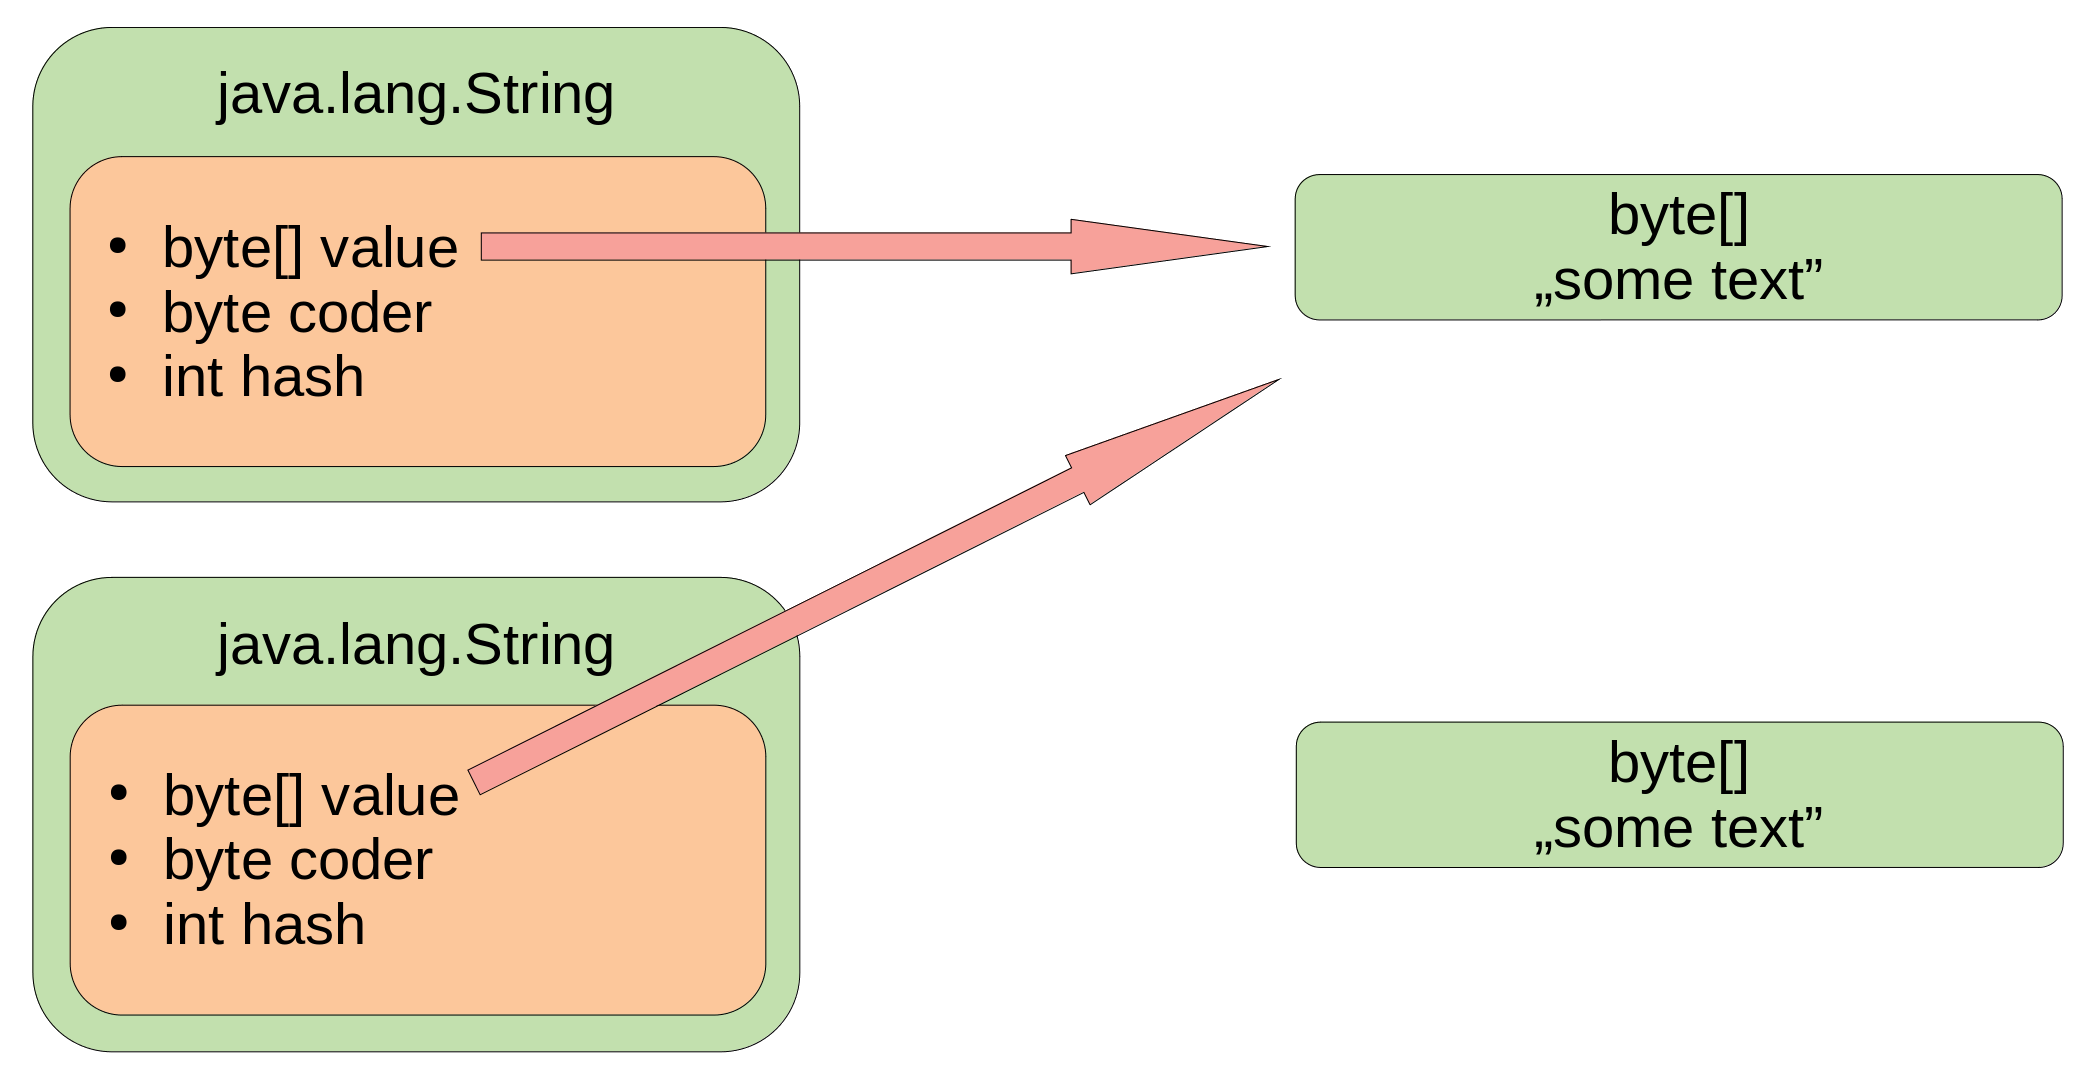
So one of byte[] can be reclaimed by the GC. Mind that if you are using JDK 8 then you have char[], not byte[].
You can find more information about this optimization and its consequences here.
How is it different then String.intern()?
String.intern() returns canonical representation of string from string pool. That means that if you have two strings with the same value then intern() will return the same string object for both strings.
String a = ".....";
String b = new String(a);

a != b
a.intern() == b.intern()
When string deduplication works for two different string objects then they are still different, but the array behind them is the same:
String a = "......";
String b = new String(a);
a != b
a.value != b.value

... string deduplication magic happens ....

a != b
a.value == b.value
What can we do?
- We can change G1NewSizePercent to higher value, so G1 cannot drop young collection to 5%
- We can disable string deduplication feature
- We can make higher MaxGCPauseMillis, so G1 has time to clean, not only to fix string deduplication
Unfortunately string deduplication logs were only on info level. From that log I cannot say if this optimization is helpful. My suggestion is to go with:
- -XX:G1NewSizePercent=35 -XX:-UseStringDeduplication if string deduplication is not needed
- -XX:G1NewSizePercent=35 -XX:MaxGCPauseMillis=400 if string deduplication is needed
Meanwhile …
While waiting for the development team to change JVM flags they delivered me the GC logs from the next outage. This time logs contained more information. If you want to find out what logs I enable in my JVMs check it on gclogs.com. This time logs contained also safepoints logs, so I could create simple pie chart that showed where JVM spent its time:
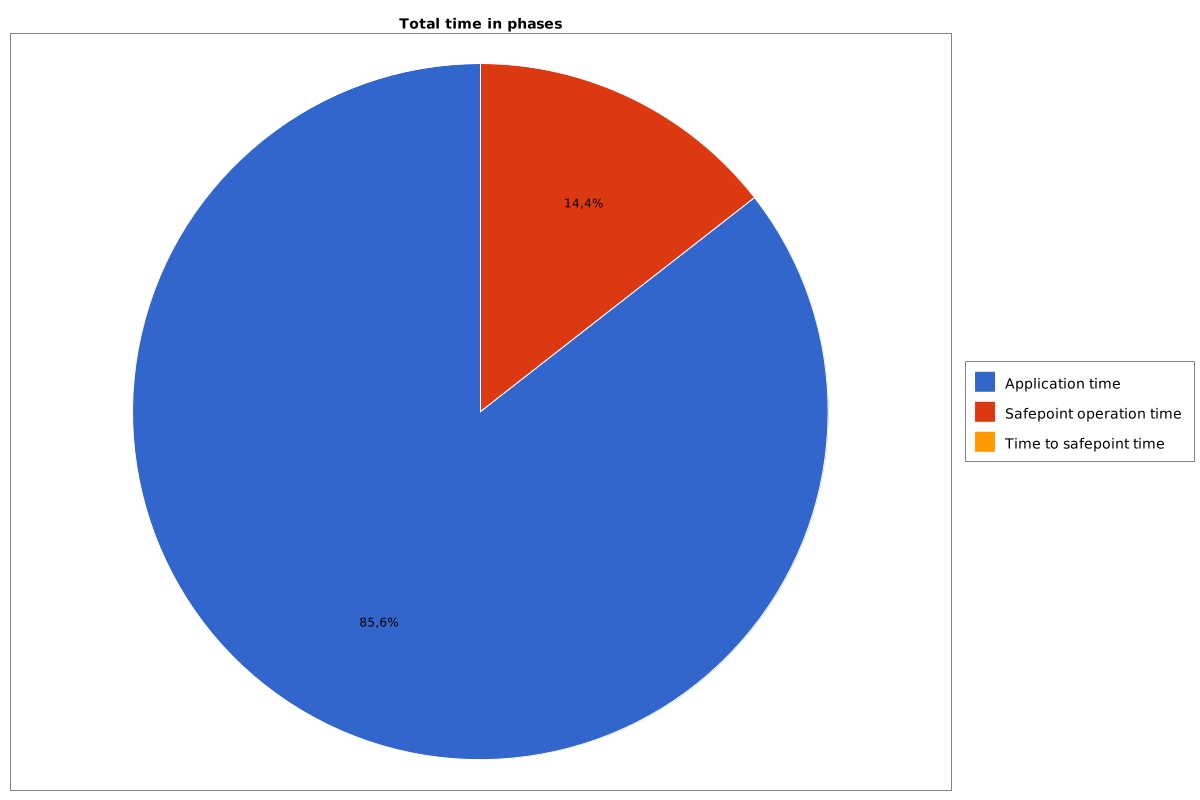
What that chart means is that 14,4% of time JVM spends in the STW phases. Let’s now look at another chart that shows us in which safepoint operation JVM hangs most of the time:
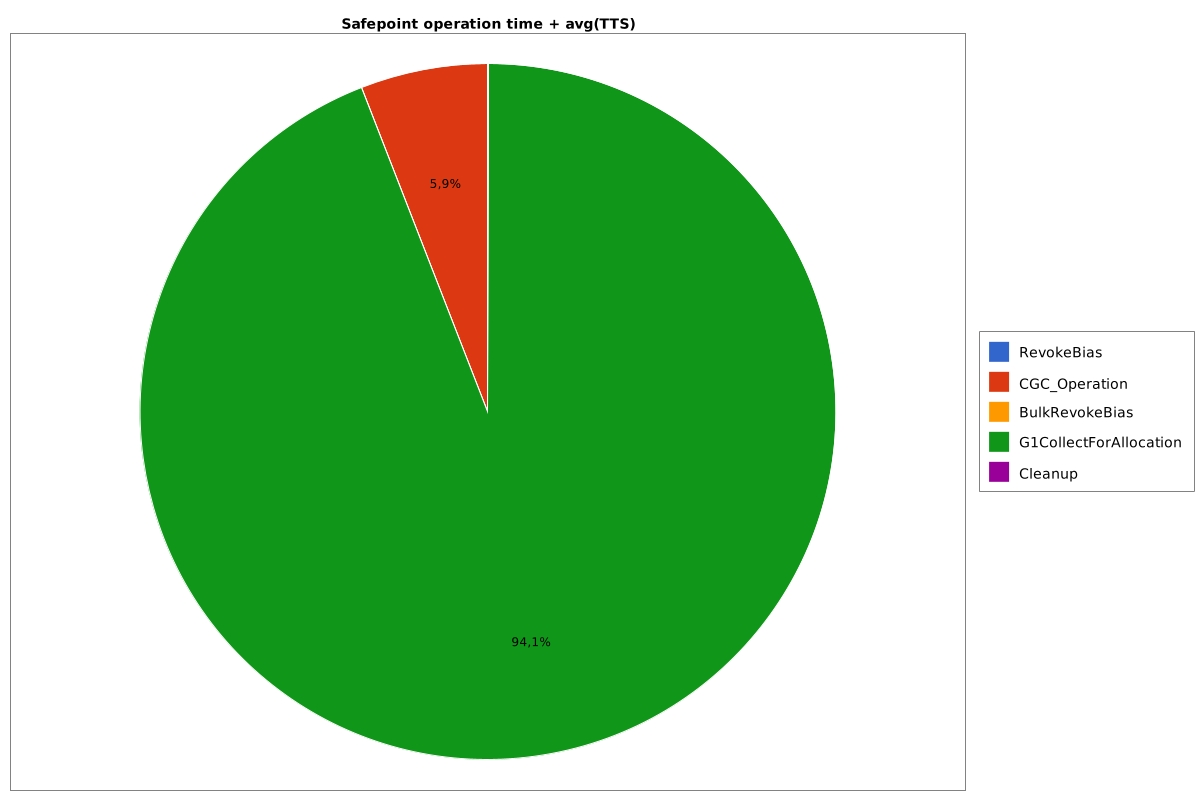
Both red and green parts of this chart are the GC STW phases. Other parts of that logs confirmed my opinion that G1 has no time to clean the young generation because it spends almost all the MaxGCPauseMillis time in string deduplication fixup. From the new logs I also noticed that:
- The Tenuring threshold is usually 1
- The young generation is usually ~600MB
That might be a reason why string deduplication has so much work to do. Since the young generation is very small and the tenuring threshold is just 1 there is a high chance that short-lived String objects are promoted to the old generation prematurely. From JEP 192 we can read:
The object is being evacuated to a young/survivor heap region and the object’s age is equal to the deduplication age threshold, or the object is being evacuated to an old heap region and the object’s age is less than the deduplication age threshold.
So if short-lived String objects are promoted prematurely then they are going to be deduplicated even if they are going to die soon. From the same JEP:
It is assumed that String objects either live for a very short time or live for a long time. Deduplicating objects that will die soon is just a waste of CPU and memory resources.
Fixing part 1
The development team decided to disable string deduplication first, without increasing the minimum size of young generation. Here are the results in charts, top chart is a chart before tuning, and bottom one is after:

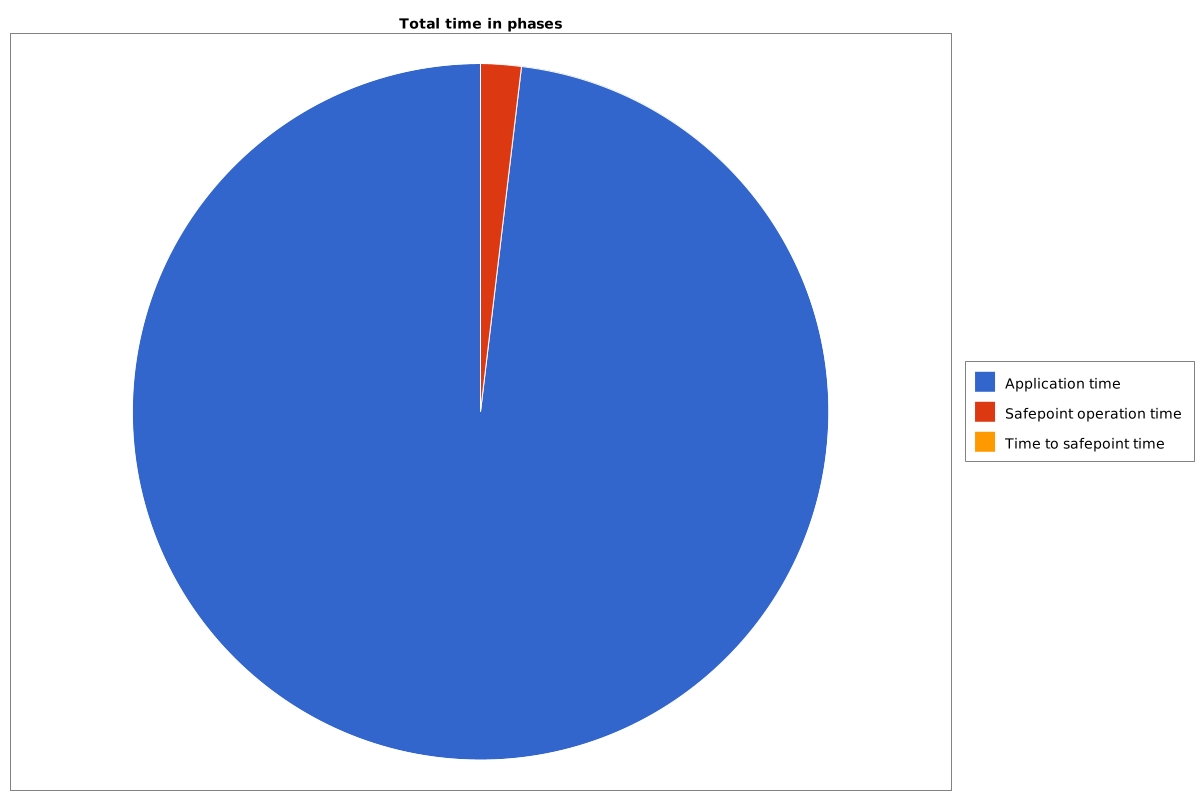
So time spent in the STW phases droped to ~2%. Good, but there was one Full GC, from my analysis it was done because of shortening the young generation, but this is a material for another article.
Fixing part 2
The development team decided additionally to extend the minimal young generation to 25%. Time spent in STW phases dropped even more:
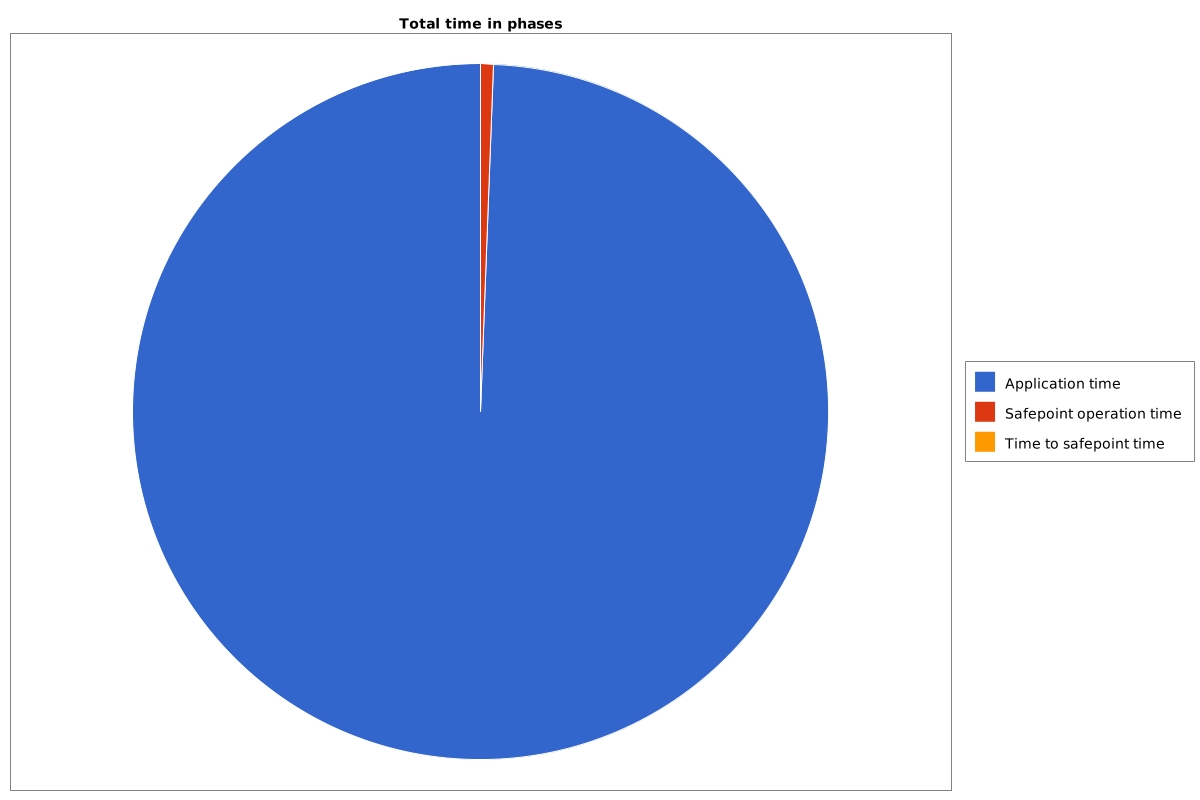
to ~0,5%. Here are other charts to compare, again top is before the tuning, bottom is after.
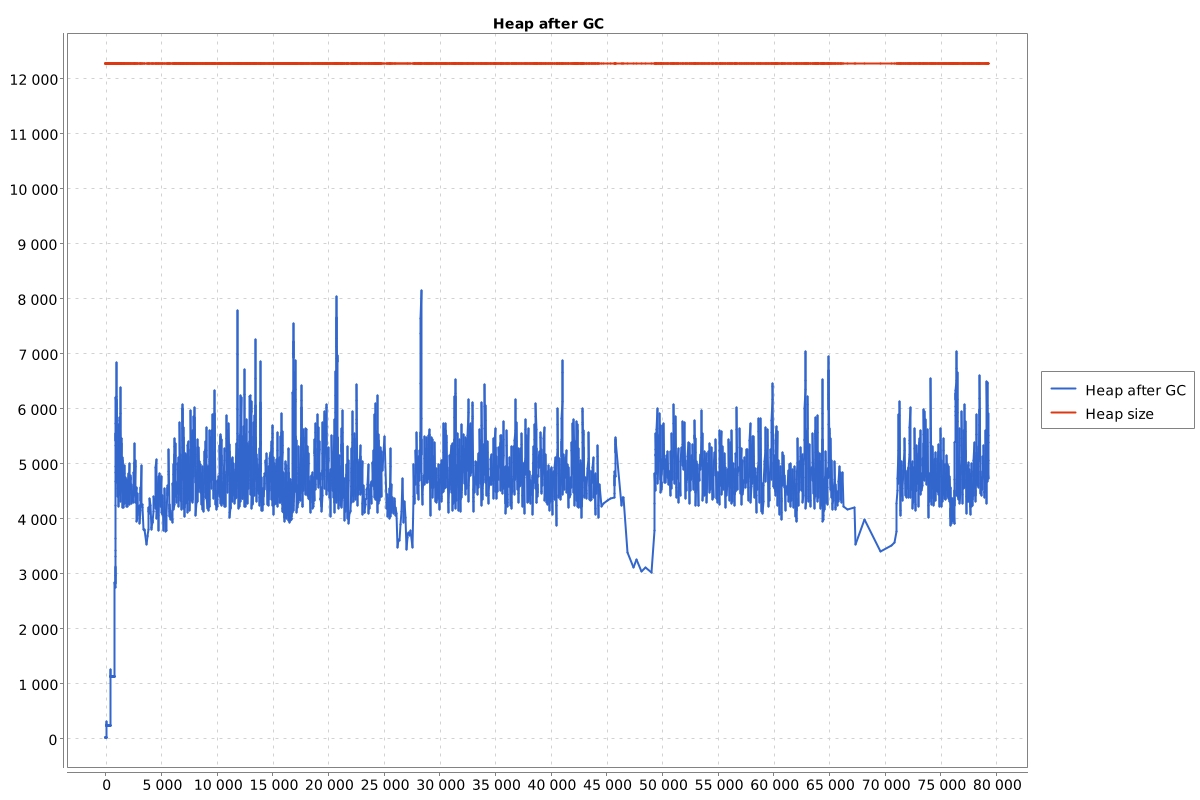
Heap after GC:

Heap before GC:

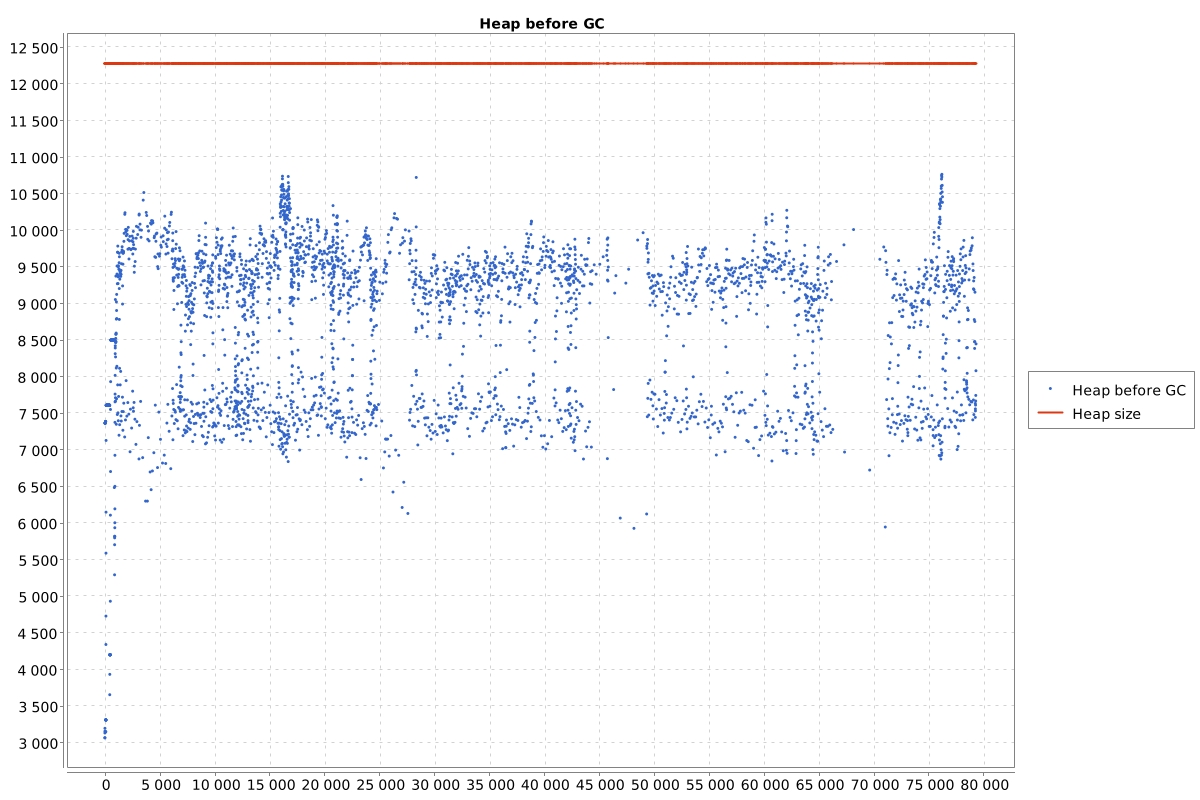
The last charts show that GC starts its work later, which is a good thing.
Why can JVM internals cause outage?
This application (and almost every one I saw in my life) has some health-check mechanism. When JVM is in the STW phase application cannot respond to health-check requests until the STW phase ends. This is why for systems probing for health-checks, the application can be found as dead if multiple requests are timed out.
Closure
I hope you see that I do G1 tuning only after I understand why it behaves not the way I expect. I saw multiple applications where JVM flags looked like if they were set randomly. Those applications were tuned using google/stackoverflow without the knowledge of JVM internals. If you want to tune your JVM, you should first understand why it behaves this way.