<?xml version="1.0" encoding="utf-8"?><feed xmlns="http://www.w3.org/2005/Atom" ><generator uri="https://jekyllrb.com/" version="3.10.0">Jekyll</generator><link href="https://krzysztofslusarski.github.io/feed.xml" rel="self" type="application/atom+xml" /><link href="https://krzysztofslusarski.github.io/" rel="alternate" type="text/html" /><updated>2026-07-27T16:20:07+00:00</updated><id>https://krzysztofslusarski.github.io/feed.xml</id><title type="html">JVM/Java profiling and tuning</title><subtitle>Just a homepage</subtitle><entry><title type="html">[Java][Profiling] Async-profiler + OpenTelemetry spans</title><link href="https://krzysztofslusarski.github.io/2026/07/27/spans.html" rel="alternate" type="text/html" title="[Java][Profiling] Async-profiler + OpenTelemetry spans" /><published>2026-07-27T01:51:30+00:00</published><updated>2026-07-27T01:51:30+00:00</updated><id>https://krzysztofslusarski.github.io/2026/07/27/spans</id><content type="html" xml:base="https://krzysztofslusarski.github.io/2026/07/27/spans.html"><![CDATA[<h1 id="javaprofiling-async-profiler--opentelemetry-spans">[Java][Profiling] Async-profiler + OpenTelemetry spans</h1>

<h2 id="spans-in-tracing">Spans in tracing</h2>

<p>The word <strong>span</strong> doesn’t come from the profiling world, it comes from the <strong>distributed tracing</strong> one.
Before we start playing with the async-profiler, let’s agree on what a span is there, since the profiler
borrows both the name and the idea. The most popular tracing standard nowadays is
<a href="https://opentelemetry.io/docs/concepts/signals/traces/" target="_blank">OpenTelemetry</a>, so let’s use it
as an example.</p>

<p>Imagine a very simple e-commerce system. A user clicks <em>“buy”</em> and the request travels through a few
services:</p>

<div class="language-plaintext highlighter-rouge"><div class="highlight"><pre class="highlight"><code>gateway ---&gt; order-service ---&gt; payment-service
                           ---&gt; warehouse-service ---&gt; database
</code></pre></div></div>

<p>From the user’s perspective this is <strong>one operation</strong> that either succeeded or not, and either was fast
or was slow. From the infrastructure perspective it is a handful of HTTP calls, a few database queries,
maybe a message on a queue, executed by different threads on different machines, each of them producing
its own logs. Tracing is a technique of gluing all of that back together into a single picture.</p>

<p>Two definitions:</p>

<ul>
  <li><strong>Span</strong> - a single unit of work, with a name, a start timestamp and a duration. It can be
<code class="language-plaintext highlighter-rouge">POST /orders</code>, <code class="language-plaintext highlighter-rouge">SELECT * FROM ORDERS</code>, or just a plain method call like <code class="language-plaintext highlighter-rouge">calculateDiscount</code>.</li>
  <li><strong>Trace</strong> - the whole tree of spans that belongs to one end-to-end operation.</li>
</ul>

<h3 id="span-context">Span context</h3>

<p>Every span carries a <strong>span context</strong>. The three fields that matter for us are:</p>

<ul>
  <li><code class="language-plaintext highlighter-rouge">traceId</code> - 16 bytes (32 hex characters), <strong>the same for every span in the trace</strong></li>
  <li><code class="language-plaintext highlighter-rouge">spanId</code> - 8 bytes (16 hex characters), unique for that particular span</li>
  <li>parent <code class="language-plaintext highlighter-rouge">spanId</code> - empty for the root span</li>
</ul>

<p>The last one is what makes a trace a tree, and not just a bag of spans. For our <em>“buy”</em> request it may
look like this:</p>

<div class="language-plaintext highlighter-rouge"><div class="highlight"><pre class="highlight"><code>traceId = 4bf92f3577b34da6a3ce929d0e0e4736

spanId=00f067aa0ba902b7  POST /orders                    [=================================] 850ms
spanId=a2fb4a1d1a96d312    HTTP POST /payments           [=======]                           190ms
spanId=b9c7c989f97918e1      INSERT INTO PAYMENTS        [==]                                 55ms
spanId=eee19b7ec3c1b174    HTTP POST /reservations       [==========================]        620ms
spanId=00b976fa8a4d2f1c      SELECT ... FROM WAREHOUSE   [=========================]         600ms
</code></pre></div></div>

<p>Every service reports its own spans, they are shipped to some collector, and the collector
groups them by <code class="language-plaintext highlighter-rouge">traceId</code> and rebuilds the tree using the parent <code class="language-plaintext highlighter-rouge">spanId</code>. This is exactly what you see
in Jaeger, Zipkin, Grafana Tempo or any commercial APM.</p>

<p>Besides the context, a span can also carry:</p>

<ul>
  <li><strong>attributes</strong> - key/value pairs, like <code class="language-plaintext highlighter-rouge">http.response.status_code=200</code> or <code class="language-plaintext highlighter-rouge">db.system=postgresql</code></li>
  <li><strong>events</strong> - timestamped messages inside the span, exceptions are usually reported that way</li>
  <li><strong>status</strong> - <code class="language-plaintext highlighter-rouge">UNSET</code>, <code class="language-plaintext highlighter-rouge">OK</code> or <code class="language-plaintext highlighter-rouge">ERROR</code></li>
  <li><strong>kind</strong> - <code class="language-plaintext highlighter-rouge">SERVER</code>, <code class="language-plaintext highlighter-rouge">CLIENT</code>, <code class="language-plaintext highlighter-rouge">INTERNAL</code>, <code class="language-plaintext highlighter-rouge">PRODUCER</code> or <code class="language-plaintext highlighter-rouge">CONSUMER</code></li>
</ul>

<h3 id="how-the-spans-are-created">How the spans are created</h3>

<p>In the OpenTelemetry Java API, you create a span manually like this:</p>

<div class="language-java highlighter-rouge"><div class="highlight"><pre class="highlight"><code><span class="nc">Tracer</span> <span class="n">tracer</span> <span class="o">=</span> <span class="n">openTelemetry</span><span class="o">.</span><span class="na">getTracer</span><span class="o">(</span><span class="s">"com.example.orders"</span><span class="o">);</span>

<span class="nc">Span</span> <span class="n">span</span> <span class="o">=</span> <span class="n">tracer</span><span class="o">.</span><span class="na">spanBuilder</span><span class="o">(</span><span class="s">"processOrder"</span><span class="o">)</span>
        <span class="o">.</span><span class="na">setAttribute</span><span class="o">(</span><span class="s">"order.id"</span><span class="o">,</span> <span class="n">orderId</span><span class="o">)</span>
        <span class="o">.</span><span class="na">startSpan</span><span class="o">();</span>

<span class="k">try</span> <span class="o">(</span><span class="nc">Scope</span> <span class="n">scope</span> <span class="o">=</span> <span class="n">span</span><span class="o">.</span><span class="na">makeCurrent</span><span class="o">())</span> <span class="o">{</span>
    <span class="n">processOrder</span><span class="o">(</span><span class="n">orderId</span><span class="o">);</span>
<span class="o">}</span> <span class="k">catch</span> <span class="o">(</span><span class="nc">Exception</span> <span class="n">e</span><span class="o">)</span> <span class="o">{</span>
    <span class="n">span</span><span class="o">.</span><span class="na">recordException</span><span class="o">(</span><span class="n">e</span><span class="o">);</span>
    <span class="n">span</span><span class="o">.</span><span class="na">setStatus</span><span class="o">(</span><span class="nc">StatusCode</span><span class="o">.</span><span class="na">ERROR</span><span class="o">);</span>
    <span class="k">throw</span> <span class="n">e</span><span class="o">;</span>
<span class="o">}</span> <span class="k">finally</span> <span class="o">{</span>
    <span class="n">span</span><span class="o">.</span><span class="na">end</span><span class="o">();</span>
<span class="o">}</span>
</code></pre></div></div>

<p>Three things are worth noticing here, because we will see the very same pattern in the async-profiler
later on:</p>

<ul>
  <li>the span is <strong>started</strong> and <strong>ended</strong> explicitly, the difference between those two timestamps is the
duration</li>
  <li><code class="language-plaintext highlighter-rouge">span.makeCurrent()</code> puts the span into a <code class="language-plaintext highlighter-rouge">ThreadLocal</code>, so that any code executed below can find out
<em>“in which span am I running right now?”</em> - this is what all the instrumentation libraries use</li>
  <li>the <code class="language-plaintext highlighter-rouge">Scope</code> has to be closed on the same thread that opened it</li>
</ul>

<p>In practice you rarely write that code yourself. The OpenTelemetry Java agent instruments the popular
frameworks and libraries for you, and in a Spring Boot 3 application you get <strong>Micrometer Tracing</strong>,
which can bridge to OpenTelemetry, out of the box.</p>

<h3 id="context-propagation">Context propagation</h3>

<p>The <code class="language-plaintext highlighter-rouge">traceId</code> alone would be useless if it stopped at the service boundary. When <code class="language-plaintext highlighter-rouge">order-service</code>
calls <code class="language-plaintext highlighter-rouge">payment-service</code>, the span context is serialized into an HTTP header - the
<a href="https://www.w3.org/TR/trace-context/" target="_blank">W3C Trace Context</a> standard calls it
<code class="language-plaintext highlighter-rouge">traceparent</code>:</p>

<div class="language-plaintext highlighter-rouge"><div class="highlight"><pre class="highlight"><code>traceparent: 00-4bf92f3577b34da6a3ce929d0e0e4736-00f067aa0ba902b7-01
             ^  ^                                ^                ^
             |  |                                |                flags (sampled)
             |  traceId                          parent spanId
             version
</code></pre></div></div>

<p>The receiving service reads that header, and every span it creates inherits the same <code class="language-plaintext highlighter-rouge">traceId</code>. That’s
the whole magic. The same mechanism works for messaging systems, where the context is put into the
message headers instead.</p>

<h3 id="what-tracing-gives-you-and-what-it-doesnt">What tracing gives you, and what it doesn’t</h3>

<p>Let’s go back to our waterfall. It tells us a lot:</p>

<ul>
  <li>the whole request took <code class="language-plaintext highlighter-rouge">850ms</code></li>
  <li><code class="language-plaintext highlighter-rouge">620ms</code> of that was spent in <code class="language-plaintext highlighter-rouge">warehouse-service</code></li>
  <li>and almost all of it, <code class="language-plaintext highlighter-rouge">600ms</code>, was a single database query</li>
</ul>

<p>That is a great starting point for an investigation, and very often it is enough. But now let’s change
the example a little bit:</p>

<div class="language-plaintext highlighter-rouge"><div class="highlight"><pre class="highlight"><code>traceId = 4bf92f3577b34da6a3ce929d0e0e4736

spanId=00f067aa0ba902b7  POST /orders                    [=================================] 850ms
spanId=a2fb4a1d1a96d312    HTTP POST /payments           [=======]                           190ms
spanId=eee19b7ec3c1b174    HTTP POST /reservations       [====]                              110ms
</code></pre></div></div>

<p>Where did the remaining <code class="language-plaintext highlighter-rouge">550ms</code> go? Somewhere in the <code class="language-plaintext highlighter-rouge">order-service</code> code, between the calls. Tracing
tells us <strong>that</strong> it happened, but it will never tell us <strong>why</strong>, because spans exist only where
somebody - you, or the instrumentation library - decided to put them. Adding more and more spans to
find out is not a great idea either: they are not free, they have to be created, stored and shipped, and
you would need to know upfront where to put them, which is precisely the thing you don’t know.</p>

<p>Filling that gap is a job for a profiler. A profiler doesn’t care about your instrumentation, it just
samples what the threads are doing. The problem is the opposite one: a profile gives you a beautiful
aggregation over <strong>all</strong> the requests, while the thing you are usually asked about is that one slow
request from the production incident.</p>

<p>This is where the async-profiler’s spans come in. As we will see in the next sections, an async-profiler
span is a much simpler structure than the OpenTelemetry one. There is no <code class="language-plaintext highlighter-rouge">spanId</code>, no parent, no
attributes, no events. It is just a <code class="language-plaintext highlighter-rouge">[start, end]</code> interval on one thread, plus a single string called
a <strong>tag</strong>:</p>

<div class="language-java highlighter-rouge"><div class="highlight"><pre class="highlight"><code><span class="kt">long</span> <span class="n">span</span> <span class="o">=</span> <span class="nc">Span</span><span class="o">.</span><span class="na">start</span><span class="o">();</span>
<span class="n">actualWork</span><span class="o">();</span>
<span class="nc">Span</span><span class="o">.</span><span class="na">end</span><span class="o">(</span><span class="n">span</span><span class="o">,</span> <span class="n">tag</span><span class="o">);</span>
</code></pre></div></div>

<p>And that’s on purpose. The profiler doesn’t need to draw a waterfall, it needs just enough information
to answer one question: <strong>which samples were gathered by this thread while that span was open?</strong></p>

<p>The tag is an arbitrary label, and it is entirely up to you what you put there. It can be an endpoint
name like <code class="language-plaintext highlighter-rouge">POST /orders</code>, a message type, a tenant, a query ID. But it can also be the <code class="language-plaintext highlighter-rouge">traceId</code> we’ve
just been talking about - and then the profiler and your tracing system start speaking the same
language. Filtering the profile by a single <code class="language-plaintext highlighter-rouge">traceId</code> gives us a flame graph of one distributed request,
with all its threads and all its services, which is exactly the <em>“why”</em> that the waterfall above was
missing.</p>

<h2 id="feeding-the-profiler-from-your-tracing">Feeding the profiler from your tracing</h2>

<p>The idea of joining the two worlds is trivial:</p>

<blockquote>
  <p>Whenever a telemetry span becomes active, start a profiler span.
Whenever it stops being active, end it, tagged with the tracing IDs.</p>
</blockquote>

<p>No new instrumentation, no new decisions about <em>“where to put the spans”</em> - somebody has already made
all of them for you, and did it in the places that matter. You are just piggybacking on that work.</p>

<p>The whole trick is in the words <strong>becomes active</strong>, so let’s look at them before writing any code.</p>

<h3 id="the-trap-a-spans-lifetime-is-not-a-threads-work">The trap: a span’s lifetime is not a thread’s work</h3>

<p>The naive implementation hooks the span lifecycle - start the profiler span when the telemetry span
starts, end it when the telemetry span ends. It works in a simple synchronous application, and it breaks
everywhere else, for one reason: <strong>a telemetry span is not bound to a thread, and a profiler span is</strong>.</p>

<p><code class="language-plaintext highlighter-rouge">Span.start()</code> and <code class="language-plaintext highlighter-rouge">Span.end()</code> record the interval on whatever thread calls them. But an OpenTelemetry
span:</p>

<ul>
  <li>can be started on one thread and ended on another - any asynchronous or reactive code does that</li>
  <li>can be open for <code class="language-plaintext highlighter-rouge">850ms</code> while the thread that created it went off to serve three other requests in
the meantime</li>
  <li>can be active on several threads at once, if the work was forked out</li>
</ul>

<p>Hook the lifecycle and you get spans that begin on one thread and end on another (garbage), or spans
that cover <code class="language-plaintext highlighter-rouge">850ms</code> of a thread’s time when only <code class="language-plaintext highlighter-rouge">50ms</code> of it was actually spent on that request
(worse - it looks plausible).</p>

<p>Fortunately OpenTelemetry already has a concept that means exactly <em>“this thread is working under this
span right now”</em>, and it is the <strong><code class="language-plaintext highlighter-rouge">Scope</code></strong>:</p>

<div class="language-java highlighter-rouge"><div class="highlight"><pre class="highlight"><code><span class="k">try</span> <span class="o">(</span><span class="nc">Scope</span> <span class="n">scope</span> <span class="o">=</span> <span class="n">span</span><span class="o">.</span><span class="na">makeCurrent</span><span class="o">())</span> <span class="o">{</span>
    <span class="c1">// this thread, and only this thread, is now working on `span`</span>
<span class="o">}</span>
</code></pre></div></div>

<p>The <code class="language-plaintext highlighter-rouge">Scope</code> is thread-bound by contract - it must be closed on the thread that opened it - which is
precisely the contract <code class="language-plaintext highlighter-rouge">Span.start()</code>/<code class="language-plaintext highlighter-rouge">Span.end()</code> needs. So the rule is:</p>

<blockquote>
  <p>Don’t hook the span. Hook the <strong>scope</strong>.</p>
</blockquote>

<p>And notice that this gives us the right behaviour for free: if one telemetry span is made current five
times, on three threads, we get five profiler spans carrying the same tag. That is not a bug, that is
the honest answer to <em>“which stretches of thread time were spent on this request”</em>.</p>

<h3 id="plain-opentelemetry">Plain OpenTelemetry</h3>

<p>Every <code class="language-plaintext highlighter-rouge">makeCurrent()</code> goes through <code class="language-plaintext highlighter-rouge">ContextStorage</code>, and OpenTelemetry lets us wrap it. That is a single
place through which every context activation in the whole application has to pass:</p>

<div class="language-java highlighter-rouge"><div class="highlight"><pre class="highlight"><code><span class="kn">import</span> <span class="nn">io.opentelemetry.api.trace.Span</span><span class="o">;</span>
<span class="kn">import</span> <span class="nn">io.opentelemetry.api.trace.SpanContext</span><span class="o">;</span>
<span class="kn">import</span> <span class="nn">io.opentelemetry.context.Context</span><span class="o">;</span>
<span class="kn">import</span> <span class="nn">io.opentelemetry.context.ContextStorage</span><span class="o">;</span>
<span class="kn">import</span> <span class="nn">io.opentelemetry.context.Scope</span><span class="o">;</span>

<span class="kd">public</span> <span class="kd">final</span> <span class="kd">class</span> <span class="nc">ProfilerContextStorage</span> <span class="kd">implements</span> <span class="nc">ContextStorage</span> <span class="o">{</span>
    <span class="kd">private</span> <span class="kd">final</span> <span class="nc">ContextStorage</span> <span class="n">delegate</span><span class="o">;</span>

    <span class="kd">private</span> <span class="nf">ProfilerContextStorage</span><span class="o">(</span><span class="nc">ContextStorage</span> <span class="n">delegate</span><span class="o">)</span> <span class="o">{</span>
        <span class="k">this</span><span class="o">.</span><span class="na">delegate</span> <span class="o">=</span> <span class="n">delegate</span><span class="o">;</span>
    <span class="o">}</span>

    <span class="kd">public</span> <span class="kd">static</span> <span class="kt">void</span> <span class="nf">install</span><span class="o">()</span> <span class="o">{</span>
        <span class="nc">ContextStorage</span><span class="o">.</span><span class="na">addWrapper</span><span class="o">(</span><span class="nl">ProfilerContextStorage:</span><span class="o">:</span><span class="k">new</span><span class="o">);</span>
    <span class="o">}</span>

    <span class="nd">@Override</span>
    <span class="kd">public</span> <span class="nc">Scope</span> <span class="nf">attach</span><span class="o">(</span><span class="nc">Context</span> <span class="n">toAttach</span><span class="o">)</span> <span class="o">{</span>
        <span class="nc">Scope</span> <span class="n">scope</span> <span class="o">=</span> <span class="n">delegate</span><span class="o">.</span><span class="na">attach</span><span class="o">(</span><span class="n">toAttach</span><span class="o">);</span>

        <span class="nc">SpanContext</span> <span class="n">spanContext</span> <span class="o">=</span> <span class="nc">Span</span><span class="o">.</span><span class="na">fromContext</span><span class="o">(</span><span class="n">toAttach</span><span class="o">).</span><span class="na">getSpanContext</span><span class="o">();</span>
        <span class="k">if</span> <span class="o">(!</span><span class="n">spanContext</span><span class="o">.</span><span class="na">isValid</span><span class="o">())</span> <span class="o">{</span>
            <span class="k">return</span> <span class="n">scope</span><span class="o">;</span>
        <span class="o">}</span>

        <span class="nc">String</span> <span class="n">tag</span> <span class="o">=</span> <span class="n">spanContext</span><span class="o">.</span><span class="na">getTraceId</span><span class="o">()</span> <span class="o">+</span> <span class="sc">'/'</span> <span class="o">+</span> <span class="n">spanContext</span><span class="o">.</span><span class="na">getSpanId</span><span class="o">();</span>
        <span class="kt">long</span> <span class="n">profilerSpan</span> <span class="o">=</span> <span class="n">one</span><span class="o">.</span><span class="na">profiler</span><span class="o">.</span><span class="na">Span</span><span class="o">.</span><span class="na">start</span><span class="o">();</span>

        <span class="k">return</span> <span class="o">()</span> <span class="o">-&gt;</span> <span class="o">{</span>
            <span class="n">one</span><span class="o">.</span><span class="na">profiler</span><span class="o">.</span><span class="na">Span</span><span class="o">.</span><span class="na">endIfProfiled</span><span class="o">(</span><span class="n">profilerSpan</span><span class="o">,</span> <span class="n">tag</span><span class="o">);</span>
            <span class="n">scope</span><span class="o">.</span><span class="na">close</span><span class="o">();</span>
        <span class="o">};</span>
    <span class="o">}</span>

    <span class="nd">@Override</span>
    <span class="kd">public</span> <span class="nc">Context</span> <span class="nf">current</span><span class="o">()</span> <span class="o">{</span>
        <span class="k">return</span> <span class="n">delegate</span><span class="o">.</span><span class="na">current</span><span class="o">();</span>
    <span class="o">}</span>
<span class="o">}</span>
</code></pre></div></div>

<p>A few notes:</p>

<ul>
  <li>yes, there are two classes called <code class="language-plaintext highlighter-rouge">Span</code> here, <code class="language-plaintext highlighter-rouge">io.opentelemetry.api.trace.Span</code> and
<code class="language-plaintext highlighter-rouge">one.profiler.Span</code>. Sorry about that, one of them has to be fully qualified.</li>
  <li><code class="language-plaintext highlighter-rouge">ContextStorage.addWrapper</code> has to be called <strong>before the first <code class="language-plaintext highlighter-rouge">makeCurrent()</code></strong> in the application.
The javadoc suggests a static initializer in your main class, and it means it.</li>
  <li>the profiler span is ended <strong>before</strong> the delegate scope is closed, so that the interval we record is
a subset of the interval the context was actually active.</li>
  <li><code class="language-plaintext highlighter-rouge">spanContext.isValid()</code> skips contexts that carry no span at all - there is nothing to tag them with.</li>
</ul>

<h3 id="spring-boot-and-micrometer">Spring Boot and Micrometer</h3>

<p>In a Spring Boot 3 application you usually don’t touch OpenTelemetry directly, you go through
<strong>Micrometer Tracing</strong>. Its <code class="language-plaintext highlighter-rouge">ObservationHandler</code> has scope callbacks, so we can use the same approach:</p>

<div class="language-java highlighter-rouge"><div class="highlight"><pre class="highlight"><code><span class="kd">public</span> <span class="kd">class</span> <span class="nc">ProfilerObservationHandler</span> <span class="kd">implements</span> <span class="nc">ObservationHandler</span><span class="o">&lt;</span><span class="nc">Observation</span><span class="o">.</span><span class="na">Context</span><span class="o">&gt;</span> <span class="o">{</span>
    <span class="kd">private</span> <span class="kd">static</span> <span class="kd">final</span> <span class="nc">ThreadLocal</span><span class="o">&lt;</span><span class="nc">Deque</span><span class="o">&lt;</span><span class="nc">Long</span><span class="o">&gt;&gt;</span> <span class="no">STARTS</span> <span class="o">=</span> <span class="nc">ThreadLocal</span><span class="o">.</span><span class="na">withInitial</span><span class="o">(</span><span class="nl">ArrayDeque:</span><span class="o">:</span><span class="k">new</span><span class="o">);</span>

    <span class="nd">@Override</span>
    <span class="kd">public</span> <span class="kt">boolean</span> <span class="nf">supportsContext</span><span class="o">(</span><span class="nc">Observation</span><span class="o">.</span><span class="na">Context</span> <span class="n">context</span><span class="o">)</span> <span class="o">{</span>
        <span class="k">return</span> <span class="kc">true</span><span class="o">;</span>
    <span class="o">}</span>

    <span class="nd">@Override</span>
    <span class="kd">public</span> <span class="kt">void</span> <span class="nf">onScopeOpened</span><span class="o">(</span><span class="nc">Observation</span><span class="o">.</span><span class="na">Context</span> <span class="n">context</span><span class="o">)</span> <span class="o">{</span>
        <span class="no">STARTS</span><span class="o">.</span><span class="na">get</span><span class="o">().</span><span class="na">push</span><span class="o">(</span><span class="nc">Span</span><span class="o">.</span><span class="na">start</span><span class="o">());</span>
    <span class="o">}</span>

    <span class="nd">@Override</span>
    <span class="kd">public</span> <span class="kt">void</span> <span class="nf">onScopeClosed</span><span class="o">(</span><span class="nc">Observation</span><span class="o">.</span><span class="na">Context</span> <span class="n">context</span><span class="o">)</span> <span class="o">{</span>
        <span class="nc">Long</span> <span class="n">start</span> <span class="o">=</span> <span class="no">STARTS</span><span class="o">.</span><span class="na">get</span><span class="o">().</span><span class="na">poll</span><span class="o">();</span>
        <span class="k">if</span> <span class="o">(</span><span class="n">start</span> <span class="o">!=</span> <span class="kc">null</span><span class="o">)</span> <span class="o">{</span>
            <span class="nc">Span</span><span class="o">.</span><span class="na">endIfProfiled</span><span class="o">(</span><span class="n">start</span><span class="o">,</span> <span class="n">tag</span><span class="o">(</span><span class="n">context</span><span class="o">));</span>
        <span class="o">}</span>
    <span class="o">}</span>

    <span class="kd">private</span> <span class="kd">static</span> <span class="nc">String</span> <span class="nf">tag</span><span class="o">(</span><span class="nc">Observation</span><span class="o">.</span><span class="na">Context</span> <span class="n">context</span><span class="o">)</span> <span class="o">{</span>
        <span class="nc">TracingContext</span> <span class="n">tracingContext</span> <span class="o">=</span> <span class="n">context</span><span class="o">.</span><span class="na">get</span><span class="o">(</span><span class="nc">TracingContext</span><span class="o">.</span><span class="na">class</span><span class="o">);</span>
        <span class="k">if</span> <span class="o">(</span><span class="n">tracingContext</span> <span class="o">==</span> <span class="kc">null</span> <span class="o">||</span> <span class="n">tracingContext</span><span class="o">.</span><span class="na">getSpan</span><span class="o">()</span> <span class="o">==</span> <span class="kc">null</span><span class="o">)</span> <span class="o">{</span>
            <span class="k">return</span> <span class="n">context</span><span class="o">.</span><span class="na">getContextualName</span><span class="o">();</span>
        <span class="o">}</span>
        <span class="nc">TraceContext</span> <span class="n">traceContext</span> <span class="o">=</span> <span class="n">tracingContext</span><span class="o">.</span><span class="na">getSpan</span><span class="o">().</span><span class="na">context</span><span class="o">();</span>
        <span class="k">return</span> <span class="n">traceContext</span><span class="o">.</span><span class="na">traceId</span><span class="o">()</span> <span class="o">+</span> <span class="sc">'/'</span> <span class="o">+</span> <span class="n">traceContext</span><span class="o">.</span><span class="na">spanId</span><span class="o">()</span> <span class="o">+</span> <span class="sc">'/'</span> <span class="o">+</span> <span class="n">context</span><span class="o">.</span><span class="na">getContextualName</span><span class="o">();</span>
    <span class="o">}</span>
<span class="o">}</span>
</code></pre></div></div>

<p>Scopes on a single thread nest strictly, last opened is first closed, which is why a <code class="language-plaintext highlighter-rouge">Deque</code> is enough
here - no need to match the start timestamp with any particular observation.</p>

<p>Registering it is the same as any other handler:</p>

<div class="language-java highlighter-rouge"><div class="highlight"><pre class="highlight"><code><span class="nd">@Bean</span>
<span class="nc">ObservedAspect</span> <span class="nf">observedAspect</span><span class="o">(</span><span class="nc">ObservationRegistry</span> <span class="n">observationRegistry</span><span class="o">)</span> <span class="o">{</span>
    <span class="n">observationRegistry</span><span class="o">.</span><span class="na">observationConfig</span><span class="o">().</span><span class="na">observationHandler</span><span class="o">(</span><span class="k">new</span> <span class="nc">ProfilerObservationHandler</span><span class="o">());</span>
    <span class="k">return</span> <span class="k">new</span> <span class="nf">ObservedAspect</span><span class="o">(</span><span class="n">observationRegistry</span><span class="o">);</span>
<span class="o">}</span>
</code></pre></div></div>

<h3 id="what-to-put-in-the-tag">What to put in the tag</h3>

<p>Now the interesting part. <code class="language-plaintext highlighter-rouge">traceId + "/" + spanId</code> is a good default, and here is why it works so well:</p>

<ul>
  <li>both IDs are <strong>fixed width</strong> - <code class="language-plaintext highlighter-rouge">traceId</code> is 32 lowercase hex characters, <code class="language-plaintext highlighter-rouge">spanId</code> is 16 - and hex
never contains a <code class="language-plaintext highlighter-rouge">/</code>, so the tag is unambiguous to split and to match</li>
  <li>the <strong>coarse key comes first</strong>, so a <em>“starts with”</em> filter on <code class="language-plaintext highlighter-rouge">4bf92f35.../</code> gives you the whole
distributed request, across every thread and every service, while a full equality match narrows it
down to one single tracing span</li>
  <li>it is a <strong>join key back to your tracing backend</strong>. You find a slow span in Jaeger or Tempo, you copy
its ID, you paste it into the profiler viewer’s filter. That’s the whole workflow, and it is worth
a lot when somebody is standing behind you asking why yesterday’s order took 4 seconds.</li>
</ul>

<p>The one thing I would add on top is the <strong>operation name</strong>, as a suffix - <code class="language-plaintext highlighter-rouge">traceId/spanId/name</code>. Opaque
hex is fine when you arrive from Jaeger with an ID in your clipboard, but it is unreadable when you are
just browsing the <em>Span stats</em> of a JFR file and trying to work out which of these took 4 seconds.
Putting the name last keeps both prefix filters (by trace, and by trace + span) working exactly as
before.</p>

<p>Whether you can do it depends on which side you hooked:</p>

<ul>
  <li><strong>Micrometer</strong> hands you the name for free - <code class="language-plaintext highlighter-rouge">Observation.Context</code> has <code class="language-plaintext highlighter-rouge">getName()</code> and
<code class="language-plaintext highlighter-rouge">getContextualName()</code>, which is why the handler above uses it.</li>
  <li><strong>Plain OpenTelemetry does not.</strong> <code class="language-plaintext highlighter-rouge">io.opentelemetry.api.trace.Span</code> has <code class="language-plaintext highlighter-rouge">updateName()</code>, but there is
no <code class="language-plaintext highlighter-rouge">getName()</code> - reading the name back means casting to the SDK’s <code class="language-plaintext highlighter-rouge">ReadableSpan</code>, and coupling your
instrumentation to the SDK internals. Not worth it. Stay with <code class="language-plaintext highlighter-rouge">traceId/spanId</code> there and let the
tracing backend resolve names for you.</li>
</ul>

<p>One trade-off worth knowing: if what you mostly do is aggregate profiling - <em>“show me the flame graph
of everything that ran under <code class="language-plaintext highlighter-rouge">POST /orders</code> this week”</em> - then the name is the useful prefix and the IDs
are the noise, and you may prefer <code class="language-plaintext highlighter-rouge">name/traceId/spanId</code> instead. You can’t have both prefixes at once;
pick the one that matches how you actually search. My experience is that people reach for spans when
investigating a <strong>single</strong> bad request, so I keep the IDs in front.</p>

<h3 id="your-application-is-not-my-application">Your application is not my application</h3>

<p>Everything I’ve written above is a <strong>default, not a rule</strong>. The tag is a free-form string, the profiler
doesn’t parse it, and nothing in async-profiler knows or cares that OpenTelemetry exists. I picked
<code class="language-plaintext highlighter-rouge">traceId/spanId</code> because this chapter is about joining the profiler with tracing, but that is my
use case, and yours may be a completely different one.</p>

<p>The question you should be asking is not <em>“what does the standard say”</em>, it is:</p>

<blockquote>
  <p>When somebody wakes me up at 3 a.m. with a production problem, what will I want to filter the profile
by?</p>
</blockquote>

<p>The answer to that is domain knowledge, and you have it - I don’t.</p>

<p>The best example is a <strong>multitenant system</strong>. Sooner or later you get a ticket saying <em>“customer
<code class="language-plaintext highlighter-rouge">ACME</code> reports the system is slow”</em>, while every dashboard you own looks perfectly fine, because
<code class="language-plaintext highlighter-rouge">ACME</code> is 2% of your traffic and the averages have swallowed them whole. If the customer ID is part of
your tag, that investigation is one filter away - you get a flame graph of everything your application
did for that one customer, and very often the answer is immediately visible: they are the only client
with 40 thousand records in a collection that somebody loops over, or the only one with a feature flag
that turns on an expensive code path.</p>

<p>Adding it is trivial. If you propagate the tenant in OpenTelemetry <strong>baggage</strong>, it is already sitting in
the context you are wrapping:</p>

<div class="language-java highlighter-rouge"><div class="highlight"><pre class="highlight"><code><span class="nc">String</span> <span class="n">tenant</span> <span class="o">=</span> <span class="nc">Baggage</span><span class="o">.</span><span class="na">fromContext</span><span class="o">(</span><span class="n">toAttach</span><span class="o">).</span><span class="na">getEntryValue</span><span class="o">(</span><span class="s">"tenant.id"</span><span class="o">);</span>
<span class="nc">String</span> <span class="n">tag</span> <span class="o">=</span> <span class="n">tenant</span> <span class="o">+</span> <span class="sc">'/'</span> <span class="o">+</span> <span class="n">spanContext</span><span class="o">.</span><span class="na">getTraceId</span><span class="o">()</span> <span class="o">+</span> <span class="sc">'/'</span> <span class="o">+</span> <span class="n">spanContext</span><span class="o">.</span><span class="na">getSpanId</span><span class="o">();</span>
</code></pre></div></div>

<p>and if you keep it in your own <code class="language-plaintext highlighter-rouge">ThreadLocal</code>, in an MDC, or in a security context, use that instead -
it makes no difference to the profiler.</p>

<p>Other things I have seen work well, depending on what the application actually does:</p>

<ul>
  <li><strong>batch and ETL jobs</strong> - the job name plus the chunk or partition number. <em>“Which partition is the
slow one, and why”</em> is the whole investigation.</li>
  <li><strong>message-driven systems</strong> - the message or event type, sometimes the topic and consumer group. A
single poison message type can dominate a consumer without showing up anywhere else.</li>
  <li><strong>reporting</strong> - the report type and its parameters. Reports are the classic case where one rarely used
variant is three orders of magnitude more expensive than the rest.</li>
  <li><strong>rollouts and feature flags</strong> - the variant name. Then you can put two flame graphs side by side and
see what the new version actually costs, on production traffic, in the same JFR file.</li>
  <li><strong>cache hit/miss, hot/cold paths</strong> - a crude one, but a profile split by cache miss is sometimes all
the evidence you need.</li>
</ul>

<p>And of course you can combine them - <code class="language-plaintext highlighter-rouge">tenant/traceId/spanId</code> is a perfectly reasonable tag. Just
remember the ordering rule from the previous section: <strong>whatever you put first is what you can
prefix-filter by</strong>, so put the dimension you group by in front, and the unique identifier behind it.</p>

<p>Two warnings before you go wild with this:</p>

<ul>
  <li><strong>Mind the cardinality.</strong> Every distinct tag is a separate string in the JFR file. A <code class="language-plaintext highlighter-rouge">traceId</code> is
unbounded too, but it earns its place - it is a join key you will actually use. Something like a full
SQL statement with literals inlined, or a user agent, gives you thousands of unique strings that you
will never once filter by exactly. Put the low-cardinality thing in the tag, and let the flame graph
tell you the rest.</li>
  <li><strong>Mind what you are writing to disk.</strong> A JFR file gets copied to a laptop, attached to a ticket,
sometimes sent to a vendor. A customer <strong>ID</strong> is usually fine, a customer <strong>name</strong>, e-mail or a
document number is exactly the sort of thing that shouldn’t leave production in a profiling artifact.
Tag with the surrogate key, resolve it to a human-readable name later, in a system that has the right
to show it to you.</li>
</ul>

<h3 id="nesting-and-why-endifprofiled-matters">Nesting, and why <code class="language-plaintext highlighter-rouge">endIfProfiled</code> matters</h3>

<p>Telemetry spans nest, so profiler spans will nest too. A sample taken deep inside <code class="language-plaintext highlighter-rouge">payment-service</code> ends
up covered by the HTTP server span, the service span and the JDBC span all at once.</p>

<p>That is a feature. Filtering by the outer tag gives you that whole subtree, filtering by an inner tag
narrows you down to just that part of the work - the same drill-down you have in the tracing UI, only
now every level has a flame graph attached to it.</p>

<p>It does have a cost though. Every span is a JFR event, and every tag is a distinct string in the JFR
constant pool - and with <code class="language-plaintext highlighter-rouge">traceId/spanId</code> <strong>every single tag is unique</strong>, so nothing deduplicates. An
application with fine-grained instrumentation inside a loop can produce a lot of them.</p>

<p>This is exactly what <code class="language-plaintext highlighter-rouge">endIfProfiled</code> is for:</p>

<div class="language-java highlighter-rouge"><div class="highlight"><pre class="highlight"><code><span class="nc">Span</span><span class="o">.</span><span class="na">endIfProfiled</span><span class="o">(</span><span class="n">profilerSpan</span><span class="o">,</span> <span class="n">tag</span><span class="o">);</span>
</code></pre></div></div>

<p>It records the span <strong>only if at least one profiling sample was actually taken on this thread while the
span was open</strong>, and it decides that without entering native code at all. A span that encloses no sample
contributes nothing to the profile - there is nothing to filter with it - so dropping it costs you no
information whatsoever. With wall-clock sampling at the default interval, that quietly removes the
overwhelming majority of the short nested spans, and leaves you the ones that actually have a flame
graph behind them.</p>

<p>Use plain <code class="language-plaintext highlighter-rouge">end()</code> only when you genuinely want a complete list of spans, for example when you are also
using the JFR file for latency statistics rather than just for filtering samples.</p>

<h3 id="a-note-on-tracing-sampling">A note on tracing sampling</h3>

<p>Your tracing backend almost certainly does not store 100% of the traces - head-based sampling at 1% or
5% is the norm. Mind that an unsampled trace still gets a perfectly valid <code class="language-plaintext highlighter-rouge">traceId</code>, still propagates it
downstream, and will still end up in your profiler spans - it just never reaches Jaeger, so the tag will
point at a trace you cannot look up.</p>

<p>You can gate on it if that bothers you:</p>

<div class="language-java highlighter-rouge"><div class="highlight"><pre class="highlight"><code><span class="k">if</span> <span class="o">(!</span><span class="n">spanContext</span><span class="o">.</span><span class="na">isSampled</span><span class="o">())</span> <span class="o">{</span>
    <span class="k">return</span> <span class="n">scope</span><span class="o">;</span>
<span class="o">}</span>
</code></pre></div></div>

<p>I would rather not. Profiler spans are far cheaper than exported traces, and the profile stands on its
own - a tag is still a perfectly good grouping key even if nobody can resolve it to a waterfall. Being
able to profile 100% of the requests while tracing 1% of them is a feature, not a problem.</p>

<h3 id="the-demo-application">The demo application</h3>

<p>Every snippet above is taken from a working application, which you can find here:</p>

<p><a href="https://github.com/krzysztofslusarski/async-profiler-spans-demo" target="_blank">https://github.com/krzysztofslusarski/async-profiler-spans-demo</a></p>

<p>It is a Maven project with two independent examples - one on the plain OpenTelemetry SDK with the
<code class="language-plaintext highlighter-rouge">ContextStorage</code> wrapper, one on Spring Boot with the <code class="language-plaintext highlighter-rouge">ObservationHandler</code> - plus a fake workload that
does exactly what the waterfalls in this article show.</p>

<p>You don’t need any infrastructure to run it. There is no Jaeger, no Tempo, no collector:</p>

<ul>
  <li>finished traces are printed to the console as an ASCII waterfall, the same one you have been reading
here</li>
  <li>the resulting JFR file is read back with <code class="language-plaintext highlighter-rouge">jdk.jfr.consumer</code>, which is a part of the JDK, and the
spans are correlated with the profiling samples</li>
</ul>

<div class="language-shell highlighter-rouge"><div class="highlight"><pre class="highlight"><code>./run-plain-otel.sh
./run-spring.sh
</code></pre></div></div>

<p>The only thing you have to provide is the async-profiler native library itself - the scripts will look
for it in a few usual places, or you can point them at it with <code class="language-plaintext highlighter-rouge">ASPROF_LIB=/path/to/libasyncProfiler.so</code>.</p>

<p>The output is worth a look even if you don’t intend to write any of this yourself, because it makes the
claims from this chapter checkable rather than merely plausible. The un-instrumented
<code class="language-plaintext highlighter-rouge">calculateDiscounts</code> really is a hole in the waterfall and really is the top method once you filter the
samples by tag. The root span’s tag really does show up three times, once per thread it was active on.
And a <code class="language-plaintext highlighter-rouge">290ms</code> span really does cover 29 samples at a <code class="language-plaintext highlighter-rouge">10ms</code> wall-clock interval.</p>]]></content><author><name></name></author><summary type="html"><![CDATA[[Java][Profiling] Async-profiler + OpenTelemetry spans]]></summary></entry><entry><title type="html">[Java][Profiling] Java/JVM native memory leaks</title><link href="https://krzysztofslusarski.github.io/2025/03/31/native.html" rel="alternate" type="text/html" title="[Java][Profiling] Java/JVM native memory leaks" /><published>2025-03-31T01:51:30+00:00</published><updated>2025-03-31T01:51:30+00:00</updated><id>https://krzysztofslusarski.github.io/2025/03/31/native</id><content type="html" xml:base="https://krzysztofslusarski.github.io/2025/03/31/native.html"><![CDATA[<h1 id="javaprofiling-javajvm-native-memory-leaks">[Java][Profiling] Java/JVM native memory leaks</h1>

<p>In this article, I would like to tackle the native memory leaks problem. Usually such a problem
starts with some monitoring system that alerts about high memory (RAM) utilization. We start the investigation and
we see that our Java process has eaten 8GB of RAM with <code class="language-plaintext highlighter-rouge">Xmx/Xms</code> set to 4GB. How is that possible?</p>

<p>Well, the heap is not the only memory needed for Java applications to run. Other pretty obvious memory areas are:</p>

<ul>
  <li><strong>Threads</strong> - each thread needs some native memory for its data</li>
  <li><strong>Metaspace</strong> - for our class definitions</li>
  <li><strong>Code cache/code heap</strong> - for JIT compiler output</li>
  <li>…</li>
</ul>

<h2 id="nmt">NMT</h2>

<p>JVM has a dedicated feature to track where the memory is needed. It’s called “Native memory tracking” (NMT) and is
disabled by default. There are two modes of NMT:</p>

<ul>
  <li><strong>Summary</strong> - This mode tracks the number of bytes allocated by JVM in each of the NMT category</li>
  <li><strong>Detail</strong> - This one gathers the same data as the summary + keeps track of which part of the code needs that memory</li>
</ul>

<p>There are many rumors and misconceptions about NMT overhead. In the
<a href="https://docs.oracle.com/javase/8/docs/technotes/guides/troubleshoot/tooldescr007.html" target="_blank">Oracle documentation</a>
you can find the following:</p>

<blockquote>
  <p>Enabling NMT will result in 5-10 percent JVM performance drop and memory usage for NMT adds 2 words to all malloc
memory as malloc header. NMT memory usage is also tracked by NMT.</p>
</blockquote>

<p>The confusing part of this quote is the fact that it’s written in <strong>detail</strong> mode explanation, and I cannot tell if
it’s a generic statement for both modes or just the latter.</p>

<p>The much better explanation you can find in <a href="https://stackoverflow.com/a/73167790" target="_blank">this Stack Overflow response</a>
by Andrei Pangin:</p>

<blockquote>
  <p>The overhead of Native Memory Tracking obviously depends on how often the application allocates native memory. Usually, this is not something too frequent in a Java application,
but cases may differ. Since you’ve already tried and didn’t notice performance difference, your application is apparently not an exception.</p>

  <p>In the <code class="language-plaintext highlighter-rouge">summary</code> mode, Native Memory Tracking roughly does the following things:</p>

  <ul>
    <li>increases every <code class="language-plaintext highlighter-rouge">malloc</code> request in the JVM by 2 machine words (16 bytes);</li>
    <li>records the allocation size and flags in these 2 words;</li>
    <li>atomically increments (or decrements on <code class="language-plaintext highlighter-rouge">free</code>) the counter corresponding to the given memory type;</li>
    <li>besides <code class="language-plaintext highlighter-rouge">malloc</code> and <code class="language-plaintext highlighter-rouge">free</code>, it also handles changes in virtual memory reservation and allocations of new arenas, but these are even less frequent than <code class="language-plaintext highlighter-rouge">malloc/free</code> calls.</li>
  </ul>

  <p>So, to me, the overhead is quite small; 5-10% is definitely a large overestimation (the numbers would make sense for <code class="language-plaintext highlighter-rouge">detail</code> mode which collects and stores stack traces, which is expensive, but
<code class="language-plaintext highlighter-rouge">summary</code> doesn’t do that).
When many threads concurrently allocate/free native memory, the update of an atomic counter could become a bottleneck, but again, that’s more like an extreme case. In short, if you measured a real
application and didn’t notice any degradation, you’re likely safe to enable NMT <code class="language-plaintext highlighter-rouge">summary</code> in production.</p>
</blockquote>

<p>The most important question is: can I run NMT in production? From my experience: most likely yes, in <strong>summary</strong> mode. We also need to mind circumstances when such a feature is needed - when we trace
strange memory consumption. It’s a really hard job, so we should use all the tools we can to find the root cause of the problem.</p>

<h3 id="usage---summary">Usage - summary</h3>

<p>To enable NMT in <strong>summary</strong> mode you need to start JVM with <code class="language-plaintext highlighter-rouge">-XX:NativeMemoryTracking=summary</code>. After that whenever we want to understand why JVM allocated some native memory we can run:</p>

<div class="language-shell highlighter-rouge"><div class="highlight"><pre class="highlight"><code>jcmd &lt;pid&gt; VM.native_memory summary <span class="nv">scale</span><span class="o">=</span>MB
</code></pre></div></div>

<p>Sample output:</p>

<div class="language-plaintext highlighter-rouge"><div class="highlight"><pre class="highlight"><code>Native Memory Tracking:

(Omitting categories weighting less than 1MB)

Total: reserved=2340MB, committed=1237MB
-                 Java Heap (reserved=1024MB, committed=1024MB)
                            (mmap: reserved=1024MB, committed=1024MB) 
 
-                     Class (reserved=1025MB, committed=11MB)
                            (classes #16326)
                            (  instance classes #15180, array classes #1146)
                            (malloc=1MB #31555) 
                            (mmap: reserved=1024MB, committed=10MB) 
                            (  Metadata:   )
                            (    reserved=64MB, committed=56MB)
                            (    used=55MB)
                            (    waste=0MB =0,63%)
                            (  Class space:)
                            (    reserved=1024MB, committed=10MB)
                            (    used=10MB)
                            (    waste=0MB =2,88%)
 
-                    Thread (reserved=50MB, committed=4MB)
                            (thread #51)
                            (stack: reserved=50MB, committed=4MB)
 
-                      Code (reserved=49MB, committed=15MB)
                            (malloc=1MB #7383) 
                            (mmap: reserved=48MB, committed=14MB) 
 
-                        GC (reserved=90MB, committed=90MB)
                            (malloc=19MB #9300) 
                            (mmap: reserved=70MB, committed=70MB) 
 
-                    Symbol (reserved=17MB, committed=17MB)
                            (malloc=15MB #401954) 
                            (arena=1MB #1)
 
-    Native Memory Tracking (reserved=7MB, committed=7MB)
                            (tracking overhead=7MB)
 
-        Shared class space (reserved=12MB, committed=12MB)
                            (mmap: reserved=12MB, committed=12MB) 
 
-               Arena Chunk (reserved=1MB, committed=1MB)
                            (malloc=1MB) 
 
-                 Metaspace (reserved=64MB, committed=56MB)
                            (mmap: reserved=64MB, committed=56MB) 
</code></pre></div></div>

<h3 id="usage---diff">Usage - diff</h3>

<p>If we want to understand which NMT category is increasing we don’t need to compare two outputs like the one above. NMT has built-in diff operation. First, we need to set a baseline with:</p>

<div class="language-shell highlighter-rouge"><div class="highlight"><pre class="highlight"><code>jcmd &lt;pid&gt; VM.native_memory baseline
</code></pre></div></div>

<p>After some time (when we see that more memory was consumed by the Java process) we can run:</p>

<div class="language-shell highlighter-rouge"><div class="highlight"><pre class="highlight"><code>jcmd &lt;pid&gt; VM.native_memory summary.diff <span class="nv">scale</span><span class="o">=</span>MB
</code></pre></div></div>

<p>Sample output:</p>

<div class="language-plaintext highlighter-rouge"><div class="highlight"><pre class="highlight"><code>Native Memory Tracking:

(Omitting categories weighting less than 1MB)

Total: reserved=3350MB +1004MB, committed=2257MB +1013MB

-                 Java Heap (reserved=1024MB, committed=1024MB)
                            (mmap: reserved=1024MB, committed=1024MB)
 
-                     Class (reserved=1026MB, committed=12MB)
                            (classes #16935 +7)
                            (  instance classes #15732 +4, array classes #1203 +3)
                            (malloc=2MB #34724 +2040)
                            (mmap: reserved=1024MB, committed=10MB)
                           : (  Metadata)
                            (    reserved=64MB, committed=58MB)
                            (    used=57MB)
                            (    waste=0MB =0,58%)
                           : (  Class space)
                            (    reserved=1024MB, committed=10MB)
                            (    used=10MB)
                            (    waste=0MB =2,82%)
 
-                    Thread (reserved=48MB -4MB, committed=4MB)
                            (thread #0)
                            (stack: reserved=48MB -4MB, committed=4MB)
 
-                      Code (reserved=50MB, committed=21MB +6MB)
                            (malloc=1MB #10044 +2426)
                            (mmap: reserved=48MB, committed=20MB +6MB)
 
-                        GC (reserved=90MB, committed=90MB)
                            (malloc=19MB #13489 +3620)
                            (mmap: reserved=70MB, committed=70MB)
 
-                     Other (reserved=1011MB +1007MB, committed=1011MB +1007MB)
                            (malloc=1011MB +1007MB #1025 +1008)
 
-                    Symbol (reserved=17MB, committed=17MB)
                            (malloc=16MB #412735 +275)
                            (arena=1MB #1)
 
-    Native Memory Tracking (reserved=7MB, committed=7MB)
                            (tracking overhead=7MB)
 
-        Shared class space (reserved=12MB, committed=12MB)
                            (mmap: reserved=12MB, committed=12MB)
 
-                 Metaspace (reserved=64MB, committed=58MB)
                            (mmap: reserved=64MB, committed=58MB)
</code></pre></div></div>

<p>First, we can look at information in line starting with <em>Total</em> where we can see <em>+1013MB</em>. It means that our JVM allocated almost <strong>1GB</strong> of native memory since we ran the <code class="language-plaintext highlighter-rouge">baseline</code> command.
When we browse all the categories we can see this one:</p>

<div class="language-plaintext highlighter-rouge"><div class="highlight"><pre class="highlight"><code>-                     Other (reserved=1011MB +1007MB, committed=1011MB +1007MB)
                            (malloc=1011MB +1007MB #1025 +1008)
</code></pre></div></div>

<h3 id="nmt---categories">NMT - categories</h3>

<p>Let’s now go through those categories and try to understand what we can do if memory consumption is increasing there.</p>

<ul>
  <li><code class="language-plaintext highlighter-rouge">Java Heap</code> - An increase in that category means that your initial or minimal heap size is different from the max one and the heap simply grows.</li>
  <li><code class="language-plaintext highlighter-rouge">Class</code> - New classes were loaded in the runtime. Depending on the volume of consumed memory it can be the natural behavior of the application. Many libraries define/load classes in the runtime.
 If the increase here is abnormal you can try to profile where new classes are loaded with <a href="../../../2022/12/12/async-manual.html#methods-classes" target="_blank">Async-profiler</a>.</li>
  <li><code class="language-plaintext highlighter-rouge">Thread</code> - In most configurations, every Java thread can use up to <strong>1MB</strong> (<code class="language-plaintext highlighter-rouge">-Xss</code>). Increasing consumption in that category usually means:
    <ul>
      <li>that existing threads needed more memory - for example, it reached code with deep stack</li>
      <li>new threads were created - you can find places that create new threads with <a href="../../../2022/12/12/async-manual.html#methods-thread" target="_blank">Async-profiler</a>.</li>
    </ul>
  </li>
  <li><code class="language-plaintext highlighter-rouge">Code</code> - This is a space for JIT, it can grow up to <strong>~240MB</strong> (<code class="language-plaintext highlighter-rouge">-XX:ReservedCodeCacheSize</code>). Increasing consumption here is natural. The longer our JVM is running the more methods are compiled 
 by JIT.</li>
  <li><code class="language-plaintext highlighter-rouge">Other</code> - Here you can find a native memory allocated with <code class="language-plaintext highlighter-rouge">ByteBuffer.allocateDirect</code>. If you want to understand why this category grows you can run Async-profiler in method mode to find
 invocations of the <code class="language-plaintext highlighter-rouge">allocateDirect</code> method, or you can analyze the <strong>heap dump</strong>. 
 You can also find here other allocations done with <code class="language-plaintext highlighter-rouge">Unsafe.allocateMemory</code> method.</li>
</ul>

<p>Those are the most common scenarios I approached in my career. Mind that JVM can also have issues in its code that result in large memory consumption like 
<a href="https://bugs.openjdk.org/browse/JDK-8240723" target="_blank">JDK-8240723</a>.</p>

<h2 id="nmt-vs-rsspss-vs-total-memory-allocated-in-the-system">NMT vs RSS/PSS vs total memory allocated in the system</h2>

<p>To move on I want to point out the difference between three metrics:</p>
<ul>
  <li><strong>NMT committed memory</strong> - how much memory JVM used, counted by JVM internals.</li>
  <li><strong>RSS/PSS</strong> - how much memory the Java process used from an OS perspective.</li>
  <li><strong>The total memory allocated in the system</strong> - this one is straightforward, it counts not only the Java process but everything system-wide.</li>
</ul>

<p>Today many of the new applications written in Java are run in Docker containers so we would expect those three values to be the same. Well, the reality is a bit different.</p>

<h3 id="native-libs">Native libs</h3>

<p>When you run your Java code you are allowed to invoke native code with JNI (and other mechanisms, but that’s irrelevant). Additionally, JDK can invoke native libraries via JNI
(as en example you can look at the source code of <code class="language-plaintext highlighter-rouge">java.util.zip.Inflater</code> class, a lot of <code class="language-plaintext highlighter-rouge">native</code> methods).
The code inside the external native library is out of JVM’s control.
That means that if our native code does <code class="language-plaintext highlighter-rouge">malloc</code>, JVM doesn’t know about that. This basically means that NMT <strong>cannot trace such an allocation</strong>. Remember that you don’t need to invoke JNI by
yourself, your dependencies can do it for you. A lot of libraries do that. If your code or your dependency code has a native memory leak done inside the JNI section RSS/PSS can grow while NMT
committed memory will stay the same.</p>

<p>To track down native memory leaks (no matter if it is inside JVM or native libs) we need to find allocated memory that hasn’t been freed. For many years there was no tool that could do it and give you
Java stacktraces. In the past, we could use <a href="../../../2022/12/12/async-manual.html#perf-pf" target="_blank">Async-profiler</a> and trace:</p>
<ul>
  <li><code class="language-plaintext highlighter-rouge">page-faults</code></li>
  <li><code class="language-plaintext highlighter-rouge">malloc</code> invocations</li>
  <li><code class="language-plaintext highlighter-rouge">mprotect</code> invocations</li>
</ul>

<p>But all we could get from it was where memory was allocated. We didn’t know which parts of the allocated memory were freed later. For all those years my approach to finding native memory leaks was as 
follows:</p>

<ul>
  <li>Check <strong>JMX metrics</strong> (either in Grafana/Zabbix/… or by manual JMX connection) to see what JVM reports for classloading and direct buffer allocations.</li>
  <li>If there was no visible leak - <strong>turn on NMT</strong> in <em>summary</em> mode and pray that the answer is there.</li>
  <li>If there was no visible leak in NMT - <strong>profile</strong> for <code class="language-plaintext highlighter-rouge">page-faults</code> and filter manually every allocation that is tracked by NMT</li>
  <li>For every native allocation found while RSS/PSS was increasing:
    <ul>
      <li>Filter manually every allocation that is tracked by NMT</li>
      <li>Run such a code in isolation.</li>
      <li>Check if RSS/PSS increases.</li>
    </ul>
  </li>
</ul>

<p>Current “microservices” can have easily tens (and even more than a hundred) of different places where native memory is allocated. That was really time-consuming work, and from time to time there was
no native memory leak after all - we will get to that later.</p>

<p>Thankfully those dark times are over. There is a new mode in the Async-profiler called <code class="language-plaintext highlighter-rouge">nativemem</code>. It keeps track of allocations and frees and can show us which memory hasn’t been freed during profiling.
That mode literally can save you hours of your life with investigation. This new mode is available in the  <strong>4.0</strong> release. Let’s see the difference between <code class="language-plaintext highlighter-rouge">nativemem</code> and previous approaches.</p>

<p>I have an application with two endpoints:</p>

<div class="language-java highlighter-rouge"><div class="highlight"><pre class="highlight"><code><span class="nd">@RestController</span>
<span class="nd">@RequestMapping</span><span class="o">(</span><span class="s">"/examples/nativemem"</span><span class="o">)</span>
<span class="nd">@RequiredArgsConstructor</span>
<span class="kd">class</span> <span class="nc">NativeMemController</span> <span class="o">{</span>
    <span class="kd">private</span> <span class="kd">final</span> <span class="nc">NativeMemService</span> <span class="n">nativeMemService</span><span class="o">;</span>

    <span class="nd">@GetMapping</span><span class="o">(</span><span class="s">"/leak"</span><span class="o">)</span>
    <span class="nc">String</span> <span class="nf">getWithLeak</span><span class="o">()</span> <span class="o">{</span>
        <span class="n">nativeMemService</span><span class="o">.</span><span class="na">createNewBuffer</span><span class="o">(</span><span class="kc">true</span><span class="o">);</span>
        <span class="k">return</span> <span class="s">"OK"</span><span class="o">;</span>
    <span class="o">}</span>

    <span class="nd">@GetMapping</span><span class="o">(</span><span class="s">"/no-leak"</span><span class="o">)</span>
    <span class="nc">String</span> <span class="nf">getNoLeak</span><span class="o">()</span> <span class="o">{</span>
        <span class="n">nativeMemService</span><span class="o">.</span><span class="na">createNewBuffer</span><span class="o">(</span><span class="kc">false</span><span class="o">);</span>
        <span class="k">return</span> <span class="s">"OK"</span><span class="o">;</span>
    <span class="o">}</span>
<span class="o">}</span>

<span class="kd">class</span> <span class="nc">NativeMemService</span> <span class="o">{</span>
    <span class="kd">private</span> <span class="kd">final</span> <span class="nc">List</span><span class="o">&lt;</span><span class="nc">ByteBuffer</span><span class="o">&gt;</span> <span class="n">buffers</span> <span class="o">=</span> <span class="k">new</span> <span class="nc">ArrayList</span><span class="o">&lt;&gt;();</span>

    <span class="kt">void</span> <span class="nf">createNewBuffer</span><span class="o">(</span><span class="kt">boolean</span> <span class="n">leak</span><span class="o">)</span> <span class="o">{</span>
        <span class="nc">ByteBuffer</span> <span class="n">direct</span> <span class="o">=</span> <span class="nc">ByteBuffer</span><span class="o">.</span><span class="na">allocateDirect</span><span class="o">(</span><span class="mi">1024</span> <span class="o">*</span> <span class="mi">1024</span><span class="o">);</span>
        <span class="k">if</span> <span class="o">(</span><span class="n">leak</span><span class="o">)</span> <span class="o">{</span>
            <span class="n">buffers</span><span class="o">.</span><span class="na">add</span><span class="o">(</span><span class="n">direct</span><span class="o">);</span>
        <span class="o">}</span>
    <span class="o">}</span>
<span class="o">}</span>
</code></pre></div></div>

<p>A call to <code class="language-plaintext highlighter-rouge">/leak</code> endpoint will create <em>1 MB</em> of native memory leak, a call to <code class="language-plaintext highlighter-rouge">/no-leak</code> endpoint will allocate <em>1 MB</em> of native memory that should be freed by GC.</p>

<p>Here is a full script that I did:</p>

<div class="language-shell highlighter-rouge"><div class="highlight"><pre class="highlight"><code><span class="c">#Warm-up</span>
ab <span class="nt">-n</span> 300 http://localhost:8081/examples/nativemem/leak
ab <span class="nt">-n</span> 300 http://localhost:8081/examples/nativemem/no-leak

./asprof <span class="nt">-e</span> nativemem <span class="nt">-f</span> nativemem.jfr start 11817
ab <span class="nt">-n</span> 300 http://localhost:8081/examples/nativemem/leak
ab <span class="nt">-n</span> 300 http://localhost:8081/examples/nativemem/no-leak
jcmd 11817 GC.run
./asprof stop 11817
./jfrconv <span class="nt">--total</span> <span class="nt">--nativemem</span> <span class="nt">--leak</span> nativemem.jfr nativemem.html

./asprof <span class="nt">-e</span> page-faults <span class="nt">-f</span> faults.jfr start 11817
ab <span class="nt">-n</span> 300 http://localhost:8081/examples/nativemem/leak
ab <span class="nt">-n</span> 300 http://localhost:8081/examples/nativemem/no-leak
jcmd 11817 GC.run
./asprof stop 11817
./jfrconv faults.jfr faults.html

./asprof <span class="nt">-e</span> mprotect <span class="nt">-f</span> mprotect.jfr start 11817
ab <span class="nt">-n</span> 300 http://localhost:8081/examples/nativemem/leak
ab <span class="nt">-n</span> 300 http://localhost:8081/examples/nativemem/no-leak
jcmd 11817 GC.run
./asprof stop 11817
./jfrconv mprotect.jfr mprotect.html
</code></pre></div></div>

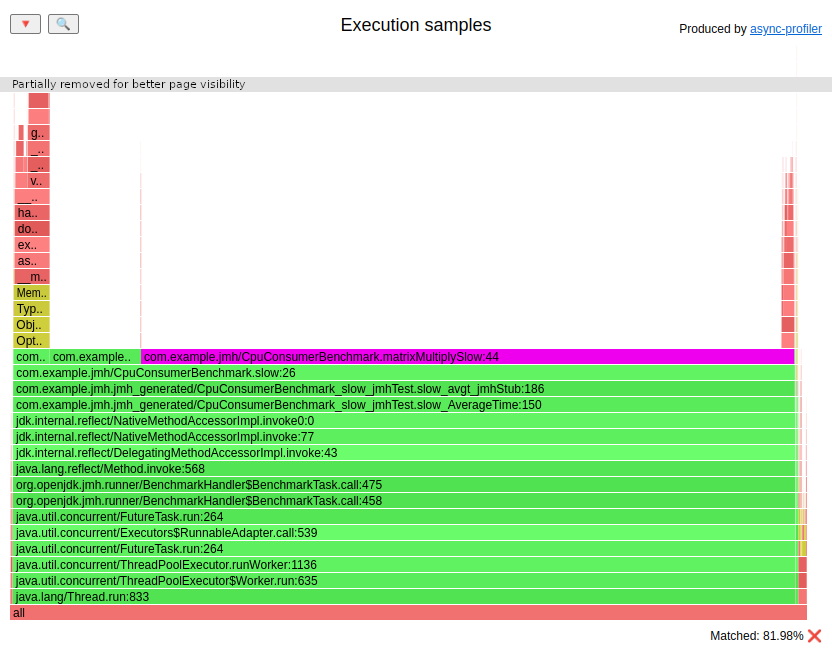
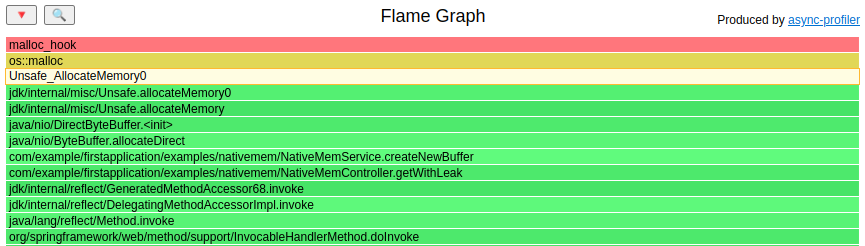
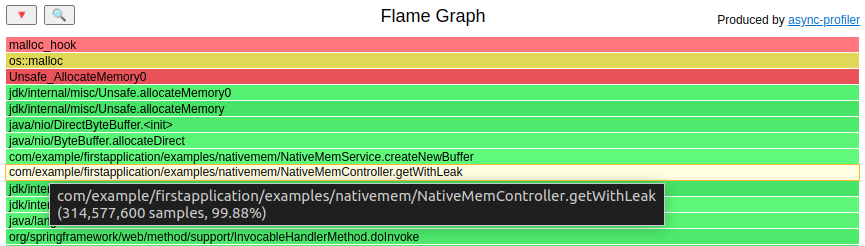
<p><code class="language-plaintext highlighter-rouge">nativemem</code> flame graph shows the correct code to blame:
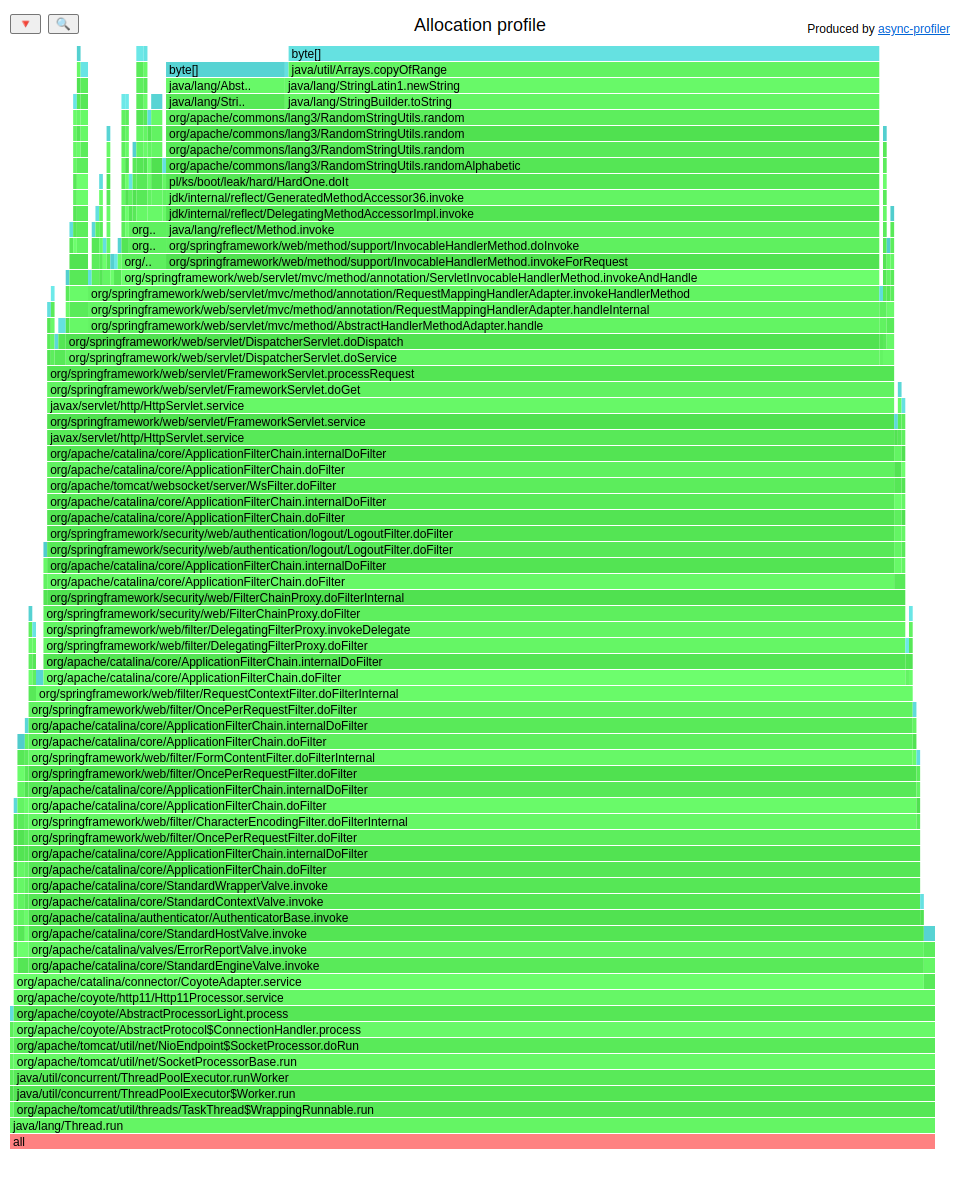
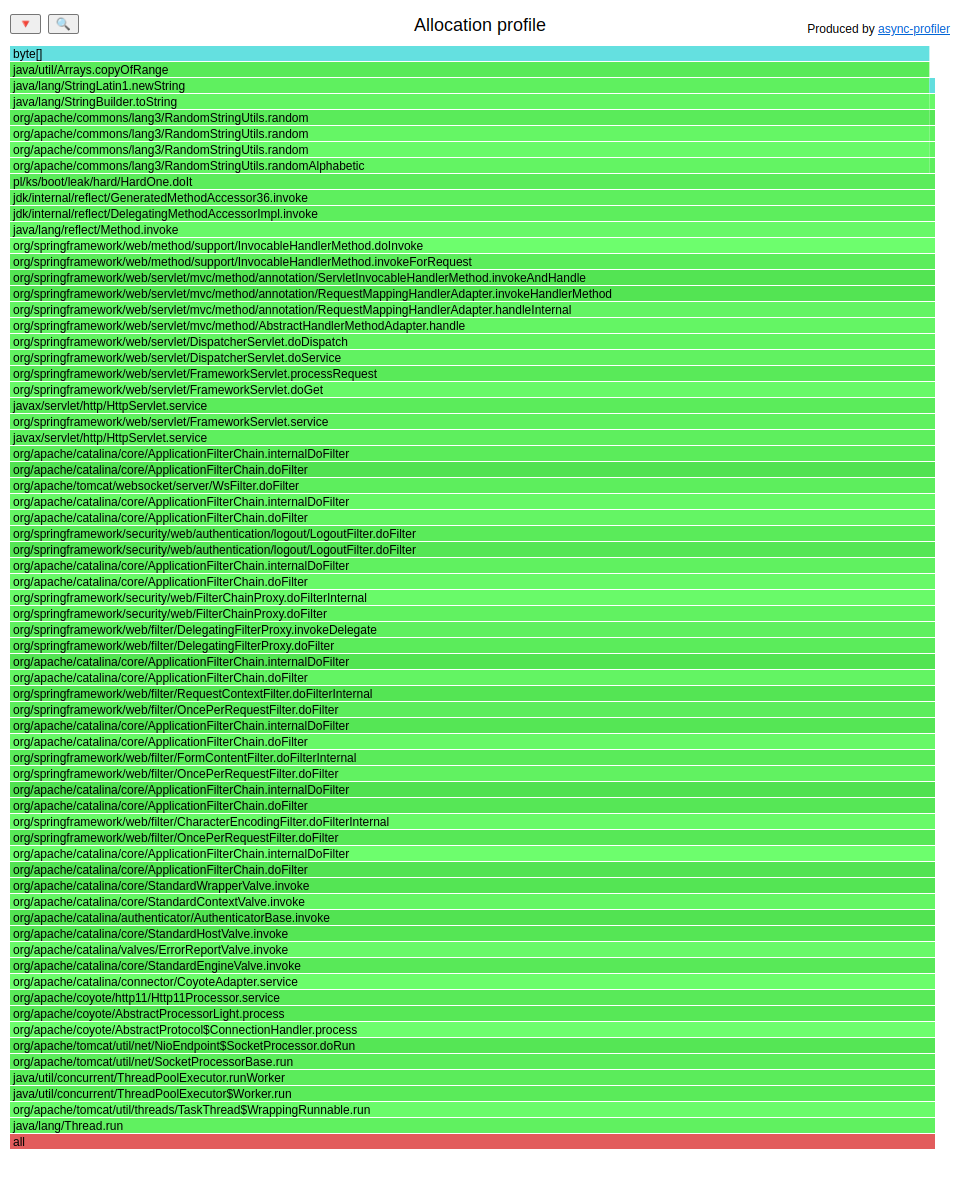
<img src="/assets/nativemem/nativemem.png" alt="alt text" title="nativemem" />
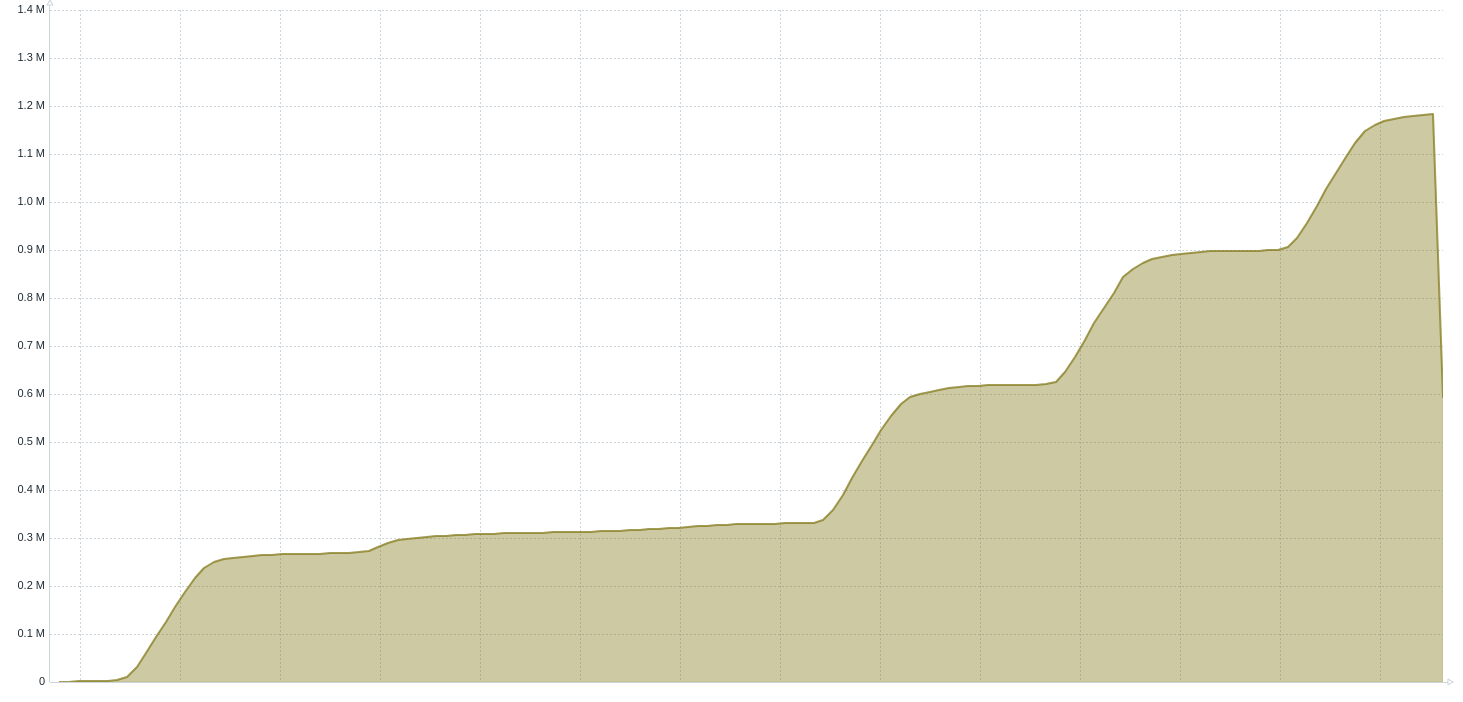
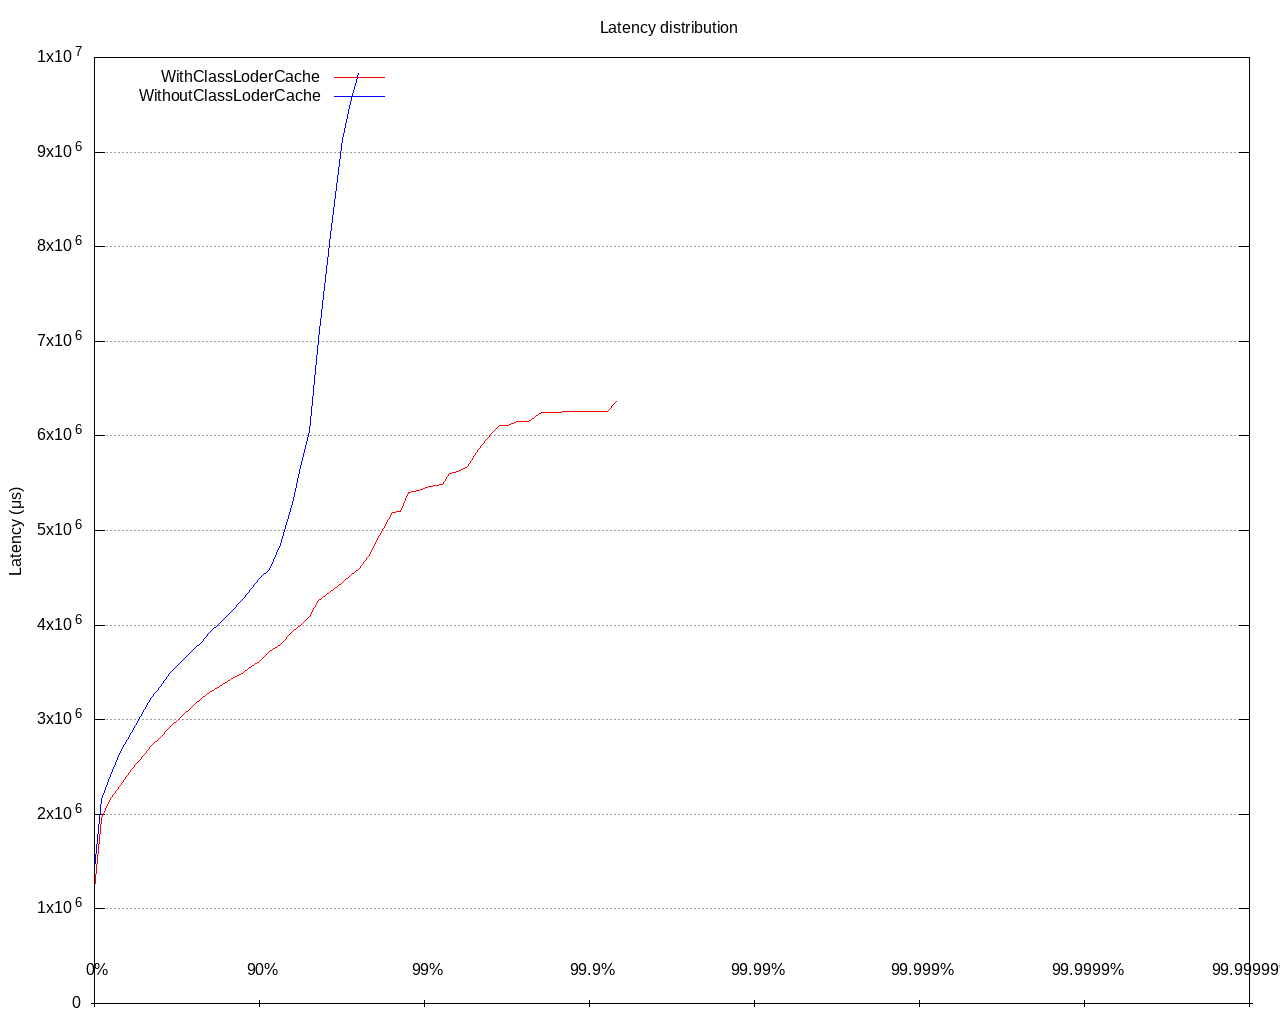
Since we used the <code class="language-plaintext highlighter-rouge">--total</code> option with <code class="language-plaintext highlighter-rouge">jfrconv</code> it also shows that we leaked <em>300 MB</em>:
<img src="/assets/nativemem/nativemem2.png" alt="alt text" title="nativemem2" /></p>

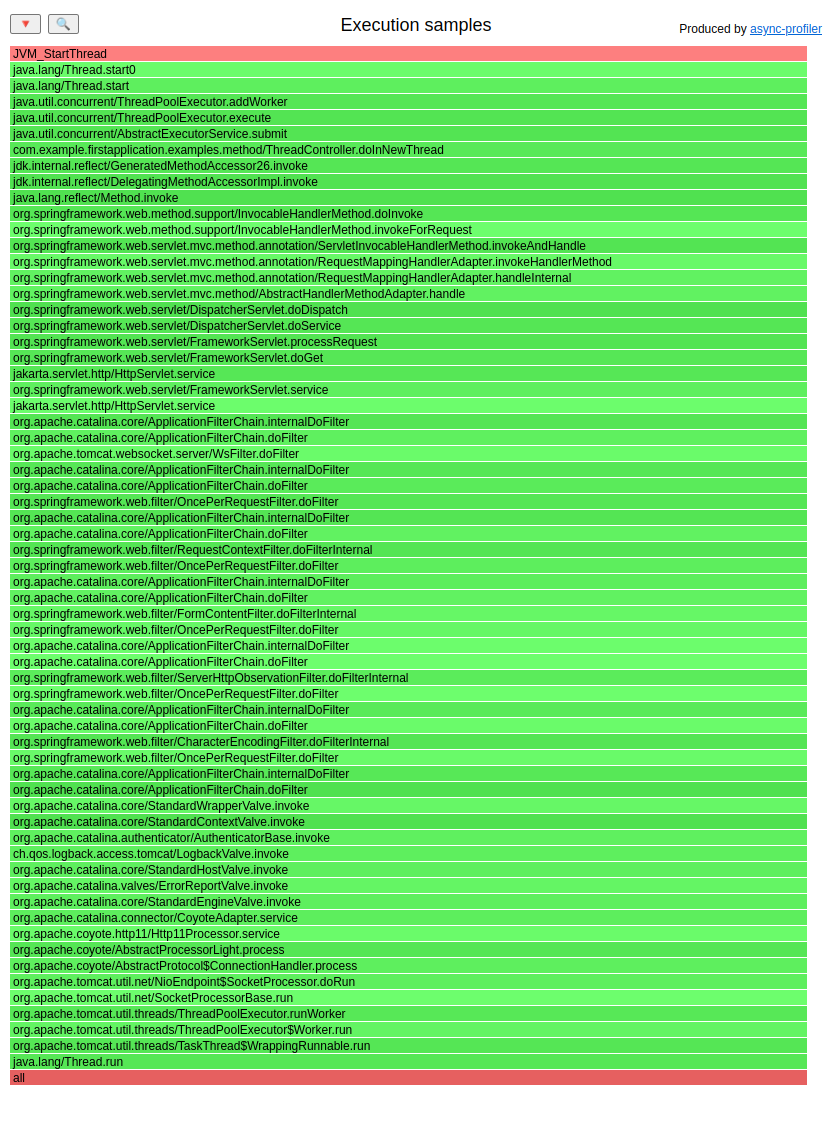
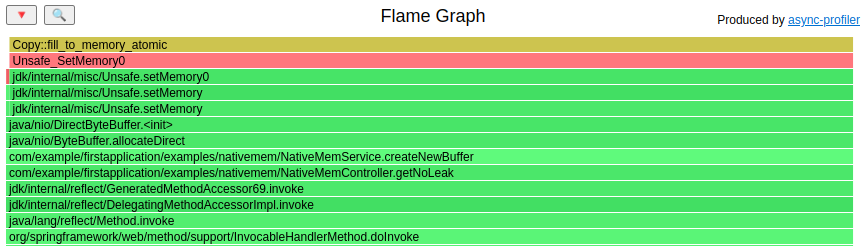
<p><code class="language-plaintext highlighter-rouge">mprotect</code> flame graph shows both allocations, leaky and non-leaky. In the real world, you can easily get one leaky and one hundred non-leaky:
<img src="/assets/nativemem/mprotect.png" alt="alt text" title="mprotect" /></p>

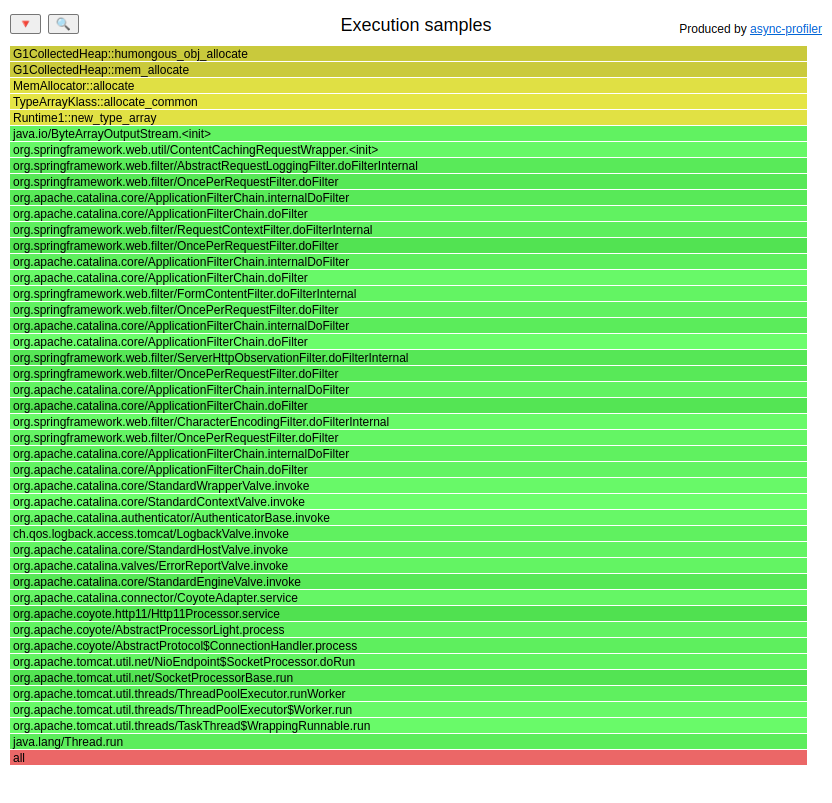
<p><code class="language-plaintext highlighter-rouge">page-faults</code> is the worst in that test, it blames the wrong endpoint and doesn’t show the proper allocation path in the flame graph:
<img src="/assets/nativemem/faults.png" alt="alt text" title="faults" /></p>

<h3 id="malloc">Malloc</h3>

<p>If you’ve tried to find a native memory leak with no results … well, there are still some other strange cases to consider. In this article, I cover only the most popular that I’ve seen many times.
This strange case is <code class="language-plaintext highlighter-rouge">malloc</code> from <em>GLIBC</em> causing strange memory consumption. There are many articles on that topic in the internet. Here is 
<a href="https://www.speedshop.co/2017/12/04/malloc-doubles-ruby-memory.html" target="_blank">one of them from Ruby</a>. Mind that <code class="language-plaintext highlighter-rouge">malloc</code> an is allocator used by many languages, so if you do your search
on that topic don’t narrow it to Java only.</p>

<p>Let’s consider a program:</p>
<div class="language-java highlighter-rouge"><div class="highlight"><pre class="highlight"><code><span class="kd">class</span> <span class="nc">ByteBufferFragmentationExample</span> <span class="o">{</span>
    <span class="kd">public</span> <span class="kd">static</span> <span class="kt">void</span> <span class="nf">main</span><span class="o">(</span><span class="nc">String</span><span class="o">[]</span> <span class="n">args</span><span class="o">)</span> <span class="kd">throws</span> <span class="nc">InterruptedException</span> <span class="o">{</span>
        <span class="nc">Thread</span><span class="o">.</span><span class="na">sleep</span><span class="o">(</span><span class="mi">10_000</span><span class="o">);</span>
        <span class="k">for</span> <span class="o">(</span><span class="kt">int</span> <span class="n">i</span> <span class="o">=</span> <span class="mi">0</span><span class="o">;</span> <span class="n">i</span> <span class="o">&lt;</span> <span class="mi">60</span><span class="o">;</span> <span class="n">i</span><span class="o">++)</span> <span class="o">{</span>
            <span class="k">new</span> <span class="nf">Thread</span><span class="o">(()</span> <span class="o">-&gt;</span> <span class="o">{</span>
                <span class="nc">Random</span> <span class="n">random</span> <span class="o">=</span> <span class="k">new</span> <span class="nc">Random</span><span class="o">();</span>
                <span class="k">while</span> <span class="o">(</span><span class="kc">true</span><span class="o">)</span> <span class="o">{</span>
                    <span class="nc">ByteBuffer</span><span class="o">.</span><span class="na">allocateDirect</span><span class="o">(</span><span class="n">random</span><span class="o">.</span><span class="na">nextInt</span><span class="o">(</span><span class="mi">1024</span> <span class="o">*</span> <span class="mi">1024</span><span class="o">));</span>
                <span class="o">}</span>
            <span class="o">}).</span><span class="na">start</span><span class="o">();</span>
        <span class="o">}</span>
    <span class="o">}</span>
<span class="o">}</span>
</code></pre></div></div>

<p>Let’s run it with <code class="language-plaintext highlighter-rouge">-Xmx1G -Xms1G -XX:+AlwaysPreTouch -XX:NativeMemoryTracking=summary</code>, so our heap is limited to <em>1 GB</em> and allocated at the start of JVM. At the beginning, the RSS and PSS are:</p>
<div class="language-shell highlighter-rouge"><div class="highlight"><pre class="highlight"><code><span class="nv">$ </span>smem <span class="nt">-c</span> <span class="s2">"pid command rss pss"</span> <span class="nt">-ak</span> <span class="nt">-P</span> <span class="s2">"ByteBufferFragmentationExample"</span>
</code></pre></div></div>

<div class="language-plaintext highlighter-rouge"><div class="highlight"><pre class="highlight"><code>  PID Command                                                  RSS     PSS 
15753 /home/pasq/JDK/amazon-corretto-17.0.1.12.1-linux-x64    1.1G    1.1G 
</code></pre></div></div>

<p>After some time:</p>
<div class="language-plaintext highlighter-rouge"><div class="highlight"><pre class="highlight"><code>  PID Command                                                  RSS     PSS 
15474 /home/pasq/JDK/amazon-corretto-17.0.1.12.1-linux-x64    5.1G    5.1G 
</code></pre></div></div>

<p>If we check the NMT output we will get:</p>
<div class="language-shell highlighter-rouge"><div class="highlight"><pre class="highlight"><code>jcmd ByteBufferFragmentationExample VM.native_memory summary <span class="nv">scale</span><span class="o">=</span>MB
</code></pre></div></div>

<div class="language-plaintext highlighter-rouge"><div class="highlight"><pre class="highlight"><code>15753:

Native Memory Tracking:

(Omitting categories weighting less than 1MB)

Total: reserved=3519MB, committed=2176MB
-                 Java Heap (reserved=1024MB, committed=1024MB)
                            (mmap: reserved=1024MB, committed=1024MB) 
 
-                     Class (reserved=1024MB, committed=1MB)
                            (classes #2311)
                            (  instance classes #2082, array classes #229)
                            (mmap: reserved=1024MB, committed=1MB) 
                            (  Metadata:   )
                            (    reserved=8MB, committed=5MB)
                            (    used=5MB)
                            (    waste=0MB =1,86%)
                            (  Class space:)
                            (    reserved=1024MB, committed=1MB)
                            (    used=1MB)
                            (    waste=0MB =13,09%)
 
-                    Thread (reserved=91MB, committed=8MB)
                            (thread #92)
                            (stack: reserved=91MB, committed=8MB)
 
-                      Code (reserved=242MB, committed=8MB)
                            (mmap: reserved=242MB, committed=7MB) 
 
-                        GC (reserved=89MB, committed=89MB)
                            (malloc=19MB #4046) 
                            (mmap: reserved=70MB, committed=70MB) 
 
-                  Compiler (reserved=1MB, committed=1MB)
 
-                     Other (reserved=1024MB, committed=1024MB)
                            (malloc=1024MB #2048) 
 
-                    Symbol (reserved=2MB, committed=2MB)
                            (malloc=1MB #22702) 
                            (arena=1MB #1)
 
-    Native Memory Tracking (reserved=1MB, committed=1MB)
                            (tracking overhead=1MB)
 
-        Shared class space (reserved=12MB, committed=12MB)
                            (mmap: reserved=12MB, committed=12MB) 
 
-               Arena Chunk (reserved=1MB, committed=1MB)
                            (malloc=1MB) 
 
-                 Metaspace (reserved=8MB, committed=5MB)
                            (mmap: reserved=8MB, committed=5MB)
</code></pre></div></div>

<p>Looks like Java only committed <em>2 GB</em> of memory. There is no point in looking for a leak in our program, there is no leak. The result from <code class="language-plaintext highlighter-rouge">allocateDirect</code> method can be collected by GC 
the on next run.</p>

<p>Nowadays, I see that problem most commonly when engineers decide to use an <em>Amazon Linux</em>, usually by fetching an <em>Amazon Corretto</em> docker image. This problem is not <em>Amazon</em> specific, in last few 
years I mostly profiled applications deployed on AWS. Such applications usually used <em>Corretto</em> docker images. Example <em>Dockerfile</em> for <em>Amazon Linux</em> starts with:</p>

<div class="language-dockerfile highlighter-rouge"><div class="highlight"><pre class="highlight"><code><span class="k">FROM</span><span class="s"> amazoncorretto:21</span>
</code></pre></div></div>

<p>My approach to that problem is to change allocator to <em>jemalloc</em>:</p>

<div class="language-dockerfile highlighter-rouge"><div class="highlight"><pre class="highlight"><code><span class="k">FROM</span><span class="s"> amazoncorretto:21</span>
<span class="k">RUN </span>amazon-linux-extras <span class="nb">install</span> <span class="nt">-y</span> epel
<span class="k">RUN </span>yum <span class="nb">install</span> <span class="nt">-y</span> jemalloc-devel
<span class="k">ENV</span><span class="s"> LD_PRELOAD="/usr/lib64/libjemalloc.so"</span>
</code></pre></div></div>

<p>Mind that if you’re using <em>Alpine</em> images/Linux you’re using <em>musl libc</em>, not GLIBC. I’ve never seen that issue with <em>musl</em>.</p>]]></content><author><name></name></author><summary type="html"><![CDATA[[Java][Profiling] Java/JVM native memory leaks]]></summary></entry><entry><title type="html">[Java][Profiling] Async-profiler - manual by use cases</title><link href="https://krzysztofslusarski.github.io/2022/12/12/async-manual.html" rel="alternate" type="text/html" title="[Java][Profiling] Async-profiler - manual by use cases" /><published>2022-12-12T01:51:30+00:00</published><updated>2022-12-12T01:51:30+00:00</updated><id>https://krzysztofslusarski.github.io/2022/12/12/async-manual</id><content type="html" xml:base="https://krzysztofslusarski.github.io/2022/12/12/async-manual.html"><![CDATA[<h1 id="javaprofiling-async-profiler---manual-by-use-cases">[Java][Profiling] Async-profiler - manual by use cases</h1>

<p>This blog post contains examples of async-profiler usages that I have found helpful in my job.
Some content of this post is copy-pasted from previous entries, as I just wanted to avoid unnecessary
jumps between articles.</p>

<p>The goal of that post is to give examples. It’s not a replacement for the project <a href="https://github.com/jvm-profiling-tools/async-profiler#readme" target="_blank">README</a>. I advise you to read it, as it tells you how to obtain async-profiler binaries and more.</p>

<p>All the examples that you are going to see here are synthetic reproductions of real-world 
problems that I solved during my career. Even if some examples look like “it’s too stupid
to happen anywhere,” well, it isn’t.</p>

<p>That post will be maintained. Whenever I find a new use case that I think is worth sharing, I will update
this post.</p>

<ul>
  <li><a href="#change-log">Change log</a></li>
  <li><a href="#acknowledgments">Acknowledgments</a></li>
  <li><a href="#profiled-application">Profiled application</a></li>
  <li><a href="#how-to">How to run an async-profiler</a>
    <ul>
      <li><a href="#how-to-cl">Command line</a></li>
      <li><a href="#how-to-jvm">During JVM startup</a></li>
      <li><a href="#how-to-java">From Java API</a></li>
      <li><a href="#how-to-jmh">From JMH benchmark</a></li>
      <li><a href="#how-to-apl">AP-Loader</a></li>
      <li><a href="#how-to-idea">IntelliJ Idea</a></li>
    </ul>
  </li>
  <li><a href="#out">Output formats</a></li>
  <li><a href="#flames">Flame graphs</a></li>
  <li><a href="#basic-resources">Basic resources profiling</a>
    <ul>
      <li><a href="#wall">Wall-clock</a></li>
      <li><a href="#wall-filter">Wall-clock - filtering</a></li>
      <li><a href="#cpu-easy">CPU - easy-peasy</a></li>
      <li><a href="#cpu-hard">CPU - a bit harder</a></li>
      <li><a href="#alloc">Allocation</a></li>
      <li><a href="#alloc-ha">Allocation - humongous objects</a></li>
      <li><a href="#alloc-live">Allocation - live objects</a></li>
      <li><a href="#locks">Locks</a></li>
    </ul>
  </li>
  <li><a href="#tts">Time to safepoint</a></li>
  <li><a href="#methods">Methods profiling</a></li>
  <li><a href="#methods-native">Native functions</a>
    <ul>
      <li><a href="#methods-ex">Exceptions</a></li>
      <li><a href="#methods-g1ha">G1GC humongous allocation</a></li>
      <li><a href="#methods-thread">Thread start</a></li>
      <li><a href="#methods-classes">Class loading</a></li>
    </ul>
  </li>
  <li><a href="#perf">Perf events</a>
    <ul>
      <li><a href="#perf-cache">Cache misses</a></li>
      <li><a href="#perf-pf">Page faults</a></li>
      <li><a href="#perf-cycles">Cycles</a></li>
    </ul>
  </li>
  <li><a href="#nativemem">Native memory leaks</a></li>
  <li><a href="#single-req">Filtering single request</a>
    <ul>
      <li><a href="#single-req-why">Why aggregated results are not enough</a></li>
      <li><a href="#single-req-dns">Real life example - DNS</a></li>
    </ul>
  </li>
  <li><a href="#continuous">Continuous profiling</a>
    <ul>
      <li><a href="#continuous-cli}">Command line</a></li>
      <li><a href="#continuous-java">Java</a></li>
      <li><a href="#continuous-spring">Spring Boot</a></li>
    </ul>
  </li>
  <li><a href="#context-id">Contextual profiling</a>
    <ul>
      <li><a href="#context-id-spring">Spring Boot microservices</a></li>
      <li><a href="#context-id-hz">Distributed systems</a></li>
    </ul>
  </li>
  <li><a href="#stability">Stability</a></li>
  <li><a href="#overhead">Overhead</a></li>
  <li><a href="#random">Random thoughts</a></li>
</ul>

<h2 id="change-log">Change log</h2>

<ul>
  <li>2022-12-16 - Initial version</li>
</ul>

<h2 id="acknowledgments">Acknowledgments</h2>

<p>I would like to say thank you to <a href="https://twitter.com/AndreiPangin" target="_blank">Andrei Pangin</a>
(<a href="https://lightrun.com/" target="_blank">Lightrun</a>)
for all the work he did to create async-profiler and for
his time and remarks on that article,
<a href="https://twitter.com/parttimen3rd" target="_blank">Johannes Bechberger</a> (<a href="https://sapmachine.io/" target="_blank">SapMachine team</a> at <a href="https://sap.com" target="_blank">SAP</a>) for all the work on making OpenJDK more stable with 
profilers, the input he gave me on overhead and stability, and the copy editing of this document,
<a href="https://twitter.com/MGrzejszczak" target="_blank">Marcin Grzejszczak</a>
(<a href="https://www.vmware.com/pl.html" target="_blank">VMware</a>)
for great insight on how to integrate this profiler with
Spring,
<a href="https://twitter.com/k_zybala">Krystian Zybała</a> for the review.</p>

<h2 id="profiled-application">Profiled application</h2>

<p>I’ve created a Spring Boot application for this post so that you can run the following examples
on your own. It’s available on
<a href="https://github.com/krzysztofslusarski/async-profiler-demos" target="_blank">my GitHub</a>.
To build the application, do the following:</p>

<div class="language-shell highlighter-rouge"><div class="highlight"><pre class="highlight"><code>git clone https://github.com/krzysztofslusarski/async-profiler-demos
<span class="nb">cd </span>async-profiler-demos
mvn clean package
</code></pre></div></div>

<p>To run the application, you need three terminals where you run the following (you need the ports 8081, 8082, and 8083 available):</p>

<div class="language-shell highlighter-rouge"><div class="highlight"><pre class="highlight"><code>java <span class="nt">-Xms1G</span> <span class="nt">-Xmx1G</span> <span class="nt">-XX</span>:+AlwaysPreTouch <span class="se">\</span>
<span class="nt">-XX</span>:+UnlockDiagnosticVMOptions <span class="nt">-XX</span>:+DebugNonSafepoints <span class="se">\</span>
<span class="nt">-Duser</span>.language<span class="o">=</span>en-US <span class="se">\</span>
<span class="nt">-Xlog</span>:safepoint,gc+humongous<span class="o">=</span>trace <span class="se">\</span>
<span class="nt">-jar</span> first-application/target/first-application-0.0.1-SNAPSHOT.jar 

java <span class="nt">-Xms1G</span> <span class="nt">-Xmx1G</span> <span class="nt">-XX</span>:+AlwaysPreTouch <span class="se">\</span>
<span class="nt">-jar</span> second-application/target/second-application-0.0.1-SNAPSHOT.jar

java <span class="nt">-Xms1G</span> <span class="nt">-Xmx1G</span> <span class="nt">-XX</span>:+AlwaysPreTouch <span class="se">\</span>
<span class="nt">-jar</span> third-application/target/third-application-0.0.1-SNAPSHOT.jar
</code></pre></div></div>

<p>I’m using Corretto 17.0.2:</p>

<div class="language-shell highlighter-rouge"><div class="highlight"><pre class="highlight"><code><span class="nv">$ </span>java <span class="nt">-version</span>

openjdk version <span class="s2">"17.0.2"</span> 2022-01-18 LTS
OpenJDK Runtime Environment Corretto-17.0.2.8.1 <span class="o">(</span>build 17.0.2+8-LTS<span class="o">)</span>
OpenJDK 64-Bit Server VM Corretto-17.0.2.8.1 <span class="o">(</span>build 17.0.2+8-LTS, mixed mode, sharing<span class="o">)</span>
</code></pre></div></div>

<p>And to create simple load tests, I’m using an ancient tool:</p>

<div class="language-shell highlighter-rouge"><div class="highlight"><pre class="highlight"><code><span class="nv">$ </span>ab <span class="nt">-V</span>

This is ApacheBench, Version 2.3 &lt;<span class="nv">$Revision</span>: 1879490 <span class="nv">$&gt;</span>
Copyright 1996 Adam Twiss, Zeus Technology Ltd, http://www.zeustech.net/
Licensed to The Apache Software Foundation, http://www.apache.org/
</code></pre></div></div>

<p>I will not go through the source code to explain all the details before I jump into examples.
I often profile applications with source code I haven’t 
seen in my work. Just consider it as a typical micro-service build with Spring Boot and Hibernate.</p>

<p>In all the examples, I will assume that the application is started with the <code class="language-plaintext highlighter-rouge">java -jar</code> command.
If you are running the application from the IDE, then the name of the application is switched 
from <code class="language-plaintext highlighter-rouge">first-application-0.0.1-SNAPSHOT.jar</code> to <code class="language-plaintext highlighter-rouge">FirstApplication</code>.</p>

<p>All the JFRs generated while writing that post are available
<a href="https://github.com/krzysztofslusarski/async-profiler-demos/tree/master/jfrs" target="_blank">here</a>.</p>

<h2 id="how-to">How to run an Async-profiler</h2>

<h3 id="how-to-cl">Command line</h3>

<p>One of the easiest ways of running the async-profiler is using the command line. You just need to execute the following
in the profiler folder:</p>

<div class="language-shell highlighter-rouge"><div class="highlight"><pre class="highlight"><code>./profiler.sh <span class="nt">-e</span> &lt;event <span class="nb">type</span><span class="o">&gt;</span> <span class="nt">-d</span> &lt;duration <span class="k">in </span>seconds&gt; <span class="se">\</span>
<span class="nt">-f</span> &lt;output file name&gt; &lt;pid or application name&gt;

<span class="c"># examples</span>
./profiler.sh <span class="nt">-e</span> cpu <span class="nt">-d</span> 10 <span class="nt">-f</span> prof.jfr first-application-0.0.1-SNAPSHOT.jar
./profiler.sh <span class="nt">-e</span> wall <span class="nt">-d</span> 10 <span class="nt">-f</span> prof.html 1234 <span class="c"># where 1234 is the PID of the Java process</span>
</code></pre></div></div>

<p>There are a lot of additional switches that are explained in the <a href="https://github.com/jvm-profiling-tools/async-profiler#readme" target="_blank">README</a>.</p>

<p>You can also use async-profiler to output JFR files:</p>

<div class="language-shell highlighter-rouge"><div class="highlight"><pre class="highlight"><code>./profiler.sh start <span class="nt">-e</span> &lt;event <span class="nb">type</span><span class="o">&gt;</span> <span class="nt">-f</span> &lt;output JFR file name&gt; &lt;pid or application name&gt;
<span class="c"># do something</span>
./profiler.sh stop <span class="nt">-f</span> &lt;output JFR file name&gt; &lt;pid or application name&gt;
</code></pre></div></div>

<p>For formats different from JFR, you need to pass the file name during <code class="language-plaintext highlighter-rouge">stop</code>, but for JFR 
it is needed during <code class="language-plaintext highlighter-rouge">start</code>.</p>

<p>The <code class="language-plaintext highlighter-rouge">profiler.sh</code> script was removed in the <strong>3.0</strong> release, now we need to use <code class="language-plaintext highlighter-rouge">asprof</code> executable.</p>

<p><strong>WARNING</strong>: This way of attaching any profiler to a JVM is vulnerable to
<a href="https://bugs.openjdk.org/browse/JDK-8212155" target="_blank">JDK-8212155</a>. That issue can crash 
your JVM during attachment. It has been fixed in JDK 17.</p>

<p>If you are attaching a profiler this way, it is recommended to use <code class="language-plaintext highlighter-rouge">-XX:+UnlockDiagnosticVMOptions -XX:+DebugNonSafepoints</code>
JVM flags (see <a href="https://jpbempel.github.io/2022/06/22/debug-non-safepoints.html" target="_blank">this blog post by Jean-Philippe Bempel</a> for more information on why these flags are essential).</p>

<h3 id="how-to-jvm">During JVM startup</h3>

<p>You can add a parameter when you are starting a <code class="language-plaintext highlighter-rouge">java</code> process:</p>

<div class="language-shell highlighter-rouge"><div class="highlight"><pre class="highlight"><code>java <span class="nt">-agentpath</span>:/path/to/libasyncProfiler.so<span class="o">=</span>start,event<span class="o">=</span>cpu,file<span class="o">=</span>prof.jfr
</code></pre></div></div>

<p>The parameters passed this way differ from the switches used in the command line approach.
You can find the list of parameters in the
<a href="https://github.com/jvm-profiling-tools/async-profiler/blob/v2.9/src/arguments.cpp#L52" target="_blank">arguments.cpp</a>
file and the mapping between those in the
<a href="https://github.com/jvm-profiling-tools/async-profiler/blob/master/profiler.sh#L149" target="_blank">profiler.sh</a> file in the
source code.</p>

<p>You can also attach a profiler without starting it using <code class="language-plaintext highlighter-rouge">-agentpath</code>, which is the safest way of starting your JVM
if you want to profile it anytime soon.</p>

<h3 id="how-to-java">From Java API</h3>

<p>The Java API is published to maven central. All you need to do is to include a dependency:</p>

<div class="language-xml highlighter-rouge"><div class="highlight"><pre class="highlight"><code><span class="nt">&lt;dependency&gt;</span>
  <span class="nt">&lt;groupId&gt;</span>tools.profiler<span class="nt">&lt;/groupId&gt;</span>
  <span class="nt">&lt;artifactId&gt;</span>async-profiler<span class="nt">&lt;/artifactId&gt;</span>
  <span class="nt">&lt;version&gt;</span>2.9<span class="nt">&lt;/version&gt;</span>
<span class="nt">&lt;/dependency&gt;</span>
</code></pre></div></div>

<p>That gives you an API where you can use Async-profiler from Java code. Example usage:</p>

<div class="language-java highlighter-rouge"><div class="highlight"><pre class="highlight"><code><span class="nc">AsyncProfiler</span> <span class="n">profiler</span> <span class="o">=</span> <span class="nc">AsyncProfiler</span><span class="o">.</span><span class="na">getInstance</span><span class="o">();</span> 
</code></pre></div></div>

<p>That gives you an instance of <code class="language-plaintext highlighter-rouge">AsyncProfiler</code> object, with which you can send orders to the profiler:</p>

<div class="language-java highlighter-rouge"><div class="highlight"><pre class="highlight"><code><span class="n">profiler</span><span class="o">.</span><span class="na">execute</span><span class="o">(</span><span class="nc">String</span><span class="o">.</span><span class="na">format</span><span class="o">(</span><span class="s">"start,jfr,event=wall,file=%s.jfr"</span><span class="o">,</span> <span class="n">fileName</span><span class="o">));</span>
<span class="c1">// do something, like sleep</span>
<span class="n">profiler</span><span class="o">.</span><span class="na">execute</span><span class="o">(</span><span class="nc">String</span><span class="o">.</span><span class="na">format</span><span class="o">(</span><span class="s">"stop,file=%s.jfr"</span><span class="o">,</span> <span class="n">fileName</span><span class="o">));</span>
</code></pre></div></div>

<p>Since async-profiler 2.9, the <code class="language-plaintext highlighter-rouge">AsyncProfiler.getInstance()</code> extracts and loads the <code class="language-plaintext highlighter-rouge">libasyncProfiler.so</code> from the JAR.
In the previous version, this file needed to be in one of the following directories:</p>

<ul>
  <li><code class="language-plaintext highlighter-rouge">/usr/java/packages/lib</code></li>
  <li><code class="language-plaintext highlighter-rouge">/usr/lib64</code></li>
  <li><code class="language-plaintext highlighter-rouge">/lib64</code></li>
  <li><code class="language-plaintext highlighter-rouge">/lib</code></li>
  <li><code class="language-plaintext highlighter-rouge">/usr/lib</code></li>
</ul>

<p>You can also point to any location of that file with API:</p>

<div class="language-java highlighter-rouge"><div class="highlight"><pre class="highlight"><code><span class="nc">AsyncProfiler</span> <span class="n">profiler</span> <span class="o">=</span> <span class="nc">AsyncProfiler</span><span class="o">.</span><span class="na">getInstance</span><span class="o">(</span><span class="s">"/path/to/libasyncProfiler.so"</span><span class="o">);</span>
</code></pre></div></div>

<h3 id="how-to-jmh">From JMH benchmark</h3>

<p>It’s worth mentioning that the async-profiler is supported in JMH benchmarks. If you have one, you just need to run the following:</p>

<div class="language-shell highlighter-rouge"><div class="highlight"><pre class="highlight"><code>java <span class="nt">-jar</span> benchmarks.jar <span class="nt">-prof</span> async:libPath<span class="o">=</span>/path/to/libasyncProfiler.so<span class="se">\;</span><span class="nv">output</span><span class="o">=</span>jfr<span class="se">\;</span><span class="nv">event</span><span class="o">=</span>cpu
</code></pre></div></div>

<p>JMH will take care of every magic, and you get proper JFR files from async-profiler.</p>

<h3 id="how-to-apl">AP-Loader</h3>

<p>There is a pretty new project called <a href="https://github.com/jvm-profiling-tools/ap-loader" target="_blank">AP-Loader</a> by Johannes Bechberger
that can also be helpful to you. This project packages all native distributions into a single JAR, so
It is convenient when deploying on different CPU architectures. You can also use
the Java API with this loader without caring where the binary of the profiler is located and which platform you’re running on. I recommend reading
the <a href="https://github.com/jvm-profiling-tools/ap-loader#readme" target="_blank">README</a> of that project. It may be suitable for you.</p>

<h3 id="how-to-idea">IntelliJ Idea Ultimate</h3>

<p>If you are using IntelliJ Idea Ultimate, you have a built-in async-profiler at your fingertips. You can profile any JVM running on your machine and visualize the results. Honestly, I don’t use it that
much. Most of the time, I run profilers on remote machines, and I’ve got used to it, so I 
run it the same way on my localhost.</p>

<h2 id="out">Output formats</h2>

<p>Async-profiler gives you a choice of how the results should be saved:</p>
<ul>
  <li>default - printing results to the terminal</li>
  <li>JFR</li>
  <li>Collapsed stack</li>
  <li>Flame graphs</li>
  <li>…</li>
</ul>

<p>From that list, I choose JFR 95% of the time. It’s a binary format containing all the information gathered by the profiler. That file can be post-processed later by some external tool. I’m using my
own open-sourced <a href="https://github.com/krzysztofslusarski/jvm-profiling-toolkit" target="_blank">JVM profiling toolkit</a>, 
which can read JFR files with additional filters and gives me the possibility to add/remove additional
levels during the conversion to a flame graph. I will use the filter names of my viewer in the following and the names of filters from my viewer.
There are other products (including the <code class="language-plaintext highlighter-rouge">jfr2flame</code> converter that is a part of async-profiler) 
that can visualize the JFR output, but you should use the tool that works
for you. None worked for me, so I wrote my own, but it doesn’t mean it is the best choice for everybody.</p>

<p>All flame graphs in this post are generated by my tool from JFR files. The JFR file format for each sample contains the following:</p>

<ul>
  <li>Stack trace</li>
  <li>Java thread name</li>
  <li>Thread state (is the Java thread consumes CPU)</li>
  <li>Timestamp</li>
  <li>Monitor class - for <code class="language-plaintext highlighter-rouge">lock</code> mode</li>
  <li>Waiting for lock duration - for <code class="language-plaintext highlighter-rouge">lock</code> mode</li>
  <li>Allocated object class - for <code class="language-plaintext highlighter-rouge">alloc</code> mode</li>
  <li>Allocated object size - for <code class="language-plaintext highlighter-rouge">alloc</code> mode</li>
  <li>Context ID - if you are using async-profiler with
<a href="https://github.com/jvm-profiling-tools/async-profiler/pull/576" target="_blank">Context ID PR</a> merged</li>
</ul>

<p>So all the information is already there. We just need to extract what we need and present it visually.</p>

<h2 id="flames">Flame graphs</h2>

<p>If you do <strong>sampling profiling</strong> you need to visualize the results. The results are nothing more than a <strong>set of stack traces</strong>.
My favorite visualization is a <strong>flame graph</strong>. The easiest way to understand what flame graphs are is to know how
they are created.</p>

<p>First, we draw a rectangle for each frame of each stack trace. The stack traces are drawn bottom-up and sorted
alphabetically. For example, such a graph looks like this:</p>

<p><img src="/assets/hz-sql/flame-1.png" alt="alt text" title="flame" /></p>

<p>This corresponds to the following set of stack traces:</p>

<ul>
  <li>3 samples - <code class="language-plaintext highlighter-rouge">a() -&gt; h()</code></li>
  <li>5 samples - <code class="language-plaintext highlighter-rouge">b() -&gt; d() -&gt; e() -&gt; f()</code></li>
  <li>2 samples - <code class="language-plaintext highlighter-rouge">b() -&gt; d() -&gt; e() -&gt; g()</code></li>
  <li>2 samples - <code class="language-plaintext highlighter-rouge">b() -&gt; d()</code></li>
  <li>2 samples - <code class="language-plaintext highlighter-rouge">c()</code></li>
</ul>

<p>The next step is <strong>joining</strong> the rectangles with the same method name to one bar:</p>

<p><img src="/assets/hz-sql/flame-2.png" alt="alt text" title="flame" /></p>

<p>The flame graph usually shows you how your application utilizes a specific resource. The resource is utilized
<strong>by the top methods</strong> of that graph (visualized with green bar):</p>

<p><img src="/assets/hz-sql/flame-3.png" alt="flame graph with the top methods highlighted" title="flame" /></p>

<p>So in this example, method <code class="language-plaintext highlighter-rouge">b()</code> does not utilize the resource. It just invokes methods that transitively use it. Flame graphs
are commonly used for the <strong>CPU utilization</strong>, but the CPU is just one of the resources we can visualize this way.
If you use <strong>wall-clock mode</strong>, your resource is <strong>time</strong>. If you use <strong>allocation mode</strong>, then your resource is
<strong>heap</strong>. If you want to learn more about flame graphs, you can check 
<a href="https://www.youtube.com/watch?v=D53T1Ejig1Q" target="_blank">Brendan’s Gregg video</a>, he invented flame graphs.</p>

<h2 id="basic-resources">Basic resources profiling</h2>

<p>Before you start any profiler, the first thing you need to know is what your goal is. Only after that
can you choose the proper mode of async-profiler. Let’s start with the basics.</p>

<h3 id="wall">Wall-clock</h3>

<p>If your goal is to optimize time, you should run the async-profiler in wall-clock mode. This is the 
most common mistake made by engineers starting their journey with profilers. The majority of
applications that I profiled so far were applications that were working with a distributed
architecture, using some DBs, MQ, Kafka, … In such applications, the majority of time is spent on
IO - waiting for other services/DB/… to respond. During such actions, Java is not using the CPU.</p>

<div class="language-shell highlighter-rouge"><div class="highlight"><pre class="highlight"><code><span class="c"># warmup</span>
ab <span class="nt">-n</span> 100 <span class="nt">-c</span> 4 http://localhost:8081/examples/wall/first
ab <span class="nt">-n</span> 100 <span class="nt">-c</span> 4 http://localhost:8081/examples/wall/second

<span class="c"># profiling of the first request</span>
./profiler.sh start <span class="nt">-e</span> cpu <span class="nt">-f</span> first-cpu.jfr first-application-0.0.1-SNAPSHOT.jar
ab <span class="nt">-n</span> 100 <span class="nt">-c</span> 4 http://localhost:8081/examples/wall/first
./profiler.sh stop <span class="nt">-f</span> first-cpu.jfr first-application-0.0.1-SNAPSHOT.jar

./profiler.sh start <span class="nt">-e</span> wall <span class="nt">-f</span> first-wall.jfr first-application-0.0.1-SNAPSHOT.jar
ab <span class="nt">-n</span> 100 <span class="nt">-c</span> 4 http://localhost:8081/examples/wall/first
./profiler.sh stop <span class="nt">-f</span> first-wall.jfr first-application-0.0.1-SNAPSHOT.jar

<span class="c"># profiling of the second request</span>
./profiler.sh start <span class="nt">-e</span> cpu <span class="nt">-f</span> second-cpu.jfr first-application-0.0.1-SNAPSHOT.jar
ab <span class="nt">-n</span> 100 <span class="nt">-c</span> 4 http://localhost:8081/examples/wall/second
./profiler.sh stop <span class="nt">-f</span> second-cpu.jfr first-application-0.0.1-SNAPSHOT.jar

./profiler.sh start <span class="nt">-e</span> wall <span class="nt">-f</span> second-wall.jfr first-application-0.0.1-SNAPSHOT.jar
ab <span class="nt">-n</span> 100 <span class="nt">-c</span> 4 http://localhost:8081/examples/wall/second
./profiler.sh stop <span class="nt">-f</span> second-wall.jfr first-application-0.0.1-SNAPSHOT.jar
</code></pre></div></div>

<p>In the <code class="language-plaintext highlighter-rouge">ab</code> output, we can see that the basic stats are similar for each request:</p>

<div class="language-shell highlighter-rouge"><div class="highlight"><pre class="highlight"><code><span class="c"># first request</span>
Connection Times <span class="o">(</span>ms<span class="o">)</span>
              min  mean[+/-sd] median   max
Connect:        0    0   0.1      0       0
Processing:   521  654 217.9    528    1055
Waiting:      521  654 217.9    528    1054
Total:        521  654 217.9    528    1055

<span class="c"># second request</span>
Connection Times <span class="o">(</span>ms<span class="o">)</span>
              min  mean[+/-sd] median   max
Connect:        0    0   0.1      0       1
Processing:   522  665 190.2    548    1028
Waiting:      522  665 190.1    548    1028
Total:        522  665 190.2    549    1029
</code></pre></div></div>

<p>To give you a taste of how the CPU profile can mislead you, here are flame graphs for those two
executions in CPU mode.</p>

<p><strong>First execution:</strong> (<a href="/assets/async-demos/wall-cpu-first.html" target="_blank">HTML</a>)
<img src="/assets/async-demos/wall-cpu-first.png" alt="alt text" title="flames" /></p>

<p><strong>Second execution:</strong> (<a href="/assets/async-demos/wall-cpu-second.html" target="_blank">HTML</a>)
<img src="/assets/async-demos/wall-cpu-second.png" alt="alt text" title="flames" /></p>

<p>I agree that they are not identical. But they have one thing in common.
They show that the most CPU-consuming method invoked by my controller is <code class="language-plaintext highlighter-rouge">CpuConsumer.mathConsumer()</code>.
It is not a lie: It consumes CPU. But does it consume most of the time of the request? 
Look at the flame graphs in wall-clock mode:</p>

<p><strong>First execution:</strong> (<a href="/assets/async-demos/wall-wall-first.html" target="_blank">HTML</a>)
<img src="/assets/async-demos/wall-wall-first.png" alt="alt text" title="flames" /></p>

<p><strong>Second execution:</strong> (<a href="/assets/async-demos/wall-wall-second.html" target="_blank">HTML</a>)
<img src="/assets/async-demos/wall-wall-second.png" alt="alt text" title="flames" /></p>

<p>I highlighted the ```CpuConsumer.mathConsumer()`` method. Wall-clock 
mode shows us that this method is responsible just for <strong>~4%</strong> of execution time.</p>

<p><strong>Thing to remember</strong>: if your goal is to optimize time, and you use external
systems (including DBs, queues, topics, microservices) or locks, sleeps, disk IO, 
It would help if you started with wall-clock mode.</p>

<p>In wall-clock mode, we can also see that these flame graphs differ. The first 
execution spends most of its time in <code class="language-plaintext highlighter-rouge">SocketInputStream.read()</code>:</p>

<p><img src="/assets/async-demos/wall-wall-first-2.png" alt="alt text" title="flames" /></p>

<p>Over <strong>95%</strong> of the time is consumed there. But the second execution:</p>

<p><img src="/assets/async-demos/wall-wall-second-2.png" alt="alt text" title="flames" /></p>

<p>spends just <strong>75%</strong> on the socket. To the right of the method
<code class="language-plaintext highlighter-rouge">SocketInputStream.read()</code> you can spot an additional bar. Let’s zoom in:</p>

<p><img src="/assets/async-demos/wall-wall-second-3.png" alt="alt text" title="flames" /></p>

<p>It’s the <code class="language-plaintext highlighter-rouge">InternalExecRuntime.acquireEndpoint()</code> method, which executes
<code class="language-plaintext highlighter-rouge">PoolingHttpClientConnectionManager$1.get()</code> from Apache HTTP Client, which 
in the end executes <code class="language-plaintext highlighter-rouge">Object.wait()</code>. What does it do? Basically, what we are trying
to do in those two executions is to invoke a remote REST service. The first execution
uses an HTTP Client instance with <code class="language-plaintext highlighter-rouge">20</code> available connections, so no thread
needs to wait for a connection from the pool:</p>

<div class="language-java highlighter-rouge"><div class="highlight"><pre class="highlight"><code><span class="c1">// FirstApplicationConfiguration</span>
<span class="nd">@Bean</span><span class="o">(</span><span class="s">"pool20RestTemplate"</span><span class="o">)</span>
<span class="nc">RestTemplate</span> <span class="nf">pool20RestTemplate</span><span class="o">()</span> <span class="o">{</span>
    <span class="k">return</span> <span class="nf">createRestTemplate</span><span class="o">(</span><span class="mi">20</span><span class="o">);</span>
<span class="o">}</span>
</code></pre></div></div>

<div class="language-java highlighter-rouge"><div class="highlight"><pre class="highlight"><code><span class="c1">// WallService</span>
<span class="kt">void</span> <span class="nf">calculateAndExecuteSlow</span><span class="o">()</span> <span class="o">{</span>
    <span class="nc">Random</span> <span class="n">random</span> <span class="o">=</span> <span class="nc">ThreadLocalRandom</span><span class="o">.</span><span class="na">current</span><span class="o">();</span>
    <span class="nc">CpuConsumer</span><span class="o">.</span><span class="na">mathConsumer</span><span class="o">(</span><span class="n">random</span><span class="o">.</span><span class="na">nextDouble</span><span class="o">(),</span> <span class="no">CPU_MATH_ITERATIONS</span><span class="o">);</span>

    <span class="n">invokeWithLogTime</span><span class="o">(()</span> <span class="o">-&gt;</span>
        <span class="n">pool20RestTemplate</span><span class="o">.</span><span class="na">getForObject</span><span class="o">(</span><span class="no">SECOND_APPLICATION_URL</span> <span class="o">+</span> 
            <span class="s">"/examples/wall/slow"</span><span class="o">,</span> <span class="nc">String</span><span class="o">.</span><span class="na">class</span><span class="o">)</span>
    <span class="o">);</span>
<span class="o">}</span> 
</code></pre></div></div>

<p>The time spent on a socket is entirely spent waiting for the REST endpoint to respond.
The second execution uses a different instance of <code class="language-plaintext highlighter-rouge">RestTemplate</code> that has just 
<strong>3</strong> connections in the pool. Since the load is generated from <strong>4</strong> threads
by the <code class="language-plaintext highlighter-rouge">ab</code>, one thread must wait for a connection from the pool.
You may think this is a stupid human error, that someone created a pool without enough
connections. In the real world, the problem is with defaults that
are quite low. In our testing application, the default settings for the thread pool are:</p>

<ul>
  <li><code class="language-plaintext highlighter-rouge">maxTotal</code> - <strong>25</strong> connections totally in the pool</li>
  <li><code class="language-plaintext highlighter-rouge">defaultMaxPerRoute</code> - <strong>5</strong> connections to the same address</li>
</ul>

<p>That number varies between versions. I remember one application with HTTP Client 4.x
with defaults set to <strong>2</strong>.</p>

<p>There are plenty of tools that log the invocation time of external services. The common
problem in those tools is that the time waiting on the pool for a connection is usually
included in the invocation time, which is a lie. I saw this in the past when the caller 
had a line in the logs that gave an execution time of <code class="language-plaintext highlighter-rouge">X ms</code>; the callee had a similar log
that presented <code class="language-plaintext highlighter-rouge">1/10 * X ms</code>. What were those teams doing to understand that? They
tried to convince the network department that this was a network issue. Big waste of time.</p>

<p>I also saw plenty of custom logic that traced external execution time. In our application
you can see such a pattern:</p>

<div class="language-java highlighter-rouge"><div class="highlight"><pre class="highlight"><code><span class="kt">void</span> <span class="nf">calculateAndExecuteFast</span><span class="o">()</span> <span class="o">{</span>
    <span class="c1">// ...</span>
    <span class="n">invokeWithLogTime</span><span class="o">(()</span> <span class="o">-&gt;</span>
            <span class="n">pool3RestTemplate</span><span class="o">.</span><span class="na">getForObject</span><span class="o">(</span><span class="no">SECOND_APPLICATION_URL</span> <span class="o">+</span> <span class="s">"/examples/wall/fast"</span><span class="o">,</span> <span class="nc">String</span><span class="o">.</span><span class="na">class</span><span class="o">)</span>
    <span class="o">);</span>
<span class="o">}</span>

<span class="kd">private</span> <span class="o">&lt;</span><span class="no">T</span><span class="o">&gt;</span> <span class="no">T</span> <span class="nf">invokeWithLogTime</span><span class="o">(</span><span class="nc">Supplier</span><span class="o">&lt;</span><span class="no">T</span><span class="o">&gt;</span> <span class="n">toInvoke</span><span class="o">)</span> <span class="o">{</span>
    <span class="nc">StopWatch</span> <span class="n">stopWatch</span> <span class="o">=</span> <span class="k">new</span> <span class="nc">StopWatch</span><span class="o">();</span>

    <span class="n">stopWatch</span><span class="o">.</span><span class="na">start</span><span class="o">();</span>
    <span class="no">T</span> <span class="n">ret</span> <span class="o">=</span> <span class="n">toInvoke</span><span class="o">.</span><span class="na">get</span><span class="o">();</span>
    <span class="n">stopWatch</span><span class="o">.</span><span class="na">stop</span><span class="o">();</span>

    <span class="n">log</span><span class="o">.</span><span class="na">info</span><span class="o">(</span><span class="s">"External WS invoked in: {}ms"</span><span class="o">,</span> <span class="n">stopWatch</span><span class="o">.</span><span class="na">getTotalTimeMillis</span><span class="o">());</span>
    <span class="k">return</span> <span class="n">ret</span><span class="o">;</span>
<span class="o">}</span>
</code></pre></div></div>

<p>The logs don’t trace the time using an external service; the time also includes all the magic done by
Spring, including waiting for a connection from the pool. You can easily see that for the second request,
the logs look like this:</p>

<div class="language-plaintext highlighter-rouge"><div class="highlight"><pre class="highlight"><code>External WS invoked in: 937ms
</code></pre></div></div>

<p>But the second service that is invoked is:</p>

<div class="language-java highlighter-rouge"><div class="highlight"><pre class="highlight"><code>    <span class="nd">@GetMapping</span><span class="o">(</span><span class="s">"/fast"</span><span class="o">)</span>
    <span class="nc">String</span> <span class="nf">fast</span><span class="o">()</span> <span class="kd">throws</span> <span class="nc">InterruptedException</span> <span class="o">{</span>
        <span class="nc">Thread</span><span class="o">.</span><span class="na">sleep</span><span class="o">(</span><span class="mi">500</span><span class="o">);</span>
        <span class="k">return</span> <span class="s">"OK"</span><span class="o">;</span>
    <span class="o">}</span>
</code></pre></div></div>

<h3 id="wall-filter">Wall-clock - filtering</h3>

<p>If you open the wall-clock flame graph for the first time, you may be confused, since
it usually looks like this:</p>

<p><img src="/assets/async-demos/wall-filter.png" alt="alt text" title="flames" /></p>

<p>You see all the threads, even if they are sleeping or waiting in some queue for a job.
Wall-clock shows you all of them.  Most of the time, you want to focus on the frames where
your application is doing something, not when it is waiting. 
All you need to do is to filter the stack traces. If you are using Spring Boot 
with the embedded Tomcat, you can filter
stack traces that contain the <code class="language-plaintext highlighter-rouge">SocketProcessorBase.run</code> method. 
In my viewer, you can just paste it to <em>stack trace filter</em>, and you are done. 
It’s just a matter of proper filtering if you want to focus on one controller, class, method, etc.</p>

<h3 id="cpu-easy">CPU - easy-peasy</h3>

<p>If you know that your application is CPU intensive, or you want to decrease CPU consumption, 
then the CPU mode is suitable.</p>

<p>Let’s prepare our application:</p>

<div class="language-shell highlighter-rouge"><div class="highlight"><pre class="highlight"><code><span class="c"># execute it once</span>
curl <span class="nt">-v</span> http://localhost:8081/examples/cpu/prepare

<span class="c"># little warmup</span>
ab <span class="nt">-n</span> 5 <span class="nt">-c</span> 1 http://localhost:8081/examples/cpu/inverse

<span class="c"># profiling time:</span>
./profiler.sh start <span class="nt">-e</span> cpu <span class="nt">-f</span> cpu.jfr first-application-0.0.1-SNAPSHOT.jar
ab <span class="nt">-n</span> 5 <span class="nt">-c</span> 1 http://localhost:8081/examples/cpu/inverse
./profiler.sh stop <span class="nt">-f</span> cpu.jfr first-application-0.0.1-SNAPSHOT.jar
</code></pre></div></div>

<p>You can check during the benchmark what the CPU utilization of our JVM is:</p>

<div class="language-shell highlighter-rouge"><div class="highlight"><pre class="highlight"><code><span class="nv">$ </span>pidstat <span class="nt">-p</span> <span class="sb">`</span>pgrep <span class="nt">-f</span> first-application-0.0.1-SNAPSHOT.jar<span class="sb">`</span> 5
 
09:42:49      UID       PID    %usr %system  %guest   %wait    %CPU   CPU  Command
09:42:54     1000     49813  115,40    0,40    0,00    0,00  115,80     1  java
09:42:59     1000     49813  111,40    0,60    0,00    0,00  112,00     1  java
09:43:04     1000     49813  106,80    0,20    0,00    0,00  107,00     1  java
09:43:09     1000     49813  113,00    0,20    0,00    0,00  113,20     1  java 
</code></pre></div></div>

<p>We are using a bit more than one CPU core. Our load generator creates the load with a single
thread so that the CPU usage is pretty high. Let’s see what our CPU is doing while executing our
spring controller: (<a href="/assets/async-demos/cpu.html" target="_blank">HTML</a>)</p>

<p><img src="/assets/async-demos/cpu.png" alt="alt text" title="flames" /></p>

<p>I know that flame graph is pretty large, but hey, welcome to Spring and Hibernate.
I highlighted the <code class="language-plaintext highlighter-rouge">existsById()</code> method. You can see that it consumes <strong>95%</strong> of the
CPU time. But why? It doesn’t look scary at all when looking at the code:</p>

<div class="language-java highlighter-rouge"><div class="highlight"><pre class="highlight"><code><span class="nd">@Transactional</span>
<span class="kd">public</span> <span class="kt">void</span> <span class="nf">inverse</span><span class="o">(</span><span class="no">UUID</span> <span class="n">uuid</span><span class="o">)</span> <span class="o">{</span>
    <span class="n">sampleEntityRepository</span><span class="o">.</span><span class="na">findById</span><span class="o">(</span><span class="n">uuid</span><span class="o">).</span><span class="na">ifPresent</span><span class="o">(</span><span class="n">sampleEntity</span> <span class="o">-&gt;</span> <span class="o">{</span>
        <span class="kt">boolean</span> <span class="n">allConfigPresent</span> <span class="o">=</span> <span class="kc">true</span><span class="o">;</span>
        <span class="k">for</span> <span class="o">(</span><span class="kt">int</span> <span class="n">i</span> <span class="o">=</span> <span class="mi">0</span><span class="o">;</span> <span class="n">i</span> <span class="o">&lt;</span> <span class="mi">100</span><span class="o">;</span> <span class="n">i</span><span class="o">++)</span> <span class="o">{</span>
            <span class="n">allConfigPresent</span> <span class="o">=</span> <span class="n">allConfigPresent</span> <span class="o">&amp;&amp;</span> <span class="n">sampleConfigurationRepository</span><span class="o">.</span><span class="na">existsById</span><span class="o">(</span><span class="s">"key-"</span> <span class="o">+</span> <span class="n">i</span><span class="o">);</span>
        <span class="o">}</span>
        <span class="n">sampleEntity</span><span class="o">.</span><span class="na">setFlag</span><span class="o">(!</span><span class="n">sampleEntity</span><span class="o">.</span><span class="na">isFlag</span><span class="o">());</span>
    <span class="o">});</span>
<span class="o">}</span>
</code></pre></div></div>

<p>We are just executing <code class="language-plaintext highlighter-rouge">existsById()</code> on the Spring Data JPA repository. The answer 
why that method is slow is at the beginning of the method:</p>

<div class="language-java highlighter-rouge"><div class="highlight"><pre class="highlight"><code><span class="n">sampleEntityRepository</span><span class="o">.</span><span class="na">findById</span><span class="o">(</span><span class="n">uuid</span><span class="o">)</span>
</code></pre></div></div>

<p>and in JPA mapping:</p>

<div class="language-java highlighter-rouge"><div class="highlight"><pre class="highlight"><code><span class="kd">public</span> <span class="kd">class</span> <span class="nc">SampleEntity</span> <span class="o">{</span>
    <span class="nd">@Id</span>
    <span class="kd">private</span> <span class="no">UUID</span> <span class="n">id</span><span class="o">;</span>

    <span class="nd">@Fetch</span><span class="o">(</span><span class="nc">FetchMode</span><span class="o">.</span><span class="na">JOIN</span><span class="o">)</span>
    <span class="nd">@JoinColumn</span><span class="o">(</span><span class="n">name</span> <span class="o">=</span> <span class="s">"fk_entity"</span><span class="o">)</span>
    <span class="nd">@OneToMany</span><span class="o">(</span><span class="n">cascade</span> <span class="o">=</span> <span class="nc">CascadeType</span><span class="o">.</span><span class="na">ALL</span><span class="o">,</span> <span class="n">fetch</span> <span class="o">=</span> <span class="nc">FetchType</span><span class="o">.</span><span class="na">EAGER</span><span class="o">,</span> <span class="n">orphanRemoval</span> <span class="o">=</span> <span class="kc">true</span><span class="o">)</span>
    <span class="kd">private</span> <span class="nc">Set</span><span class="o">&lt;</span><span class="nc">SampleSubEntity</span><span class="o">&gt;</span> <span class="n">subEntities</span><span class="o">;</span>

    <span class="kd">private</span> <span class="kt">boolean</span> <span class="n">flag</span><span class="o">;</span>
<span class="o">}</span>
</code></pre></div></div>

<p>This means that when we get one <code class="language-plaintext highlighter-rouge">SampleEntity</code> by id, we also extract the <code class="language-plaintext highlighter-rouge">subEntities</code> from the database because of <code class="language-plaintext highlighter-rouge">fetch = FetchType.EAGER</code>.
This is not a problem yet. All JPA entities are loaded into the Hibernate session.
That mechanism is pretty cool because it gives you the <em>dirty checking</em> functionality.
The downside, however, is that the <em>dirty</em> entities need to be flushed by Hibernate 
to DB. You have different flush strategies in Hibernate. The default one is <code class="language-plaintext highlighter-rouge">AUTO</code>:
you can read about them in the
<a href="https://javadoc.io/doc/org.hibernate/hibernate-core/5.6.14.Final/org/hibernate/FlushMode.html" target="_blank">Javadocs</a>.
What you see in the flame graph is exactly Hibernate looking for dirty entities that
should be flushed.</p>

<p>What can we do about this? Well, first of all, it should be forbidden to develop
a large Hibernate application without reading 
<a href="https://vladmihalcea.com/books/high-performance-java-persistence/" target="_blank">Vlad Mihalcea’s book</a>.
If you are developing such an application, buy that book, it’s great. From my experience, 
some engineers tend to abuse Hibernate. Let’s look at the code sample I pasted 
before. We are loading a huge <code class="language-plaintext highlighter-rouge">SampleEntity</code>. What are we doing with it?</p>

<div class="language-java highlighter-rouge"><div class="highlight"><pre class="highlight"><code><span class="nd">@Transactional</span>
<span class="kd">public</span> <span class="kt">void</span> <span class="nf">inverse</span><span class="o">(</span><span class="no">UUID</span> <span class="n">uuid</span><span class="o">)</span> <span class="o">{</span>
    <span class="n">sampleEntityRepository</span><span class="o">.</span><span class="na">findById</span><span class="o">(</span><span class="n">uuid</span><span class="o">).</span><span class="na">ifPresent</span><span class="o">(</span><span class="n">sampleEntity</span> <span class="o">-&gt;</span> <span class="o">{</span>
        <span class="c1">// irrelevant</span>
        <span class="n">sampleEntity</span><span class="o">.</span><span class="na">setFlag</span><span class="o">(!</span><span class="n">sampleEntity</span><span class="o">.</span><span class="na">isFlag</span><span class="o">());</span>
    <span class="o">});</span>
<span class="o">}</span>
</code></pre></div></div>

<p>So we’re basically changing one column in one row in the DB. We can do it more efficiently 
by using the <code class="language-plaintext highlighter-rouge">update</code> query, even with Spring Data JPA repository or simple JDBC.
But do we really need to use Hibernate everywhere?</p>

<h3 id="cpu-hard">CPU - a bit harder</h3>

<p>Sometimes the result of a CPU profiler is just the beginning of the fun. Let’s consider the following example:</p>

<div class="language-shell highlighter-rouge"><div class="highlight"><pre class="highlight"><code><span class="c"># little warmup</span>
ab <span class="nt">-n</span> 10 <span class="nt">-c</span> 1 http://localhost:8081/examples/cpu/matrix-slow

<span class="c"># profiling time</span>
./profiler.sh start <span class="nt">-e</span> cpu <span class="nt">-f</span> matrix-slow.jfr first-application-0.0.1-SNAPSHOT.jar
ab <span class="nt">-n</span> 10 <span class="nt">-c</span> 1 http://localhost:8081/examples/cpu/matrix-slow
./profiler.sh stop <span class="nt">-f</span> matrix-slow.jfr first-application-0.0.1-SNAPSHOT.jar

<span class="c"># little warmup</span>
ab <span class="nt">-n</span> 10 <span class="nt">-c</span> 1 http://localhost:8081/examples/cpu/matrix-fast

<span class="c"># profiling time</span>
./profiler.sh start <span class="nt">-e</span> cpu <span class="nt">-f</span> matrix-fast.jfr first-application-0.0.1-SNAPSHOT.jar
ab <span class="nt">-n</span> 10 <span class="nt">-c</span> 1 http://localhost:8081/examples/cpu/matrix-fast
./profiler.sh stop <span class="nt">-f</span> matrix-fast.jfr first-application-0.0.1-SNAPSHOT.jar
</code></pre></div></div>

<p>Let’s see the run times of the <code class="language-plaintext highlighter-rouge">matrix-slow</code> request:</p>

<div class="language-shell highlighter-rouge"><div class="highlight"><pre class="highlight"><code>              min  mean[+/-sd] median   max
Connect:        0    0   0.0      0       0
Processing:  1601 1795 181.5   1785    2078
Waiting:     1600 1794 181.5   1785    2077
Total:       1601 1795 181.5   1786    2078
</code></pre></div></div>

<p>The profile looks like the following: (<a href="/assets/async-demos/cpu-hard-slow.html" target="_blank">HTML</a>)</p>

<p><img src="/assets/async-demos/cpu-hard-slow.png" alt="alt text" title="flames" /></p>

<p>The whole CPU is wasted in the <code class="language-plaintext highlighter-rouge">matrixMultiplySlow</code> method:</p>

<div class="language-java highlighter-rouge"><div class="highlight"><pre class="highlight"><code><span class="kd">public</span> <span class="kd">static</span> <span class="kt">int</span><span class="o">[][]</span> <span class="nf">matrixMultiplySlow</span><span class="o">(</span><span class="kt">int</span><span class="o">[][]</span> <span class="n">a</span><span class="o">,</span> <span class="kt">int</span><span class="o">[][]</span> <span class="n">b</span><span class="o">,</span> <span class="kt">int</span> <span class="n">size</span><span class="o">)</span> <span class="o">{</span>
    <span class="kt">int</span><span class="o">[][]</span> <span class="n">result</span> <span class="o">=</span> <span class="k">new</span> <span class="kt">int</span><span class="o">[</span><span class="n">size</span><span class="o">][</span><span class="n">size</span><span class="o">];</span>
    <span class="k">for</span> <span class="o">(</span><span class="kt">int</span> <span class="n">i</span> <span class="o">=</span> <span class="mi">0</span><span class="o">;</span> <span class="n">i</span> <span class="o">&lt;</span> <span class="n">size</span><span class="o">;</span> <span class="n">i</span><span class="o">++)</span> <span class="o">{</span>
        <span class="k">for</span> <span class="o">(</span><span class="kt">int</span> <span class="n">j</span> <span class="o">=</span> <span class="mi">0</span><span class="o">;</span> <span class="n">j</span> <span class="o">&lt;</span> <span class="n">size</span><span class="o">;</span> <span class="n">j</span><span class="o">++)</span> <span class="o">{</span>
            <span class="kt">int</span> <span class="n">sum</span> <span class="o">=</span> <span class="mi">0</span><span class="o">;</span>
            <span class="k">for</span> <span class="o">(</span><span class="kt">int</span> <span class="n">k</span> <span class="o">=</span> <span class="mi">0</span><span class="o">;</span> <span class="n">k</span> <span class="o">&lt;</span> <span class="n">size</span><span class="o">;</span> <span class="n">k</span><span class="o">++)</span> <span class="o">{</span>
                <span class="n">sum</span> <span class="o">+=</span> <span class="n">a</span><span class="o">[</span><span class="n">i</span><span class="o">][</span><span class="n">k</span><span class="o">]</span> <span class="o">*</span> <span class="n">b</span><span class="o">[</span><span class="n">k</span><span class="o">][</span><span class="n">j</span><span class="o">];</span>
            <span class="o">}</span>
            <span class="n">result</span><span class="o">[</span><span class="n">i</span><span class="o">][</span><span class="n">j</span><span class="o">]</span> <span class="o">=</span> <span class="n">sum</span><span class="o">;</span>
        <span class="o">}</span>
    <span class="o">}</span>
    <span class="k">return</span> <span class="n">result</span><span class="o">;</span>
<span class="o">}</span>
</code></pre></div></div>

<p>If we look at the run times of the <code class="language-plaintext highlighter-rouge">matrix-fast</code> request:</p>

<div class="language-shell highlighter-rouge"><div class="highlight"><pre class="highlight"><code>              min  mean[+/-sd] median   max
Connect:        0    0   0.0      0       0
Processing:   107  114   6.5    114     128
Waiting:      106  113   6.5    113     128
Total:        107  114   6.5    114     128
</code></pre></div></div>

<p>That request is <strong>18 times faster</strong> than the <code class="language-plaintext highlighter-rouge">matrix-slow</code> request, but if we look at the profile
(<a href="/assets/async-demos/cpu-hard-fast.html" target="_blank">HTML</a>)</p>

<p><img src="/assets/async-demos/cpu-hard-fast.png" alt="alt text" title="flames" /></p>

<p>We see that the whole CPU is wasted in the method <code class="language-plaintext highlighter-rouge">matrixMultiplyFaster</code>:</p>

<div class="language-java highlighter-rouge"><div class="highlight"><pre class="highlight"><code><span class="kd">public</span> <span class="kd">static</span> <span class="kt">int</span><span class="o">[][]</span> <span class="nf">matrixMultiplyFaster</span><span class="o">(</span><span class="kt">int</span><span class="o">[][]</span> <span class="n">a</span><span class="o">,</span> <span class="kt">int</span><span class="o">[][]</span> <span class="n">b</span><span class="o">,</span> <span class="kt">int</span> <span class="n">size</span><span class="o">)</span> <span class="o">{</span>
    <span class="kt">int</span><span class="o">[][]</span> <span class="n">result</span> <span class="o">=</span> <span class="k">new</span> <span class="kt">int</span><span class="o">[</span><span class="n">size</span><span class="o">][</span><span class="n">size</span><span class="o">];</span>
    <span class="k">for</span> <span class="o">(</span><span class="kt">int</span> <span class="n">i</span> <span class="o">=</span> <span class="mi">0</span><span class="o">;</span> <span class="n">i</span> <span class="o">&lt;</span> <span class="n">size</span><span class="o">;</span> <span class="n">i</span><span class="o">++)</span> <span class="o">{</span>
        <span class="k">for</span> <span class="o">(</span><span class="kt">int</span> <span class="n">k</span> <span class="o">=</span> <span class="mi">0</span><span class="o">;</span> <span class="n">k</span> <span class="o">&lt;</span> <span class="n">size</span><span class="o">;</span> <span class="n">k</span><span class="o">++)</span> <span class="o">{</span>
            <span class="kt">int</span> <span class="n">current</span> <span class="o">=</span> <span class="n">a</span><span class="o">[</span><span class="n">i</span><span class="o">][</span><span class="n">k</span><span class="o">];</span>
            <span class="k">for</span> <span class="o">(</span><span class="kt">int</span> <span class="n">j</span> <span class="o">=</span> <span class="mi">0</span><span class="o">;</span> <span class="n">j</span> <span class="o">&lt;</span> <span class="n">size</span><span class="o">;</span> <span class="n">j</span><span class="o">++)</span> <span class="o">{</span>
                <span class="n">result</span><span class="o">[</span><span class="n">i</span><span class="o">][</span><span class="n">j</span><span class="o">]</span> <span class="o">+=</span> <span class="n">current</span> <span class="o">*</span> <span class="n">b</span><span class="o">[</span><span class="n">k</span><span class="o">][</span><span class="n">j</span><span class="o">];</span>
            <span class="o">}</span>
        <span class="o">}</span>
    <span class="o">}</span>
    <span class="k">return</span> <span class="n">result</span><span class="o">;</span>
<span class="o">}</span>
</code></pre></div></div>
<p>Both methods <code class="language-plaintext highlighter-rouge">matrixMultiplySlow</code> and <code class="language-plaintext highlighter-rouge">matrixMultiplyFaster</code> have the same complexity O(n^3). So
why is one faster than the other? Well, if you want to understand exactly how a CPU-intensive algorithm works, 
you need to understand how the CPU works, which is far away from the topic of this post. Be aware that if
you want to optimize such algorithms; you will probably need at least one of the following:</p>

<ul>
  <li>Knowledge of CPU architecture</li>
  <li>Top-Down performance analysis methodology</li>
  <li>Looking at the ASM of generated methods</li>
</ul>

<p>Many Java programmers forget that all the execution is done on the CPU. Java needs to use ASM to run on the CPU. That’s
basically what the JIT compiler does: It converts your hot methods and loops into optimized ASM. At the assembly level,
you can check, for example, if the JIT used vectorized instruction for your loops. So yes, sometimes you need to get dirty 
with such low-level stuff. For now, async-profiler gives you a hint on which methods to focus.</p>

<p>We will return to this example in the <a href="#perf-cache">Cache misses</a> section.</p>

<h3 id="alloc">Allocation</h3>

<p>The most common use cases where the allocations are tracked are:</p>

<ul>
  <li>decreasing GC run frequency</li>
  <li>finding allocations outside the TLAB, which are done in the slow path</li>
  <li>fighting with single/tens of milliseconds latency, where even the creation of heap objects matters</li>
</ul>

<p>First, let’s understand how new objects on a heap are created so we have a better
understanding of what the async-profiler shows us.</p>

<p>A portion of our Java heap is called an <strong>eden</strong>. This is a place where new objects are
born. Let’s assume for simplicity that eden is a continuous slice of memory. The very efficient
way of allocation in such a case is called <strong>bumping pointer</strong>. We keep a pointer to the first 
address of the free space:</p>

<p><img src="/assets/async-demos/alloc-1.png" alt="alt text" title="alloc" /></p>

<p>When we do <code class="language-plaintext highlighter-rouge">new Object()</code>, we simply calculate its size, locate 
the next free address and bump the pointer by <code class="language-plaintext highlighter-rouge">sizeof(Object)</code>:</p>

<p><img src="/assets/async-demos/alloc-2.png" alt="alt text" title="alloc" /></p>

<p>But there is one major problem with that technique: We have to synchronize the object allocation if we have more than one thread that can 
create new objects in parallel, but this is quite costly. We solve this by giving each thread a portion of eden dedicated to only that thread. This portion 
is called <strong>TLAB</strong> - thread-local allocation buffer. With this, each thread can use <strong>bumping pointer</strong> at its TLAB safely and in parallel.</p>

<p>Introducing TLABs creates two more issues that the JVM needs to deal with:</p>

<ul>
  <li>a thread can allocate an object, but there is not enough space in its TLAB - the JVM creates a new TLAB if there is still space in eden</li>
  <li>a thread can allocate a big object, so it’s not optimal to use the TLAB mechanism - the JVM will use the <em>slow path</em> of the allocation that allocates the object directly in eden or in the old generation</li>
</ul>

<p>What is important to us is that in both these cases, the JVM emits an event that a profiler can capture. That’s basically how async-profiler samples allocations:</p>

<ul>
  <li>if the allocation of an object needed a new TLAB - we see an aqua frame for that</li>
  <li>if the allocation was done outside the TLAB - we see a brown frame</li>
</ul>

<p>In real-world systems, the frequency of GC can be monitored by systems like Grafana or Zabbix.
Here we have a synthetic application, so let’s measure the allocation size differently:</p>

<div class="language-shell highlighter-rouge"><div class="highlight"><pre class="highlight"><code><span class="c"># little warmup</span>
ab <span class="nt">-n</span> 2 <span class="nt">-c</span> 1 http://localhost:8081/examples/alloc/

<span class="c"># measuring the heap allocations of a request</span>
jcmd first-application-0.0.1-SNAPSHOT.jar GC.run
jcmd first-application-0.0.1-SNAPSHOT.jar GC.heap_info
ab <span class="nt">-n</span> 10 <span class="nt">-c</span> 1 http://localhost:8081/examples/alloc/
jcmd first-application-0.0.1-SNAPSHOT.jar GC.heap_info

<span class="c"># profiling time</span>
./profiler.sh start <span class="nt">-e</span> alloc <span class="nt">-f</span> alloc.jfr first-application-0.0.1-SNAPSHOT.jar
ab <span class="nt">-n</span> 1000 <span class="nt">-c</span> 1 http://localhost:8081/examples/alloc/
./profiler.sh stop <span class="nt">-f</span> alloc.jfr first-application-0.0.1-SNAPSHOT.jar
</code></pre></div></div>

<p>Let’s look at the output of the <code class="language-plaintext highlighter-rouge">GC.heap_info</code> command:</p>

<div class="language-shell highlighter-rouge"><div class="highlight"><pre class="highlight"><code> garbage-first heap   total 1048576K, used 41926K <span class="o">[</span>0x00000000c0000000, 0x0000000100000000<span class="o">)</span>
  region size 1024K, 2 young <span class="o">(</span>2048K<span class="o">)</span>, 0 survivors <span class="o">(</span>0K<span class="o">)</span>
 Metaspace       used 67317K, committed 67904K, reserved 1114112K
  class space    used 9868K, committed 10176K, reserved 1048576K

 garbage-first heap   total 1048576K, used 110018K <span class="o">[</span>0x00000000c0000000, 0x0000000100000000<span class="o">)</span>
  region size 1024K, 8 young <span class="o">(</span>8192K<span class="o">)</span>, 0 survivors <span class="o">(</span>0K<span class="o">)</span>
 Metaspace       used 67317K, committed 67904K, reserved 1114112K
  class space    used 9868K, committed 10176K, reserved 1048576K
</code></pre></div></div>

<p>We executed <code class="language-plaintext highlighter-rouge">alloc</code> requests ten times, and our heap usage has increased from <strong>41926K</strong> to <strong>110018K</strong>.
So we are creating over <strong>6MB</strong> of objects per request on the heap. If we look at the controller source code
it’s hard to justify that:</p>

<div class="language-java highlighter-rouge"><div class="highlight"><pre class="highlight"><code><span class="nd">@RestController</span>
<span class="nd">@RequestMapping</span><span class="o">(</span><span class="s">"/examples/alloc"</span><span class="o">)</span>
<span class="nd">@RequiredArgsConstructor</span>
<span class="kd">class</span> <span class="nc">AllocController</span> <span class="o">{</span>
    <span class="nd">@GetMapping</span><span class="o">(</span><span class="s">"/"</span><span class="o">)</span>
    <span class="nc">String</span> <span class="nf">get</span><span class="o">()</span> <span class="o">{</span>
        <span class="k">return</span> <span class="s">"OK"</span><span class="o">;</span>
    <span class="o">}</span>
<span class="o">}</span>
</code></pre></div></div>

<p>Let’s look at the allocation flame graph: (<a href="/assets/async-demos/alloc.html" target="_blank">HTML</a>)</p>

<p><img src="/assets/async-demos/alloc.png" alt="alt text" title="flames" /></p>

<p>The class <code class="language-plaintext highlighter-rouge">AbstractRequestLoggingFilter</code> is responsible for over <strong>99%</strong> of recorder allocations. 
You can find its main creation sites using the techniques from the <a href="#methods">Methods profiling</a> section; feel free to skip it for now.
Here is the answer:</p>

<div class="language-java highlighter-rouge"><div class="highlight"><pre class="highlight"><code><span class="nd">@Bean</span>
<span class="nc">CommonsRequestLoggingFilter</span> <span class="nf">requestLoggingFilter</span><span class="o">()</span> <span class="o">{</span>
    <span class="nc">CommonsRequestLoggingFilter</span> <span class="n">loggingFilter</span> <span class="o">=</span> <span class="k">new</span> <span class="nc">CommonsRequestLoggingFilter</span><span class="o">()</span> <span class="o">{</span>
        <span class="nd">@Override</span>
        <span class="kd">protected</span> <span class="kt">boolean</span> <span class="nf">shouldNotFilter</span><span class="o">(</span><span class="nc">HttpServletRequest</span> <span class="n">request</span><span class="o">)</span> <span class="kd">throws</span> <span class="nc">ServletException</span> <span class="o">{</span>
            <span class="k">return</span> <span class="o">!</span><span class="n">request</span><span class="o">.</span><span class="na">getRequestURI</span><span class="o">().</span><span class="na">contains</span><span class="o">(</span><span class="s">"alloc"</span><span class="o">);</span>
        <span class="o">}</span>
    <span class="o">};</span>

    <span class="n">loggingFilter</span><span class="o">.</span><span class="na">setIncludeClientInfo</span><span class="o">(</span><span class="kc">true</span><span class="o">);</span>
    <span class="n">loggingFilter</span><span class="o">.</span><span class="na">setIncludeQueryString</span><span class="o">(</span><span class="kc">true</span><span class="o">);</span>
    <span class="n">loggingFilter</span><span class="o">.</span><span class="na">setIncludePayload</span><span class="o">(</span><span class="kc">true</span><span class="o">);</span>
    <span class="n">loggingFilter</span><span class="o">.</span><span class="na">setMaxPayloadLength</span><span class="o">(</span><span class="mi">5</span> <span class="o">*</span> <span class="mi">1024</span> <span class="o">*</span> <span class="mi">1024</span><span class="o">);</span>
    <span class="n">loggingFilter</span><span class="o">.</span><span class="na">setIncludeHeaders</span><span class="o">(</span><span class="kc">true</span><span class="o">);</span>
    <span class="k">return</span> <span class="n">loggingFilter</span><span class="o">;</span>
<span class="o">}</span>
</code></pre></div></div>

<p>I have seen such code many times; this <code class="language-plaintext highlighter-rouge">CommonsRequestLoggingFilter</code>class helps you log
the REST endpoint communication. The <code class="language-plaintext highlighter-rouge">setMaxPayloadLength()</code> method sets the maximum number of bytes of the payload which are logged. 
You can browse over the Spring source code to see that the implementation creates byte arrays of
such size in the constructor. No matter how big the payload is, we always create a <strong>5MB</strong> array here.</p>

<p>The advice that I gave to users of that code was to create their own filter that would do the same job
but allocate the array lazily.</p>

<h3 id="alloc-ha">Allocation - humongous objects</h3>

<p>If you use the G1 garbage collector, JVM’s default since JDK 9, your heap is divided into
regions. The region sizes vary from <strong>1 MB</strong> to <strong>32 MB</strong> depending on the heap size. The goal is to have no more than <strong>2048</strong> regions.
You can check the region size for different heap sizes with the following:</p>

<div class="language-shell highlighter-rouge"><div class="highlight"><pre class="highlight"><code>java <span class="nt">-Xms1G</span> <span class="nt">-Xmx1G</span> <span class="nt">-Xlog</span>:gc,exit<span class="k">*</span><span class="o">=</span>debug <span class="nt">-version</span>
</code></pre></div></div>

<p>The output contains a line containing the <code class="language-plaintext highlighter-rouge">region size 1024K</code> information.</p>

<p>If you are trying to allocate an object larger or equal to half of the region size, 
you are doing a humongous allocation. Long story short: It has been, and it is, painful. 
It is allocated directly in the old generation but is cleared during minor GCs. I saw situations
where G1 GC needed to invoke a FullGC phase because of the humongous allocation. If you do much of this, G1 will also invoke more concurrent collections, which can waste your CPU.</p>

<p>While running the previous example, you could spot in <code class="language-plaintext highlighter-rouge">first-application-0.0.1-SNAPSHOT.jar</code> logs:</p>

<div class="language-shell highlighter-rouge"><div class="highlight"><pre class="highlight"><code>...
<span class="o">[</span>70,149s][debug][gc,humongous] GC<span class="o">(</span>34<span class="o">)</span> Reclaimed humongous region 436 <span class="o">(</span>object size 5242896 @ 0x00000000db400000<span class="o">)</span>
<span class="o">[</span>70,149s][debug][gc,humongous] GC<span class="o">(</span>34<span class="o">)</span> Reclaimed humongous region 442 <span class="o">(</span>object size 5242896 @ 0x00000000dba00000<span class="o">)</span>
<span class="o">[</span>70,149s][debug][gc,humongous] GC<span class="o">(</span>34<span class="o">)</span> Reclaimed humongous region 448 <span class="o">(</span>object size 5242896 @ 0x00000000dc000000<span class="o">)</span>
<span class="o">[</span>70,149s][debug][gc,humongous] GC<span class="o">(</span>34<span class="o">)</span> Reclaimed humongous region 454 <span class="o">(</span>object size 5242896 @ 0x00000000dc600000<span class="o">)</span>
...
</code></pre></div></div>

<p>These GC logs tell us that some humongous object of size <code class="language-plaintext highlighter-rouge">5242896</code> was reclaimed. The nice thing
about JFR files is that they also keep the size of sampled allocations. Using this, we should be able to find out
the stack trace that has created that object.</p>

<p>We don’t need sophisticated JFR viewers for that. We get the <code class="language-plaintext highlighter-rouge">jfr</code> command with any JDK distribution. Let’s use it:</p>

<div class="language-shell highlighter-rouge"><div class="highlight"><pre class="highlight"><code><span class="nv">$ </span>jfr summary alloc.jfr
...
 Event Type                          Count  Size <span class="o">(</span>bytes<span class="o">)</span> 
<span class="o">=========================================================</span>
 jdk.ObjectAllocationOutsideTLAB      1013         19220
 jdk.ObjectAllocationInNewTLAB         359          6719
...
</code></pre></div></div>

<p>Let’s focus on allocations outside the TLAB; it is unlikely to allocate humongous objects in the TLAB.</p>

<div class="language-shell highlighter-rouge"><div class="highlight"><pre class="highlight"><code><span class="nv">$ </span>jfr print <span class="nt">--events</span> jdk.ObjectAllocationOutsideTLAB <span class="nt">--stack-depth</span> 10 alloc.jfr
...
jdk.ObjectAllocationOutsideTLAB <span class="o">{</span>
  startTime <span class="o">=</span> 2022-12-05T08:56:04.354766183Z
  objectClass <span class="o">=</span> byte[] <span class="o">(</span>classLoader <span class="o">=</span> null<span class="o">)</span>
  allocationSize <span class="o">=</span> 5242896
  eventThread <span class="o">=</span> <span class="s2">"http-nio-8081-exec-9"</span> <span class="o">(</span>javaThreadId <span class="o">=</span> 49<span class="o">)</span>
  stackTrace <span class="o">=</span> <span class="o">[</span>
    java.io.ByteArrayOutputStream.&lt;init&gt;<span class="o">(</span>int<span class="o">)</span> line: 81
    org.springframework.web.util.ContentCachingRequestWrapper.&lt;init&gt;<span class="o">(</span>HttpServletRequest, int<span class="o">)</span> line: 90
    org.springframework.web.filter.AbstractRequestLoggingFilter.doFilterInternal<span class="o">(</span>HttpServletRequest, HttpServletResponse, FilterChain<span class="o">)</span> line: 281
    org.springframework.web.filter.OncePerRequestFilter.doFilter<span class="o">(</span>ServletRequest, ServletResponse, FilterChain<span class="o">)</span> line: 116
    org.apache.catalina.core.ApplicationFilterChain.internalDoFilter<span class="o">(</span>ServletRequest, ServletResponse<span class="o">)</span> line: 185
    org.apache.catalina.core.ApplicationFilterChain.doFilter<span class="o">(</span>ServletRequest, ServletResponse<span class="o">)</span> line: 158
    org.springframework.web.filter.RequestContextFilter.doFilterInternal<span class="o">(</span>HttpServletRequest, HttpServletResponse, FilterChain<span class="o">)</span> line: 100
    org.springframework.web.filter.OncePerRequestFilter.doFilter<span class="o">(</span>ServletRequest, ServletResponse, FilterChain<span class="o">)</span> line: 116
    org.apache.catalina.core.ApplicationFilterChain.internalDoFilter<span class="o">(</span>ServletRequest, ServletResponse<span class="o">)</span> line: 185
    org.apache.catalina.core.ApplicationFilterChain.doFilter<span class="o">(</span>ServletRequest, ServletResponse<span class="o">)</span> line: 158
    ...
  <span class="o">]</span>
<span class="o">}</span>
...
</code></pre></div></div>

<p>We can easily match <code class="language-plaintext highlighter-rouge">allocationSize = 5242896</code>` with the object size from the GC logs, so we can find and eliminate humongous allocations using that technique. You can filter the allocation
JFR file for objects with a size larger or equal to half of our G1 region size. All of 
these allocations are humongous allocations.</p>

<h3 id="alloc-live">Allocation - live objects</h3>

<p>Now on to memory leaks, which form the reason for tracking live object allocations:</p>

<blockquote>
  <p>A memory leak occurs when a <em>Garbage Collector</em> cannot collect Objects that are no longer needed by the Java application.</p>
</blockquote>

<p>Memory leaks are one of the most common problems related to Java heaps; the other is</p>

<ul>
  <li><strong>not enough space on a heap</strong> - sometimes, a Java application may work fine with the heap it has, but there is the possibility to run a part of the application
that needs more heap than specified via <strong>-Xmx</strong></li>
  <li><strong>a gray area between</strong> - these are cases when we allocate memory indefinitely, but our application needs these objects</li>
</ul>

<p>How can we detect memory leaks? The GC emits the following kind of entry at the end of each <em>GC cycle</em> into the GC logs at <em>info</em> level:</p>

<div class="language-plaintext highlighter-rouge"><div class="highlight"><pre class="highlight"><code>GC(11536) Pause Young (Normal) (G1 Evacuation Pause) 6746M-&gt;2016M(8192M) 40.514ms
</code></pre></div></div>

<p>You can find <strong>three</strong> sizes in such an entry <strong>A-&gt;B(C)</strong> that are:</p>
<ul>
  <li><strong>A</strong> - used size of a heap before <em>GC cycle</em></li>
  <li><strong>B</strong> - used size of a heap after <em>GC cycle</em></li>
  <li><strong>C</strong> - the current size of a whole heap</li>
</ul>

<p>If we take the <strong>B</strong> value from each collection and put it on a chart, we can generate the 
<em>Heap after GC</em> chart. We can use such a chart to then detect if we have a memory leak:
If a chart looks like those (from a <strong>7 days</strong> period):</p>

<p><img src="/assets/monday-2/1.jpg" alt="alt text" title="1" /></p>

<p><img src="/assets/monday-2/4.jpg" alt="alt text" title="4" /></p>

<p>then there is <strong>no memory leak</strong>. The <em>garbage collector</em> can clean up the heap to 
the same level every day. The chart with a memory leak looks like the following one:</p>

<p><img src="/assets/monday-2/2.jpg" alt="alt text" title="2" /></p>

<p>These spikes to the roof are <em>to-space exhausted</em> situations in the <strong>G1</strong> algorithm; those are not <em>OutOfMemoryErrors</em>. After each of those spikes, there was a
<strong>Full GC</strong> phase that is a <strong>failover</strong> in that algorithm.</p>

<p>Here is an example of the <strong>not enough space on a heap</strong> problem:</p>

<p><img src="/assets/monday-2/3.jpg" alt="alt text" title="3" /></p>

<p>This one spike is an <em>OutOfMemoryError</em>. One service was run with arguments that needed <strong>~16GB</strong> on a heap to complete. 
Unfortunately <strong>-Xmx</strong> was set to
<strong>4GB</strong>. <strong>It is not a memory leak</strong>.</p>

<p>We must be careful if our application is entirely stateless and we use GC with <strong>young/old generations</strong> (like G1, parallel, serial, and CMS).
We must remember that objects from a <strong>memory leak</strong> live in the <strong>old generation</strong>. 
In stateless applications, that part of the heap can be cleared even once a
week. Here is an example recording <strong>3 days</strong> of the stateless application:</p>

<p><img src="/assets/monday-2/5.jpg" alt="alt text" title="5" /></p>

<p>It looks like a memory leak, the <code class="language-plaintext highlighter-rouge">min(heap after GC)</code> increasing every day, but if we look at the same chart with one additional day:</p>

<p><img src="/assets/monday-2/6.jpg" alt="alt text" title="6" /></p>

<p>The GC cleared the heap to the previous level. This was done by an <strong>old-generation</strong> cleanup that didn’t happen in the previous days.</p>

<p>The <em>Heap after GC</em> chart can be generated by probing through JMX. The JVM gives that information via mBeans:</p>

<ul>
  <li><code class="language-plaintext highlighter-rouge">java.lang:type=GarbageCollector,name=G1 Young Generation</code></li>
  <li><code class="language-plaintext highlighter-rouge">java.lang:type=GarbageCollector,name=G1 Old Generation</code></li>
</ul>

<p>Both mBeans provide attributes with the name <code class="language-plaintext highlighter-rouge">LastGcInfo</code> from which we can extract the needed information.</p>

<p>Most memory leaks I discovered in recent years in enterprise applications were either in
frameworks/libraries or in some kind of bridge between them. Recreating such an issue in our example
application would require introducing a lot of strange dependencies, so I chose to
recreate one custom-made heap memory leak I discovered a few years ago.</p>

<div class="language-shell highlighter-rouge"><div class="highlight"><pre class="highlight"><code><span class="c"># preparation</span>
curl http://localhost:8081/examples/leak/prepare
ab <span class="nt">-n</span> 1000 <span class="nt">-c</span> 4 http://localhost:8081/examples/leak/do-leak

<span class="c"># profiling</span>
jcmd first-application-0.0.1-SNAPSHOT.jar GC.run 
jcmd first-application-0.0.1-SNAPSHOT.jar GC.heap_info
./profiler.sh start <span class="nt">-e</span> alloc <span class="nt">--live</span> <span class="nt">-f</span> live.jfr first-application-0.0.1-SNAPSHOT.jar
ab <span class="nt">-n</span> 1000000 <span class="nt">-c</span> 4 http://localhost:8081/examples/leak/do-leak
jcmd first-application-0.0.1-SNAPSHOT.jar GC.run
jcmd first-application-0.0.1-SNAPSHOT.jar GC.heap_info
./profiler.sh stop <span class="nt">-f</span> live.jfr first-application-0.0.1-SNAPSHOT.jar
</code></pre></div></div>

<p>Let’s look at the output of the <code class="language-plaintext highlighter-rouge">GC.heap_info</code> commands that were invoked soon after running the GC:</p>
<div class="language-shell highlighter-rouge"><div class="highlight"><pre class="highlight"><code> garbage-first heap   total 1048576K, used 50144K <span class="o">[</span>0x00000000c0000000, 0x0000000100000000<span class="o">)</span>
  region size 1024K, 1 young <span class="o">(</span>1024K<span class="o">)</span>, 0 survivors <span class="o">(</span>0K<span class="o">)</span>
 Metaspace       used 68750K, committed 69376K, reserved 1114112K
  class space    used 10054K, committed 10368K, reserved 1048576K

 garbage-first heap   total 1048576K, used 237806K <span class="o">[</span>0x00000000c0000000, 0x0000000100000000<span class="o">)</span>
  region size 1024K, 1 young <span class="o">(</span>1024K<span class="o">)</span>, 0 survivors <span class="o">(</span>0K<span class="o">)</span>
 Metaspace       used 68841K, committed 69440K, reserved 1114112K
  class space    used 10063K, committed 10368K, reserved 1048576K
</code></pre></div></div>

<p>So invoking our <code class="language-plaintext highlighter-rouge">do-leak</code> request created <strong>~183MB</strong> of objects that GC couldn’t free.</p>

<p>Let’s look at the allocation flame graph with the <code class="language-plaintext highlighter-rouge">--live</code> option enabled: (<a href="/assets/async-demos/live.html" target="_blank">HTML</a>)</p>

<p><img src="/assets/async-demos/live.png" alt="alt text" title="flames" /></p>

<p>The largest part of the leak is created in the <code class="language-plaintext highlighter-rouge">JdbcQueryProfiler</code> class; let’s look at the sources:</p>

<div class="language-java highlighter-rouge"><div class="highlight"><pre class="highlight"><code><span class="kd">class</span> <span class="nc">JdbcQueryProfiler</span> <span class="o">{</span>
    <span class="kd">private</span> <span class="kd">final</span> <span class="nc">Map</span><span class="o">&lt;</span><span class="nc">String</span><span class="o">,</span> <span class="nc">ProfilingData</span><span class="o">&gt;</span> <span class="n">profilingResults</span> <span class="o">=</span> <span class="k">new</span> <span class="nc">ConcurrentHashMap</span><span class="o">&lt;&gt;();</span>
  
    <span class="o">&lt;</span><span class="no">T</span><span class="o">&gt;</span> <span class="no">T</span> <span class="nf">runWithProfiler</span><span class="o">(</span><span class="nc">String</span> <span class="n">queryStr</span><span class="o">,</span> <span class="nc">Supplier</span><span class="o">&lt;</span><span class="no">T</span><span class="o">&gt;</span> <span class="n">query</span><span class="o">)</span> <span class="o">{</span>
        <span class="nc">StopWatch</span> <span class="n">stopWatch</span> <span class="o">=</span> <span class="k">new</span> <span class="nc">StopWatch</span><span class="o">();</span>
        <span class="n">stopWatch</span><span class="o">.</span><span class="na">start</span><span class="o">();</span>
        <span class="no">T</span> <span class="n">ret</span> <span class="o">=</span> <span class="n">query</span><span class="o">.</span><span class="na">get</span><span class="o">();</span>
        <span class="n">stopWatch</span><span class="o">.</span><span class="na">stop</span><span class="o">();</span>
        <span class="n">profilingResults</span><span class="o">.</span><span class="na">computeIfAbsent</span><span class="o">(</span><span class="n">queryStr</span><span class="o">,</span> <span class="nl">ProfilingData:</span><span class="o">:</span><span class="k">new</span><span class="o">).</span><span class="na">nextInvocation</span><span class="o">(</span><span class="n">stopWatch</span><span class="o">.</span><span class="na">getTotalTimeMillis</span><span class="o">());</span>
        <span class="k">return</span> <span class="n">ret</span><span class="o">;</span>
    <span class="o">}</span>
    <span class="c1">// ...</span>
<span class="o">}</span>
</code></pre></div></div>

<p>So that class calculates the execution time for each query and remembers it in
some <code class="language-plaintext highlighter-rouge">ProfilingData</code> structure that is placed in <code class="language-plaintext highlighter-rouge">ConcurrentHashMap</code>. That doesn’t look scary; as long as we use parametrized queries under our control, the map should have a finite size.
Let’s look at the usage of the <code class="language-plaintext highlighter-rouge">runWithProfiler()</code> method:</p>

<div class="language-java highlighter-rouge"><div class="highlight"><pre class="highlight"><code><span class="nc">String</span> <span class="nf">getValueForKey</span><span class="o">(</span><span class="kt">int</span> <span class="n">key</span><span class="o">)</span> <span class="o">{</span>
    <span class="nc">String</span> <span class="n">sql</span> <span class="o">=</span> <span class="s">"select a_value from LEAKY_ENTITY where a_Key = "</span> <span class="o">+</span> <span class="n">key</span><span class="o">;</span>

    <span class="k">return</span> <span class="n">jdbcQueryProfiler</span><span class="o">.</span><span class="na">runWithProfiler</span><span class="o">(</span><span class="n">sql</span><span class="o">,</span> <span class="o">()</span> <span class="o">-&gt;</span> <span class="o">{</span>
        <span class="k">try</span> <span class="o">{</span>
            <span class="k">return</span> <span class="n">jdbcTemplate</span><span class="o">.</span><span class="na">queryForObject</span><span class="o">(</span><span class="n">sql</span><span class="o">,</span> <span class="nc">String</span><span class="o">.</span><span class="na">class</span><span class="o">);</span>
        <span class="o">}</span> <span class="k">catch</span> <span class="o">(</span><span class="nc">EmptyResultDataAccessException</span> <span class="n">e</span><span class="o">)</span> <span class="o">{</span>
            <span class="k">return</span> <span class="kc">null</span><span class="o">;</span>
        <span class="o">}</span>
    <span class="o">});</span>
<span class="o">}</span>
</code></pre></div></div>

<p>So, well, so good; we are not using parameterized queries; we create new query strings for every <code class="language-plaintext highlighter-rouge">key</code>. This way
mentioned <code class="language-plaintext highlighter-rouge">ConcurrentHashMap</code> is growing with every new <code class="language-plaintext highlighter-rouge">key</code> passed to the <code class="language-plaintext highlighter-rouge">getValueForKey</code> method.</p>

<p>If you have a heap memory leak in your application, then you have two groups of objects:</p>

<p><img src="/assets/async-live/leak-1.png" alt="alt text" title="leak" /></p>

<ul>
  <li><strong>Live set</strong> - a group of objects that are still needed by your application</li>
  <li><strong>Memory leak</strong> - a group of objects that are no longer needed</li>
</ul>

<p>Garbage collectors cannot free the second group if there is at least one strong reference from the <strong>live set</strong> to the <strong>memory
leak</strong>. The biggest problems with diagnosing memory leaks are:</p>

<ul>
  <li>the fact that the object was created <strong>is not an issue</strong> - it was created because it was needed for something</li>
  <li>the fact that the mentioned reference was created <strong>is not an issue</strong> - it had some purpose too</li>
  <li>we need to understand why that reference was not removed from our application</li>
</ul>

<p>The last one is not trivial. All the observability/profiling tools give us a great possibility to understand why
some event has happened, but with memory leaks, we need to understand why something has not yet happened.
Two additional tools come to our rescue:</p>

<ul>
  <li><strong>heap dump</strong> - shows us the current state of a heap - we can find out what kind of objects are there but shouldn’t be</li>
  <li><strong>profiler</strong> - shows us where these objects were created</li>
</ul>

<p>In this simple example, any of those tools is enough. In more complicated ones, I needed both to find the root cause
of the problem. It is nice to finally have a tool that can profile memory leaks on production systems.</p>

<p>It is worth mentioning that the <code class="language-plaintext highlighter-rouge">--live</code> option is available only since <strong>async-profiler 2.9</strong>, it needs 
<strong>JDK &gt;= 11</strong> and might still contain bugs. I didn’t have a chance to test it on any production system yet.</p>

<h3 id="locks">Locks</h3>

<p>Async-profiler has a lock mode. This mode is useful when looking into look contention in our application.
Let’s try to use it and understand the internals of <code class="language-plaintext highlighter-rouge">ConcurrentHashMap</code>.  The
<code class="language-plaintext highlighter-rouge">get()</code> method is obviously lock-free, but what about <code class="language-plaintext highlighter-rouge">computeIfAbsent()</code>? 
Let’s profile a code that uses it:</p>

<div class="language-java highlighter-rouge"><div class="highlight"><pre class="highlight"><code><span class="kd">class</span> <span class="nc">LockService</span> <span class="o">{</span>
    <span class="kd">private</span> <span class="kd">final</span> <span class="nc">Map</span><span class="o">&lt;</span><span class="nc">String</span><span class="o">,</span> <span class="nc">String</span><span class="o">&gt;</span> <span class="n">map</span> <span class="o">=</span> <span class="k">new</span> <span class="nc">ConcurrentHashMap</span><span class="o">&lt;&gt;();</span>
  
    <span class="nc">LockService</span><span class="o">()</span> <span class="o">{</span>
        <span class="nc">String</span> <span class="n">a</span> <span class="o">=</span> <span class="s">"AaAa"</span><span class="o">;</span>
        <span class="nc">String</span> <span class="n">b</span> <span class="o">=</span> <span class="s">"BBBB"</span><span class="o">;</span>
        <span class="n">log</span><span class="o">.</span><span class="na">info</span><span class="o">(</span><span class="s">"Hashcode equals: {}"</span><span class="o">,</span> <span class="n">a</span><span class="o">.</span><span class="na">hashCode</span><span class="o">()</span> <span class="o">==</span> <span class="n">b</span><span class="o">.</span><span class="na">hashCode</span><span class="o">());</span> <span class="c1">// true</span>
        <span class="n">map</span><span class="o">.</span><span class="na">computeIfAbsent</span><span class="o">(</span><span class="n">a</span><span class="o">,</span> <span class="n">s</span> <span class="o">-&gt;</span> <span class="n">a</span><span class="o">);</span>
        <span class="n">map</span><span class="o">.</span><span class="na">computeIfAbsent</span><span class="o">(</span><span class="n">b</span><span class="o">,</span> <span class="n">s</span> <span class="o">-&gt;</span> <span class="n">b</span><span class="o">);</span>
    <span class="o">}</span>
  
    <span class="kt">void</span> <span class="nf">withLock</span><span class="o">(</span><span class="nc">String</span> <span class="n">key</span><span class="o">)</span> <span class="o">{</span>
        <span class="n">map</span><span class="o">.</span><span class="na">computeIfAbsent</span><span class="o">(</span><span class="n">key</span><span class="o">,</span> <span class="n">s</span> <span class="o">-&gt;</span> <span class="n">key</span><span class="o">);</span>
    <span class="o">}</span>
  
    <span class="kt">void</span> <span class="nf">withoutLock</span><span class="o">(</span><span class="nc">String</span> <span class="n">key</span><span class="o">)</span> <span class="o">{</span>
        <span class="k">if</span> <span class="o">(</span><span class="n">map</span><span class="o">.</span><span class="na">get</span><span class="o">(</span><span class="n">key</span><span class="o">)</span> <span class="o">==</span> <span class="kc">null</span><span class="o">)</span> <span class="o">{</span>
            <span class="n">map</span><span class="o">.</span><span class="na">computeIfAbsent</span><span class="o">(</span><span class="n">key</span><span class="o">,</span> <span class="n">s</span> <span class="o">-&gt;</span> <span class="n">key</span><span class="o">);</span>
        <span class="o">}</span>
    <span class="o">}</span>
<span class="o">}</span>
</code></pre></div></div>

<p>Let’s use lock mode to profile that:</p>

<div class="language-shell highlighter-rouge"><div class="highlight"><pre class="highlight"><code><span class="c"># preparation</span>
ab <span class="nt">-n</span> 100 <span class="nt">-c</span> 1 http://localhost:8081/examples/lock/with-lock
ab <span class="nt">-n</span> 100 <span class="nt">-c</span> 1 http://localhost:8081/examples/lock/without-lock

<span class="c"># profiling</span>
./profiler.sh start <span class="nt">-e</span> lock <span class="nt">-f</span> lock.jfr first-application-0.0.1-SNAPSHOT.jar
ab <span class="nt">-n</span> 100000 <span class="nt">-c</span> 100 http://localhost:8081/examples/lock/with-lock
ab <span class="nt">-n</span> 100000 <span class="nt">-c</span> 100 http://localhost:8081/examples/lock/without-lock
./profiler.sh stop <span class="nt">-f</span> lock.jfr first-application-0.0.1-SNAPSHOT.jar
</code></pre></div></div>

<p>The lock flame graph: (<a href="/assets/async-demos/lock.html" target="_blank">HTML</a>)</p>

<p><img src="/assets/async-demos/lock-1.png" alt="alt text" title="flames" /></p>

<p>I highlighted the <code class="language-plaintext highlighter-rouge">LockController</code> occurrence. Let’s zoom it:</p>

<p><img src="/assets/async-demos/lock-2.png" alt="alt text" title="flames" /></p>

<p>We see that only the <code class="language-plaintext highlighter-rouge">withLock()</code> method acquires locks. You can study the internals of the <code class="language-plaintext highlighter-rouge">computeIfAbsent()</code> method
to see that it might lock on hash collisions. 
The easiest way to confirm this is by creating a small program that triggers hash collisions on purpose.</p>

<div class="language-java highlighter-rouge"><div class="highlight"><pre class="highlight"><code><span class="kd">public</span> <span class="kd">static</span> <span class="kt">void</span> <span class="nf">main</span><span class="o">(</span><span class="nc">String</span><span class="o">[]</span> <span class="n">args</span><span class="o">)</span> <span class="o">{</span>
    <span class="nc">Map</span><span class="o">&lt;</span><span class="nc">String</span><span class="o">,</span> <span class="nc">String</span><span class="o">&gt;</span> <span class="n">map</span> <span class="o">=</span> <span class="k">new</span> <span class="nc">ConcurrentHashMap</span><span class="o">&lt;&gt;();</span>
    <span class="nc">String</span> <span class="n">a</span> <span class="o">=</span> <span class="s">"AaAa"</span><span class="o">;</span>
    <span class="nc">String</span> <span class="n">b</span> <span class="o">=</span> <span class="s">"BBBB"</span><span class="o">;</span>

    <span class="n">map</span><span class="o">.</span><span class="na">computeIfAbsent</span><span class="o">(</span><span class="n">a</span><span class="o">,</span> <span class="n">s</span> <span class="o">-&gt;</span> <span class="n">a</span><span class="o">);</span>

    <span class="c1">// it enters the synchronized section here</span>
    <span class="n">map</span><span class="o">.</span><span class="na">computeIfAbsent</span><span class="o">(</span><span class="n">b</span><span class="o">,</span> <span class="n">s</span> <span class="o">-&gt;</span> <span class="n">b</span><span class="o">);</span>

    <span class="c1">// it enters the synchronized section here, and all the following</span>
    <span class="c1">// execution of computeIfAbsent with "BBBB" as a key.</span>
    <span class="n">map</span><span class="o">.</span><span class="na">computeIfAbsent</span><span class="o">(</span><span class="n">b</span><span class="o">,</span> <span class="n">s</span> <span class="o">-&gt;</span> <span class="n">b</span><span class="o">);</span>
    <span class="n">map</span><span class="o">.</span><span class="na">computeIfAbsent</span><span class="o">(</span><span class="n">b</span><span class="o">,</span> <span class="n">s</span> <span class="o">-&gt;</span> <span class="n">b</span><span class="o">);</span>
    <span class="n">map</span><span class="o">.</span><span class="na">computeIfAbsent</span><span class="o">(</span><span class="n">b</span><span class="o">,</span> <span class="n">s</span> <span class="o">-&gt;</span> <span class="n">b</span><span class="o">);</span>
    <span class="n">map</span><span class="o">.</span><span class="na">computeIfAbsent</span><span class="o">(</span><span class="n">b</span><span class="o">,</span> <span class="n">s</span> <span class="o">-&gt;</span> <span class="n">b</span><span class="o">);</span>
<span class="o">}</span>
</code></pre></div></div>

<p>If you observe a considerable lock contention in this method, and most of the 
time a key is already in the map; then you may consider the approach used in the <code class="language-plaintext highlighter-rouge">withoutLock()</code> method.</p>

<h2 id="tts">Time to safepoint</h2>

<p>The common misconception in the Java world is that <em>garbage collectors</em> need a Stop-the-world (STW) phase to clean dead objects:
But <strong>not only GC needs it</strong>. Other internal mechanisms require application threads to be paused.
For example, the JVM needs an STW phase to <em>deoptimize</em> some compilations and to revoke <em>biased locks</em>. Let’s get a closer look at how the
STW phase works.</p>

<p>On our JVM, there are running some application threads:</p>

<p><img src="/assets/stw/1.png" alt="alt text" title="chart 1" /></p>

<p>While running those threads from time to time, JVM needs to do some work in the STW phase. So it starts this phase, with a
<em>global safepoint request</em>, which informs every thread to go to “sleep”:</p>

<p><img src="/assets/stw/2.png" alt="alt text" title="chart 2" /></p>

<p>Every thread has to find out about this.
Stopping at a safepoint is cooperative: Each thread checks at certain points in the code if it needs to suspend.
The time in which threads will be aware of an STW phase is different for every thread. 
Every thread has to wait for the slowest one. The time between starting an STW phase, and the slowest thread suspension, is called
<em>time to safepoint</em>:</p>

<p><img src="/assets/stw/3.png" alt="alt text" title="chart 3" /></p>

<p>JVM threads can do the work that needs the STW phase only after every thread is asleep. The time when all application threads sleep, 
is called <em>safepoint operation time</em>:</p>

<p><img src="/assets/stw/4.png" alt="alt text" title="chart 4" /></p>

<p>When the JVM finishes its work, application threads are wakened up:</p>

<p><img src="/assets/stw/5.png" alt="alt text" title="chart 5" /></p>

<p>If the application suffers from long STW phases, then most of the time, those are GC cycles, and that information can be found
in the GC logs or JFR. But the situation is more tricky if the application has one thread that slows down every other from reaching the safepoint.</p>

<div class="language-shell highlighter-rouge"><div class="highlight"><pre class="highlight"><code><span class="c"># preparation</span>
curl http://localhost:8081/examples/tts/start
ab <span class="nt">-n</span> 100 <span class="nt">-c</span> 1 http://localhost:8081/examples/tts/execute

<span class="c"># profiling</span>
./profiler.sh start <span class="nt">--ttsp</span> <span class="nt">-f</span> tts.jfr first-application-0.0.1-SNAPSHOT.jar
ab <span class="nt">-n</span> 100 <span class="nt">-c</span> 1 http://localhost:8081/examples/tts/execute
./profiler.sh stop <span class="nt">-f</span> tts.jfr first-application-0.0.1-SNAPSHOT.jar
</code></pre></div></div>

<p>In safepoint logs (you need to run your JVM with the <code class="language-plaintext highlighter-rouge">-Xlog:safepoint</code> flag), we can see:</p>
<div class="language-shell highlighter-rouge"><div class="highlight"><pre class="highlight"><code><span class="o">[</span>105,372s][info <span class="o">][</span>safepoint   <span class="o">]</span> Safepoint <span class="s2">"ThreadDump"</span>, Time since last: 156842 ns, Reaching safepoint: 13381 ns, At safepoint: 120662 ns, Total: 134043 ns
<span class="o">[</span>105,372s][info <span class="o">][</span>safepoint   <span class="o">]</span> Safepoint <span class="s2">"ThreadDump"</span>, Time since last: 157113 ns, Reaching safepoint: 14738 ns, At safepoint: 120252 ns, Total: 134990 ns
<span class="o">[</span>105,373s][info <span class="o">][</span>safepoint   <span class="o">]</span> Safepoint <span class="s2">"ThreadDump"</span>, Time since last: 157676 ns, Reaching safepoint: 13700 ns, At safepoint: 120487 ns, Total: 134187 ns
<span class="o">[</span>105,402s][info <span class="o">][</span>safepoint   <span class="o">]</span> Safepoint <span class="s2">"ThreadDump"</span>, Time since last: 159020 ns, Reaching safepoint: 29524545 ns, At safepoint: 160702 ns, Total: 29685247 ns
</code></pre></div></div>

<p><em>Reaching safepoint</em> contains the time to safepoint. Most of the time, it is <strong>&lt;15 ms</strong>, but we also see one outlier:
<strong>29 ms</strong>. Async-profiler in <code class="language-plaintext highlighter-rouge">--ttsp</code> mode collects samples between:</p>

<ul>
  <li><code class="language-plaintext highlighter-rouge">SafepointSynchronize::begin</code>, and</li>
  <li><code class="language-plaintext highlighter-rouge">RuntimeService::record_safepoint_synchronized</code></li>
</ul>

<p>During that time, our application threads are trying to reach a safepoint:
(<a href="/assets/async-demos/tts.html" target="_blank">HTML</a>)</p>

<p><img src="/assets/async-demos/tts.png" alt="alt text" title="flames" /></p>

<p>We can see that most of the gathered samples are executing <code class="language-plaintext highlighter-rouge">arraycopy</code>, invoked from <code class="language-plaintext highlighter-rouge">TtsController</code>.
The time to safepoint issues that I have approached so far are:</p>

<ul>
  <li><strong>arraycopy</strong> - as in our example</li>
  <li><strong>old JDK + loops</strong> - since JDK 11u4 we have an <em>loop strip mining</em> optimization working correctly (after fixing
<a href="https://bugs.java.com/bugdatabase/view_bug.do?bug_id=JDK-8220374" target="_blank">JDK-8220374</a>), before that if you had
a counted loop, it could be compiled without any check for safepoint</li>
  <li><strong>swap</strong> - when your application thread executes some work in <em>thread_in_vm</em> state (after calling some native method),<br />
and during that execution, it waits for some pages to be swapped in/out, which can slow down reaching the safepoint</li>
</ul>

<p>The solution for the <strong>arraycopy</strong> issue is to copy larger arrays by some custom method, which might use <strong>arraycopy</strong> for smaller sub-arrays. 
It will be a bit slower, but it will not slow down the whole application when reaching a safepoint is required.</p>

<p>For the <strong>swap</strong> issue, just disable the swap.</p>

<h2 id="methods">Methods</h2>

<p>Async-profiler can instrument a method so that we can see all the stack traces with this method on the top.
To achieve that, async-profiler uses instrumentation.</p>

<p><strong>Big warning</strong>: It’s already pointed out in the README of the profiler that if you are not running
the profiler from <code class="language-plaintext highlighter-rouge">agentpath</code>, then the first instrumentation of a Java method can result in a code
cache flush. It’s not the fault of the async-profiler; it’s the nature of all instrumentation-based profilers 
combined with JVM’s code. Here is a comment from the <a href="https://github.com/openjdk/jdk/blob/master/src/hotspot/share/prims/jvmtiRedefineClasses.cpp#L4078" target="_blank">JVM sources</a>:</p>

<p>// Deoptimize all compiled code that depends on the classes redefined.
//
// If the can_redefine_classes capability is obtained in the onload
// phase then the compiler has recorded all dependencies from startup.
// In that case we need only deoptimize and throw away all compiled code
// that depends on the class.
//
// If can_redefine_classes is obtained sometime after the onload
// phase then the dependency information may be incomplete. In that case
// the first call to RedefineClasses causes all compiled code to be
// thrown away. As can_redefine_classes has been obtained then
// all future compilations will record dependencies so second and
// subsequent calls to RedefineClasses need only throw away code
// that depends on the class.</p>

<p>You can check the <a href="https://github.com/jvm-profiling-tools/async-profiler/pull/483#discussion_r735019623" target="_blank">README PR</a>
discussion for more information on this topic. But let’s focus on the usage of the mode for our purposes.
In this case, we could easily do it with a plain IDE debugger, but there are situations where something
is happening only in one environment, or we are tracing some issues we do not know how to reproduce.</p>

<p>Since Spring beans are usually created during applications startup, let’s run our application that way:</p>

<div class="language-shell highlighter-rouge"><div class="highlight"><pre class="highlight"><code>java <span class="se">\</span>
<span class="nt">-agentpath</span>:/path/to/libasyncProfiler.so<span class="o">=</span>start,event<span class="o">=</span><span class="s2">"org.springframework.web.filter.AbstractRequestLoggingFilter.&lt;init&gt;"</span> <span class="se">\</span>
<span class="nt">-jar</span> first-application/target/first-application-0.0.1-SNAPSHOT.jar
</code></pre></div></div>

<p>The <code class="language-plaintext highlighter-rouge">AbstractRequestLoggingFilter.&lt;init&gt;</code> is simply a constructor. We are trying to find out
where such an object is created. After our application is started, we can execute such a command
in the profiler directory:</p>

<div class="language-shell highlighter-rouge"><div class="highlight"><pre class="highlight"><code>./profiler.sh stop first-application-0.0.1-SNAPSHOT.jar
</code></pre></div></div>

<p>It will print us to one stack trace:</p>

<div class="language-shell highlighter-rouge"><div class="highlight"><pre class="highlight"><code><span class="nt">---</span> Execution profile <span class="nt">---</span>
Total samples       : 1

<span class="nt">---</span> 1 calls <span class="o">(</span>100.00%<span class="o">)</span>, 1 sample
  <span class="o">[</span> 0] org.springframework.web.filter.AbstractRequestLoggingFilter.&lt;init&gt;
  <span class="o">[</span> 1] org.springframework.web.filter.CommonsRequestLoggingFilter.&lt;init&gt;
  <span class="o">[</span> 2] com.example.firstapplication.examples.alloc.AllocConfiguration<span class="nv">$1</span>.&lt;init&gt;
  <span class="o">[</span> 3] com.example.firstapplication.examples.alloc.AllocConfiguration.requestLoggingFilter
  <span class="o">[</span> 4] com.example.firstapplication.examples.alloc.AllocConfiguration<span class="nv">$$</span>SpringCGLIB<span class="nv">$$</span>0.CGLIB<span class="nv">$requestLoggingFilter$0</span>
  <span class="o">[</span> 5] com.example.firstapplication.examples.alloc.AllocConfiguration<span class="nv">$$</span>SpringCGLIB<span class="nv">$$</span>2.invoke
...
  <span class="o">[</span>24] org.springframework.beans.factory.support.AbstractBeanFactory.getBean
...
  <span class="o">[</span>33] org.springframework.boot.web.embedded.tomcat.TomcatStarter.onStartup
...
  <span class="o">[</span>58] org.springframework.boot.web.embedded.tomcat.TomcatWebServer.&lt;init&gt;
...
  <span class="o">[</span>78] org.springframework.boot.loader.JarLauncher.main

       calls  percent  samples  top
  <span class="nt">----------</span>  <span class="nt">-------</span>  <span class="nt">-------</span>  <span class="nt">---</span>
           1  100.00%        1  org.springframework.web.filter.AbstractRequestLoggingFilter.&lt;init&gt;
</code></pre></div></div>

<p>We have all the information that we need. The object is created in <code class="language-plaintext highlighter-rouge">AllocConfiguration</code> during
creation of <code class="language-plaintext highlighter-rouge">CommonsRequestLoggingFilter</code> bean.</p>

<p>One of the other use cases where I used to use method profiling was finding memory leaks. 
I knew which types were leaking from the heap dump, and with method profiling, I could see where objects 
of these types were created. Consider this a fallback when the <a href="#alloc-live">dedicated mode</a> does
not work.</p>

<h2 id="methods-native">Native functions</h2>

<p>Not only can you trace Java code with the async-profiler but also a native one. That way of profiling doesn’t cause
deoptimizations.</p>

<p>Some native functions are worth a better look; let’s cover them quickly.</p>

<h3 id="methods-ex">Exceptions</h3>

<p>How many exceptions should be thrown if your application works without any outage/downtime and everything is stable? Exceptions should be thrown if something unexpected happens.
Unfortunately, I saw an application that used the exception-control-flow approach
more common in languages like Python. Creating a new
exception is a CPU-intensive operation since, by default, it fills the stack trace. 
I once saw an application that consumed <strong>~15%</strong> of its CPU time on just
creating new exceptions. You can use async-profiler in method mode with 
event <code class="language-plaintext highlighter-rouge">Java_java_lang_Throwable_fillInStackTrace</code> if you want to see where exceptions are created.</p>

<p>Let’s start our application with profiler enabled from the start to see also how many
exceptions are thrown during the startup of a Spring Boot application, just for fun:</p>

<div class="language-shell highlighter-rouge"><div class="highlight"><pre class="highlight"><code>java <span class="se">\</span>
<span class="nt">-agentpath</span>:/path/to/libasyncProfiler.so<span class="o">=</span>start,jfr,file<span class="o">=</span>exceptions.jfr,event<span class="o">=</span><span class="s2">"Java_java_lang_Throwable_fillInStackTrace"</span> <span class="se">\</span>
<span class="nt">-jar</span> first-application/target/first-application-0.0.1-SNAPSHOT.jar
</code></pre></div></div>

<p>After the startup, let’s run:</p>

<div class="language-shell highlighter-rouge"><div class="highlight"><pre class="highlight"><code>ab <span class="nt">-n</span> 100 <span class="nt">-c</span> 1 http://localhost:8081/examples/exc/
./profiler.sh stop <span class="nt">-f</span> exceptions.jfr first-application-0.0.1-SNAPSHOT.jar
</code></pre></div></div>

<p>The flame graph is too large to post it here as an image, sorry. Spring Boot, in that case,
threw <strong>12478</strong> exceptions. You can play with <a href="/assets/async-demos/exceptions.html" target="_blank">HTML</a>.
Let’s focus on our synthetic controller:</p>

<p><img src="/assets/async-demos/exceptions.png" alt="alt text" title="flames" /></p>

<p>Source code of the controller:</p>
<div class="language-java highlighter-rouge"><div class="highlight"><pre class="highlight"><code><span class="nd">@GetMapping</span><span class="o">(</span><span class="s">"/"</span><span class="o">)</span>
<span class="nc">String</span> <span class="nf">flowControl</span><span class="o">()</span> <span class="o">{</span>
    <span class="nc">ThreadLocalRandom</span> <span class="n">random</span> <span class="o">=</span> <span class="nc">ThreadLocalRandom</span><span class="o">.</span><span class="na">current</span><span class="o">();</span>
    <span class="k">try</span> <span class="o">{</span>
        <span class="k">if</span> <span class="o">(!</span><span class="n">random</span><span class="o">.</span><span class="na">nextBoolean</span><span class="o">())</span> <span class="o">{</span>
            <span class="k">throw</span> <span class="k">new</span> <span class="nf">IllegalArgumentException</span><span class="o">(</span><span class="s">"Random returned false"</span><span class="o">);</span>
        <span class="o">}</span>
    <span class="o">}</span> <span class="k">catch</span> <span class="o">(</span><span class="nc">IllegalArgumentException</span> <span class="n">e</span><span class="o">)</span> <span class="o">{</span>
        <span class="k">return</span> <span class="s">"EXC"</span><span class="o">;</span>
    <span class="o">}</span>

    <span class="k">return</span> <span class="s">"OK"</span><span class="o">;</span>
<span class="o">}</span>
</code></pre></div></div>

<p>If you care about performance, don’t use the exception-control-flow approach. If you really need such a code,
reuse exception options like ANTLR or create an exception constructor that doesn’t fill the stack trace:</p>

<div class="language-java highlighter-rouge"><div class="highlight"><pre class="highlight"><code><span class="cm">/**
 * Constructs a new exception with the specified detail message,
 * cause, suppression enabled or disabled, and writable stack
 * trace enabled or disabled.
 *
 * @param  message the detail message.
 * @param cause the cause.  (A {@code null} value is permitted,
 * and indicates that the cause is nonexistent or unknown.)
 * @param enableSuppression whether or not suppression is enabled
 *                          or disabled
 * @param writableStackTrace whether or not the stack trace should
 *                           be writable
 * @since 1.7
 */</span>
<span class="kd">protected</span> <span class="nf">Exception</span><span class="o">(</span><span class="nc">String</span> <span class="n">message</span><span class="o">,</span> <span class="nc">Throwable</span> <span class="n">cause</span><span class="o">,</span>
                    <span class="kt">boolean</span> <span class="n">enableSuppression</span><span class="o">,</span>
                    <span class="kt">boolean</span> <span class="n">writableStackTrace</span><span class="o">)</span> <span class="o">{</span>
    <span class="kd">super</span><span class="o">(</span><span class="n">message</span><span class="o">,</span> <span class="n">cause</span><span class="o">,</span> <span class="n">enableSuppression</span><span class="o">,</span> <span class="n">writableStackTrace</span><span class="o">);</span>
<span class="o">}</span>
</code></pre></div></div>

<p>Just set <code class="language-plaintext highlighter-rouge">writableStackTrace</code> to <code class="language-plaintext highlighter-rouge">false</code>. It will be rather ugly but faster.</p>

<h3 id="methods-g1ha">G1GC humongous allocation</h3>

<p>We already saw how to detect humongous objects with allocation mode. Since
async-profiler can also instrument JVM code, and allocations of a humongous objects are 
nothing else than invocations of C++ code, we can take advantage of that.
If you want to check where humongous objects are allocated, you can use native functions mode
with event <code class="language-plaintext highlighter-rouge">G1CollectedHeap::humongous_obj_allocate</code>. This approach may have lower
overhead but won’t give you sizes of allocated objects.</p>

<div class="language-shell highlighter-rouge"><div class="highlight"><pre class="highlight"><code><span class="c"># little warmup</span>
ab <span class="nt">-n</span> 2 <span class="nt">-c</span> 1 http://localhost:8081/examples/alloc/

<span class="c"># profiling time</span>
./profiler.sh start <span class="nt">-e</span> <span class="s2">"G1CollectedHeap::humongous_obj_allocate"</span> <span class="nt">-f</span> humongous.jfr first-application-0.0.1-SNAPSHOT.jar
ab <span class="nt">-n</span> 1000 <span class="nt">-c</span> 1 http://localhost:8081/examples/alloc/
./profiler.sh stop <span class="nt">-f</span> humongous.jfr first-application-0.0.1-SNAPSHOT.jar
</code></pre></div></div>

<p>The flame graph is almost the same as in <code class="language-plaintext highlighter-rouge">alloc</code> mode; we can see some JVM yellow frames this time too:
(<a href="/assets/async-demos/humongous.html" target="_blank">HTML</a>)</p>

<p><img src="/assets/async-demos/humongous.png" alt="alt text" title="flames" /></p>

<h3 id="methods-thread">Thread start</h3>

<p>Starting a platform thread is an expensive operation too. The number of started 
threads can be easily monitored with any JMX-based monitoring tool like JMC. Here is the MBean
with the value of all the created threads:</p>

<div class="language-shell highlighter-rouge"><div class="highlight"><pre class="highlight"><code>java.lang:type<span class="o">=</span>Threading 
<span class="nv">attribute</span><span class="o">=</span>TotalStartedThreadCount
</code></pre></div></div>

<p>If you monitor that value and the chart like that:</p>

<p><img src="/assets/async-demos/threads-2.png" alt="alt text" title="threads" /></p>

<p>Then you might want to check who is creating those short-living threads:
We use async-profiler with the <code class="language-plaintext highlighter-rouge">JVM_StartThread</code> event in native functions mode for this purpose:</p>

<div class="language-shell highlighter-rouge"><div class="highlight"><pre class="highlight"><code><span class="c"># little warmup</span>
ab <span class="nt">-n</span> 100 <span class="nt">-c</span> 1 http://localhost:8081/examples/thread/

<span class="c"># profiling time</span>
./profiler.sh start <span class="nt">-e</span> <span class="s2">"JVM_StartThread"</span> <span class="nt">-f</span> threads.jfr first-application-0.0.1-SNAPSHOT.jar
ab <span class="nt">-n</span> 1000 <span class="nt">-c</span> 1 http://localhost:8081/examples/thread/
./profiler.sh stop <span class="nt">-f</span> threads.jfr first-application-0.0.1-SNAPSHOT.jar
</code></pre></div></div>

<p>The flame graph:
(<a href="/assets/async-demos/threads.html" target="_blank">HTML</a>)</p>

<p><img src="/assets/async-demos/threads-1.png" alt="alt text" title="flames" /></p>

<p>This flame graph is not really complicated. But it is only a small example.
In real life, such flame graphs are larger.</p>

<p>The code responsible for the thread creation observed in the flame graph is the following:</p>

<div class="language-java highlighter-rouge"><div class="highlight"><pre class="highlight"><code><span class="nd">@SneakyThrows</span>
<span class="nd">@GetMapping</span><span class="o">(</span><span class="s">"/"</span><span class="o">)</span>
<span class="nc">String</span> <span class="nf">doInNewThread</span><span class="o">()</span> <span class="o">{</span>
    <span class="nc">ExecutorService</span> <span class="n">threadPool</span> <span class="o">=</span> <span class="nc">Executors</span><span class="o">.</span><span class="na">newFixedThreadPool</span><span class="o">(</span><span class="mi">1</span><span class="o">);</span>
    <span class="k">return</span> <span class="n">threadPool</span><span class="o">.</span><span class="na">submit</span><span class="o">(()</span> <span class="o">-&gt;</span> <span class="o">{</span>
        <span class="k">return</span> <span class="s">"OK"</span><span class="o">;</span>
    <span class="o">}).</span><span class="na">get</span><span class="o">();</span>
<span class="o">}</span>
</code></pre></div></div>

<p>And yes, I saw such a pattern in a real production application. The intention was to have a
fixed thread pool and delegate tasks to it, but by mistake, someone created that pool for
every request.</p>

<h3 id="methods-classes">Class loading</h3>

<p>Similar to creating short-living threads, I saw an application that created plenty of
short-living class definitions. I know there are some use cases for such behavior,
But it has been an accident in this case. You can monitor the number of loaded classes
with JMX:</p>

<div class="language-shell highlighter-rouge"><div class="highlight"><pre class="highlight"><code>java.lang:type<span class="o">=</span>ClassLoading
<span class="nv">attribute</span><span class="o">=</span>TotalLoadedClassCount
</code></pre></div></div>

<p>There are some internals of the JVM, like reflection or debugging, which are used in a variety of frameworks, that can generate
new class definitions during runtime: So increasing that number (even after warmup) 
doesn’t mean that we have a problem already. But if <code class="language-plaintext highlighter-rouge">TotalLoadedClassCount</code> is much higher 
than <code class="language-plaintext highlighter-rouge">LoadedClassCount</code>, then we might have a problem. You can find the creator of those classes with method mode and 
the event: <code class="language-plaintext highlighter-rouge">Java_java_lang_ClassLoader_defineClass1</code>.</p>

<p>To be honest, I saw such an issue only once and cannot reproduce it now. Making a
synthetic example for this use-case seems wrong, so I will just keep you with the knowledge
that there is such a possibility, especially if you purposefully create classes dynamically.</p>

<h2 id="perf">Perf events</h2>

<p>Async-profiler can also help you with low-level diagnosis where you want to correlate perf
events with Java code:</p>

<ul>
  <li><code class="language-plaintext highlighter-rouge">context-switches</code> - to find out which parts of your Java code do context switching</li>
  <li><code class="language-plaintext highlighter-rouge">cache-misses</code> - which part of your code can stall due to cache misses - this information is harder to analyze if you have many
context switches</li>
  <li><code class="language-plaintext highlighter-rouge">LLC-load-misses</code>- which part of your code needs a lot of data directly from RAM which is not cached</li>
  <li>…</li>
</ul>

<p>I want to describe the three in more detail in the following.</p>

<h3 id="perf-cache">Cache misses</h3>

<p>Let’s return to the example with matrix multiplication from the <a href="#cpu-hard">CPU - a bit harder</a> section.
I usually start by looking at basic CPU performance counters to see what our CPU is doing in the slow and the fast multiplication.
This is the textbook example of cache misses and their importance for performance.
I like to start with the JMH test to profile the specific code properly.</p>

<p>I’ve prepared such a benchmark in the <code class="language-plaintext highlighter-rouge">jmh-suite</code> module. Let’s run it with the perf profiler:</p>

<div class="language-shell highlighter-rouge"><div class="highlight"><pre class="highlight"><code>java <span class="nt">-jar</span> jmh-suite/target/benchmarks.jar <span class="nt">-prof</span> perf
</code></pre></div></div>

<p>The fast algorithm (I’ve cut the output to the most interesting metrics):</p>

<div class="language-plaintext highlighter-rouge"><div class="highlight"><pre class="highlight"><code>         20 544,42 msec task-clock                       #    1,008 CPUs utilized          
    49 510 157 799      L1-dcache-loads                  #    2,410 G/sec                    (38,55%)
     9 300 675 824      L1-dcache-load-misses            #   18,79% of all L1-dcache accesses  (38,55%)
     1 635 877 333      LLC-loads                        #   79,626 M/sec                    (30,80%)
        27 833 149      LLC-load-misses                  #    1,70% of all LL-cache accesses  (30,76%)
</code></pre></div></div>

<p>The slow one:</p>

<div class="language-plaintext highlighter-rouge"><div class="highlight"><pre class="highlight"><code>         22 291,74 msec task-clock                       #    1,008 CPUs utilized          
    71 632 332 204      L1-dcache-loads                  #    3,213 G/sec                    (38,51%)
    29 718 804 848      L1-dcache-load-misses            #   41,49% of all L1-dcache accesses  (38,50%)
     6 909 042 687      LLC-loads                        #  309,937 M/sec                    (30,79%)
        10 043 405      LLC-load-misses                  #    0,15% of all LL-cache accesses  (30,79%)
</code></pre></div></div>

<p>The slower algorithm has <strong>three times</strong> more L1 data cache misses and over <strong>four times</strong> more last-level
cache loads. We can now use async-profiler in three different modes:</p>

<div class="language-shell highlighter-rouge"><div class="highlight"><pre class="highlight"><code>java <span class="nt">-jar</span> jmh-suite/target/benchmarks.jar <span class="nt">-prof</span> async:libPath<span class="o">=</span>/path/to/libasyncProfiler.so<span class="se">\;</span><span class="nv">event</span><span class="o">=</span>cache-misses<span class="se">\;</span><span class="nv">output</span><span class="o">=</span>jfr
java <span class="nt">-jar</span> jmh-suite/target/benchmarks.jar <span class="nt">-prof</span> async:libPath<span class="o">==</span>/path/to/libasyncProfiler.so<span class="se">\;</span><span class="nv">event</span><span class="o">=</span>L1-dcache-load-misses<span class="se">\;</span><span class="nv">output</span><span class="o">=</span>jfr
java <span class="nt">-jar</span> jmh-suite/target/benchmarks.jar <span class="nt">-prof</span> async:libPath<span class="o">==</span>/path/to/libasyncProfiler.so<span class="se">\;</span><span class="nv">event</span><span class="o">=</span>LLC-load-misses<span class="se">\;</span><span class="nv">output</span><span class="o">=</span>jfr
</code></pre></div></div>

<p>All three flame graphs are very similar; let’s take a look at <code class="language-plaintext highlighter-rouge">cache-misses</code>: (<a href="/assets/async-demos/cache-misses.html" target="_blank">HTML</a>)
<img src="/assets/async-demos/cache-misses.png" alt="alt text" title="flames" /></p>

<p>I added the line numbers this time, so we could see exactly where the problem was. <strong>~82%</strong> of cache misses
occurred in the same line:</p>

<div class="language-java highlighter-rouge"><div class="highlight"><pre class="highlight"><code><span class="n">sum</span> <span class="o">+=</span> <span class="n">a</span><span class="o">[</span><span class="n">i</span><span class="o">][</span><span class="n">k</span><span class="o">]</span> <span class="o">*</span> <span class="n">b</span><span class="o">[</span><span class="n">k</span><span class="o">][</span><span class="n">j</span><span class="o">];</span>
</code></pre></div></div>

<p>This line is nested inside three loops. The order of loops is <code class="language-plaintext highlighter-rouge">i, j, k</code>. If we unroll the last loop four times
we would get the following:</p>

<div class="language-java highlighter-rouge"><div class="highlight"><pre class="highlight"><code><span class="n">sum</span> <span class="o">+=</span> <span class="n">a</span><span class="o">[</span><span class="n">i</span><span class="o">][</span><span class="n">k</span> <span class="o">+</span> <span class="mi">0</span><span class="o">]</span> <span class="o">*</span> <span class="n">b</span><span class="o">[</span><span class="n">k</span> <span class="o">+</span> <span class="mi">0</span><span class="o">][</span><span class="n">j</span><span class="o">];</span>
<span class="n">sum</span> <span class="o">+=</span> <span class="n">a</span><span class="o">[</span><span class="n">i</span><span class="o">][</span><span class="n">k</span> <span class="o">+</span> <span class="mi">1</span><span class="o">]</span> <span class="o">*</span> <span class="n">b</span><span class="o">[</span><span class="n">k</span> <span class="o">+</span> <span class="mi">1</span><span class="o">][</span><span class="n">j</span><span class="o">];</span>
<span class="n">sum</span> <span class="o">+=</span> <span class="n">a</span><span class="o">[</span><span class="n">i</span><span class="o">][</span><span class="n">k</span> <span class="o">+</span> <span class="mi">2</span><span class="o">]</span> <span class="o">*</span> <span class="n">b</span><span class="o">[</span><span class="n">k</span> <span class="o">+</span> <span class="mi">2</span><span class="o">][</span><span class="n">j</span><span class="o">];</span>
<span class="n">sum</span> <span class="o">+=</span> <span class="n">a</span><span class="o">[</span><span class="n">i</span><span class="o">][</span><span class="n">k</span> <span class="o">+</span> <span class="mi">3</span><span class="o">]</span> <span class="o">*</span> <span class="n">b</span><span class="o">[</span><span class="n">k</span> <span class="o">+</span> <span class="mi">3</span><span class="o">][</span><span class="n">j</span><span class="o">];</span>
</code></pre></div></div>

<p>Let’s look at this code from a memory layout perspective. The array <code class="language-plaintext highlighter-rouge">a[i]</code> is a contiguous part of memory. That’s how Java
allocates arrays. Elements <code class="language-plaintext highlighter-rouge">a[i][k + 0]</code> … <code class="language-plaintext highlighter-rouge">a[i][k + 3]</code> are very close to each other and are loaded 
sequentially. The CPU loads small blocks of memory from RAM into the cache if the block is not already there.
Accessing data in a sequential pattern is, therefore, far less expensive.</p>

<p>The access pattern to table  <code class="language-plaintext highlighter-rouge">b</code> is completely different. The <code class="language-plaintext highlighter-rouge">b[k + x]</code> is just a pointer to a table. It is 
somewhere on the heap, but where exactly? Well, we cannot control that. Element <code class="language-plaintext highlighter-rouge">b[k + 0][j]</code> may be in a completely
different place than <code class="language-plaintext highlighter-rouge">b[k + 1][j]</code>. That’s unfortunate for the CPU. This is why the speed difference between 
both matrix multiplications is not as large as expected.</p>

<p>Memory access patterns are the key here. The <code class="language-plaintext highlighter-rouge">matrixMultiplyFaster</code> algorithm accesses the table <code class="language-plaintext highlighter-rouge">a</code> mostly sequentially, which is why it’s faster.</p>

<p>I don’t want to go into detail about what is happening in the CPU with these algorithms. This post aims to teach the usage of async-profiler, not CPU architecture and algorithm engineering. If you want to go deeper with that knowledge, a very
good book for a start is 
<a href="https://book.easyperf.net/perf_book" target="_blank">Denis Bakhvalov - Performance Analysis and Tuning on Modern CPUs</a>.
It’s not about Java, but I cannot recommend any Java-centric book related to CPU architecture, as it’s still a relatively niche topic.
I know that two very good performance engineers are writing one now. When it is published, I will paste a link here.</p>

<h3 id="perf-pf">Page faults</h3>

<p><img src="/assets/async-demos/page-fault-1.png" alt="alt text" title="page" /></p>

<p>Every process running on Linux contains its own virtual memory. If a process needs more
memory, it invokes functions like <code class="language-plaintext highlighter-rouge">malloc</code> or <code class="language-plaintext highlighter-rouge">mmap</code>. The OS guarantees the returned memory to be readable/writable by the current process.
But this does not mean that any block of physical RAM has been reserved for the process.</p>

<p>The OS is smart enough to decide whether that fault should be converted into a SEGFAULT or should trigger the kernel
to map RAM to the process’s virtual memory because it was previously promised to the process.</p>

<p>Java is a process from an OS perspective, nothing less, nothing more. Knowing that we can trace
<code class="language-plaintext highlighter-rouge">page fault</code> events to detect why our application consumes more RAM. It may be a native memory 
leak or some framework/library/JVM bug.</p>

<p>But this is not perfect for tracing leaks since it shows every request for additional RAM,
including ones that may be freed in the future. <del>I know that Andrei Pangin is working
on a native memory leak detector that will trace allocations that haven’t been freed, but for
now, that feature is not in the latest release.</del></p>

<p>As an example, let’s run our application with and without <code class="language-plaintext highlighter-rouge">-XX:+AlwaysPreTouch</code>,
forcing the JVM to access all allocated memory after requesting it from the OS.
This allows us to find where Java needs more RAM after startup. We will use the heap memory leak that we used
before:</p>

<div class="language-shell highlighter-rouge"><div class="highlight"><pre class="highlight"><code>java <span class="nt">-Xmx1G</span> <span class="nt">-Xms1G</span> <span class="nt">-XX</span>:+AlwaysPreTouch <span class="se">\</span>
<span class="nt">-jar</span> first-application/target/first-application-0.0.1-SNAPSHOT.jar
</code></pre></div></div>

<p>In the other console, let’s do the following:</p>

<div class="language-shell highlighter-rouge"><div class="highlight"><pre class="highlight"><code>ab <span class="nt">-n</span> 10000 <span class="nt">-c</span> 4 http://localhost:8081/examples/leak/do-leak

./profiler.sh start <span class="nt">-e</span> page-faults <span class="nt">-f</span> page-faults-apt-on.jfr first-application-0.0.1-SNAPSHOT.jar
ab <span class="nt">-n</span> 1000000 <span class="nt">-c</span> 4 http://localhost:8081/examples/leak/do-leak
./profiler.sh stop <span class="nt">-f</span> page-faults-apt-on.jfr first-application-0.0.1-SNAPSHOT.jar
</code></pre></div></div>

<p>Now let’s do the same without <code class="language-plaintext highlighter-rouge">-XX:+AlwaysPreTouch</code>:</p>

<div class="language-shell highlighter-rouge"><div class="highlight"><pre class="highlight"><code>java <span class="nt">-Xmx1G</span> <span class="nt">-Xms1G</span> <span class="se">\</span>
<span class="nt">-jar</span> first-application/target/first-application-0.0.1-SNAPSHOT.jar
</code></pre></div></div>

<p>In the other console, let’s execute the following:</p>

<div class="language-shell highlighter-rouge"><div class="highlight"><pre class="highlight"><code>ab <span class="nt">-n</span> 10000 <span class="nt">-c</span> 4 http://localhost:8081/examples/leak/do-leak

./profiler.sh start <span class="nt">-e</span> page-faults <span class="nt">-f</span> page-faults-apt-off.jfr first-application-0.0.1-SNAPSHOT.jar
ab <span class="nt">-n</span> 1000000 <span class="nt">-c</span> 4 http://localhost:8081/examples/leak/do-leak
./profiler.sh stop <span class="nt">-f</span> page-faults-apt-off.jfr first-application-0.0.1-SNAPSHOT.jar
</code></pre></div></div>

<p>Flame graph without <code class="language-plaintext highlighter-rouge">-XX:+AlwaysPreTouch</code>: (<a href="/assets/async-demos/page-faults-apt-off.html" target="_blank">HTML</a>)
<img src="/assets/async-demos/page-faults-apt-off.png" alt="alt text" title="flames" /></p>

<p>Most of the need for additional RAM is acquired in GC threads, but there are some page faults in our Java code
(big green flame). These page faults can hurt your performance and make your latency less
predictable.</p>

<p>Flame graph with <code class="language-plaintext highlighter-rouge">-XX:+AlwaysPreTouch</code>: (<a href="/assets/async-demos/page-faults-apt-on.html" target="_blank">HTML</a>)
<img src="/assets/async-demos/page-faults-apt-on.png" alt="alt text" title="flames" /></p>

<p>Almost all the frames needing additional RAM now belong to compiler threads. This is due
the code heap growing with the compilation of new methods.</p>

<p>I was able to isolate and recreate the memory leak that I described in
<a href="https://bugs.openjdk.org/browse/JDK-8240723" target="_blank">JDK-8240723</a> with that mode.</p>

<h3 id="perf-cycles">Cycles</h3>

<p>If you need better visibility of what your kernel is doing, then you may consider choosing the
<code class="language-plaintext highlighter-rouge">cycles</code> event instead of <code class="language-plaintext highlighter-rouge">cpu</code>. This may be useful for low-latency applications
or while chasing bugs in the kernel (those also exist). Let’s see the difference:</p>

<div class="language-shell highlighter-rouge"><div class="highlight"><pre class="highlight"><code><span class="c"># warmup</span>
curl <span class="nt">-v</span> http://localhost:8081/examples/cycles/

<span class="c"># profiling</span>
./profiler.sh start <span class="nt">-e</span> cpu <span class="nt">-f</span> cycles-cpu.jfr first-application-0.0.1-SNAPSHOT.jar
curl <span class="nt">-v</span> http://localhost:8081/examples/cycles/
./profiler.sh stop <span class="nt">-f</span> cycles-cpu.jfr first-application-0.0.1-SNAPSHOT.jar
./profiler.sh start <span class="nt">-e</span> cycles <span class="nt">-f</span> cycles-cycles.jfr first-application-0.0.1-SNAPSHOT.jar
curl <span class="nt">-v</span> http://localhost:8081/examples/cycles/
./profiler.sh stop <span class="nt">-f</span> cycles-cycles.jfr first-application-0.0.1-SNAPSHOT.jar
</code></pre></div></div>

<p>The flame graph for <code class="language-plaintext highlighter-rouge">cpu</code> profiling:
(<a href="/assets/async-demos/cycles-cpu.html" target="_blank">HTML</a>)</p>

<p><img src="/assets/async-demos/cycles-cpu.png" alt="alt text" title="flames" /></p>

<p>Corresponding profile for <code class="language-plaintext highlighter-rouge">cycles</code> event:
(<a href="/assets/async-demos/cycles-cycles.html" target="_blank">HTML</a>)</p>

<p><img src="/assets/async-demos/cycles-cycles.png" alt="alt text" title="flames" /></p>

<p>As we can see, the <code class="language-plaintext highlighter-rouge">cycles</code> profile is more detailed.</p>

<h2 id="nativemem">Native memory leaks</h2>

<p>With the <strong>4.0</strong> Async-profiler release, we can use the new <code class="language-plaintext highlighter-rouge">nativemem</code> mode which:</p>
<blockquote>
  <p>… records <code class="language-plaintext highlighter-rouge">malloc</code>, <code class="language-plaintext highlighter-rouge">realloc</code>, <code class="language-plaintext highlighter-rouge">calloc</code> and <code class="language-plaintext highlighter-rouge">free</code> calls with the addresses, so that allocations can be matched with frees.</p>
</blockquote>

<p>This mode is extremely helpful with native memory leak detection. I already wrote an
<a href="../../../2025/03/31/native.html" target="_blank">article</a> on this topic. 
Now let’s just focus on usage of Async-profiler for a problem that I had in the past.</p>

<p>Our application is run with <em>1GB</em> fixed heap size:</p>

<div class="language-shell highlighter-rouge"><div class="highlight"><pre class="highlight"><code>java <span class="nt">-Xmx1G</span> <span class="nt">-Xms1G</span> <span class="nt">-XX</span>:+AlwaysPreTouch <span class="se">\</span>
<span class="nt">-jar</span> first-application/target/first-application-0.0.1-SNAPSHOT.jar
</code></pre></div></div>

<p>This native memory “leak” I want to show you is correlated with AWS S3 uploads. To make it easier to recreate let’s run <em>localstacks</em> on our PC and create a proper bucket and a file to upload:</p>

<div class="language-shell highlighter-rouge"><div class="highlight"><pre class="highlight"><code>docker run <span class="nt">--rm</span> <span class="nt">-it</span> <span class="nt">-p</span> 4566:4566 <span class="nt">-p</span> 4571:4571 localstack/localstack
aws <span class="nt">--endpoint-url</span><span class="o">=</span>http://localhost:4566 s3 mb s3://temp-bucket
<span class="nb">dd </span><span class="k">if</span><span class="o">=</span>/dev/zero <span class="nv">of</span><span class="o">=</span>/tmp/to_upload.tmp <span class="nv">bs</span><span class="o">=</span>1M <span class="nv">count</span><span class="o">=</span>15
</code></pre></div></div>

<p>Let’s invoke our app:</p>

<div class="language-shell highlighter-rouge"><div class="highlight"><pre class="highlight"><code>ab <span class="nt">-n</span> 1  http://localhost:8081/examples/aws/upload
</code></pre></div></div>

<p>Now let’s check how much memory is used by the application from an OS perspective:</p>

<div class="language-shell highlighter-rouge"><div class="highlight"><pre class="highlight"><code>jcmd first-application-0.0.1-SNAPSHOT.jar GC.run
smem <span class="nt">-c</span> <span class="s2">"pid command rss pss"</span> <span class="nt">-a</span> <span class="nt">-P</span> <span class="s2">"first-application-0.0.1-SNAPSHOT.jar"</span>
</code></pre></div></div>

<p>The output:</p>
<div class="language-plaintext highlighter-rouge"><div class="highlight"><pre class="highlight"><code>  PID Command                                                       RSS     PSS 
18206 /home/pasq/JDK/amazon-corretto-17.0.1.12.1-linux-x64/bin/ 1388836 1372957 
</code></pre></div></div>

<p>Let’s invoke more of this endpoint with the profiler attached (the <code class="language-plaintext highlighter-rouge">profiler.sh</code> script is gone, we now use <code class="language-plaintext highlighter-rouge">asprof</code> executable):</p>

<div class="language-shell highlighter-rouge"><div class="highlight"><pre class="highlight"><code>./asprof start <span class="nt">-e</span> nativemem <span class="nt">-f</span> nativemem.jfr first-application-0.0.1-SNAPSHOT.jar
ab <span class="nt">-n</span> 200 <span class="nt">-c</span> 10 http://localhost:8081/examples/aws/upload
jcmd first-application-0.0.1-SNAPSHOT.jar GC.run
./asprof stop <span class="nt">-f</span> nativemem.jfr first-application-0.0.1-SNAPSHOT.jar
</code></pre></div></div>

<p>Let’s check how much memory is used now:</p>

<div class="language-shell highlighter-rouge"><div class="highlight"><pre class="highlight"><code>smem <span class="nt">-c</span> <span class="s2">"pid command rss pss"</span> <span class="nt">-a</span> <span class="nt">-P</span> <span class="s2">"first-application-0.0.1-SNAPSHOT.jar"</span>
</code></pre></div></div>

<p>The output:</p>
<div class="language-plaintext highlighter-rouge"><div class="highlight"><pre class="highlight"><code>  PID Command                                                       RSS     PSS 
18206 /home/pasq/JDK/amazon-corretto-17.0.1.12.1-linux-x64/bin/ 1632140 1616206 
</code></pre></div></div>

<p>We can clearly see that both RSS and PSS grew. Let’s see what data were gathered by the profiler. Let’s convert <em>JFR</em> to a flame graph first:</p>
<div class="language-shell highlighter-rouge"><div class="highlight"><pre class="highlight"><code>./jfrconv <span class="nt">--total</span> <span class="nt">--nativemem</span> <span class="nt">--leak</span> nativemem.jfr nativemem.html
</code></pre></div></div>

<p>(<a href="/assets/async-demos/nativemem.html" target="_blank">HTML</a>)</p>

<p><img src="/assets/async-demos/nativemem.png" alt="alt text" title="flames" /></p>

<p>We can see that <code class="language-plaintext highlighter-rouge">nativemem</code> mode blames the <code class="language-plaintext highlighter-rouge">AwsService.upload</code> method for the “leak”. In the HTML version you can see also other AWS-related allocations without any Java stack traces,
but let’s focus on our code:</p>

<div class="language-java highlighter-rouge"><div class="highlight"><pre class="highlight"><code><span class="kt">void</span> <span class="nf">upload</span><span class="o">()</span> <span class="o">{</span>
    <span class="nc">S3CrtAsyncClientBuilder</span> <span class="n">s3CrtAsyncClientBuilder</span> <span class="o">=</span> <span class="nc">S3AsyncClient</span><span class="o">.</span><span class="na">crtBuilder</span><span class="o">()</span>
            <span class="o">.</span><span class="na">endpointOverride</span><span class="o">(</span><span class="k">new</span> <span class="no">URI</span><span class="o">(</span><span class="s">"http://127.0.0.1:4566"</span><span class="o">))</span>
            <span class="o">.</span><span class="na">credentialsProvider</span><span class="o">(</span><span class="nc">StaticCredentialsProvider</span><span class="o">.</span><span class="na">create</span><span class="o">(</span><span class="nc">AwsBasicCredentials</span><span class="o">.</span><span class="na">create</span><span class="o">(</span><span class="no">ACCESS_KEY_ID</span><span class="o">,</span> <span class="no">SECRET_ACCESS_KEY</span><span class="o">)))</span>
            <span class="o">.</span><span class="na">region</span><span class="o">(</span><span class="no">REGION</span><span class="o">);</span>

    <span class="k">try</span> <span class="o">(</span><span class="nc">S3AsyncClient</span> <span class="n">s3Client</span> <span class="o">=</span> <span class="n">s3CrtAsyncClientBuilder</span><span class="o">.</span><span class="na">build</span><span class="o">())</span> <span class="o">{</span>
        <span class="n">s3Client</span>
                <span class="o">.</span><span class="na">putObject</span><span class="o">(</span>
                        <span class="n">req</span> <span class="o">-&gt;</span> <span class="n">req</span><span class="o">.</span><span class="na">bucket</span><span class="o">(</span><span class="no">BUCKET</span><span class="o">).</span><span class="na">key</span><span class="o">(</span><span class="no">NAME</span><span class="o">),</span>
                        <span class="nc">AsyncRequestBody</span><span class="o">.</span><span class="na">fromFile</span><span class="o">(</span><span class="nc">Paths</span><span class="o">.</span><span class="na">get</span><span class="o">(</span><span class="no">FILE_TO_UPLOAD</span><span class="o">)))</span>
                <span class="o">.</span><span class="na">join</span><span class="o">();</span>
    <span class="o">}</span>
<span class="o">}</span>
</code></pre></div></div>

<p>We can also see (on the flame graph) that the native memory allocation was done in the <code class="language-plaintext highlighter-rouge">DefaultS3CrtClientBuilder.build</code> method. That line is covered with <code class="language-plaintext highlighter-rouge">try-with-resources</code>,
so the <code class="language-plaintext highlighter-rouge">close</code> method on the returned object should be invoked automatically. The method is invoked, but it doesn’t clean all the native allocations done by the builder. 
This issue I found with <em>AWS S3</em> libraries with the following versions:</p>

<div class="language-xml highlighter-rouge"><div class="highlight"><pre class="highlight"><code><span class="nt">&lt;dependency&gt;</span>
    <span class="nt">&lt;groupId&gt;</span>software.amazon.awssdk<span class="nt">&lt;/groupId&gt;</span>
    <span class="nt">&lt;artifactId&gt;</span>s3<span class="nt">&lt;/artifactId&gt;</span>
    <span class="nt">&lt;version&gt;</span>2.25.23<span class="nt">&lt;/version&gt;</span>
<span class="nt">&lt;/dependency&gt;</span>
<span class="nt">&lt;dependency&gt;</span>
    <span class="nt">&lt;groupId&gt;</span>software.amazon.awssdk.crt<span class="nt">&lt;/groupId&gt;</span>
    <span class="nt">&lt;artifactId&gt;</span>aws-crt<span class="nt">&lt;/artifactId&gt;</span>
    <span class="nt">&lt;version&gt;</span>0.29.14<span class="nt">&lt;/version&gt;</span>
<span class="nt">&lt;/dependency&gt;</span>
</code></pre></div></div>

<p>The behavior may vary with different versions. You can check how it looks with the newest ones.</p>

<h2 id="single-req">Filtering single request</h2>

<h3 id="single-req-why">Why aggregated results are not enough</h3>

<p>So far, we have been looking at the profile of a whole application. But what if the app works well
but there are some slower requests from time to time, and we want to know why? In such an application,
where one request is handled by one thread, we can extract the profile of a single request. The JFR file contains
all the information needed; we just need to filter them out. To do it, we need to have a log
that will tell us which thread was responsible for the execution of the request at the time of the
execution. Tomcat, embedded into Spring Boot, has access logs with all that information.</p>

<p>I configured our example application with access logs in the format:</p>

<div class="language-shell highlighter-rouge"><div class="highlight"><pre class="highlight"><code><span class="o">[</span>%t] <span class="o">[</span>%r] <span class="o">[</span>%s] <span class="o">[</span>%D ms] <span class="o">[</span>%I]
</code></pre></div></div>

<p>Here is a short explanation of that magic:</p>
<ul>
  <li><code class="language-plaintext highlighter-rouge">%t</code> - time of finishing handling of the request</li>
  <li><code class="language-plaintext highlighter-rouge">%r</code> - requested URI</li>
  <li><code class="language-plaintext highlighter-rouge">%s</code> - response status code</li>
  <li><code class="language-plaintext highlighter-rouge">%D</code> - duration time in milliseconds</li>
  <li><code class="language-plaintext highlighter-rouge">%I</code> - thread that handled request</li>
</ul>

<p>Let’s see it in action.</p>

<div class="language-shell highlighter-rouge"><div class="highlight"><pre class="highlight"><code><span class="c"># warmup</span>
ab <span class="nt">-n</span> 20 <span class="nt">-c</span> 4 http://localhost:8081/examples/filtering/

<span class="c"># profiling of the first request</span>
./profiler.sh start <span class="nt">-e</span> wall <span class="nt">-f</span> filtering.jfr first-application-0.0.1-SNAPSHOT.jar
ab <span class="nt">-n</span> 50 <span class="nt">-c</span> 4 http://localhost:8081/examples/filtering/
./profiler.sh stop <span class="nt">-f</span> filtering.jfr first-application-0.0.1-SNAPSHOT.jar
</code></pre></div></div>

<p>In the access logs, we can spot faster and slower requests:</p>

<div class="language-shell highlighter-rouge"><div class="highlight"><pre class="highlight"><code><span class="o">[</span>05/Dec/2022:18:41:57 +0100] <span class="o">[</span>GET /examples/filtering/ HTTP/1.0] <span class="o">[</span>200] <span class="o">[</span>1044 ms] <span class="o">[</span>http-nio-8081-exec-2]
<span class="o">[</span>05/Dec/2022:18:41:57 +0100] <span class="o">[</span>GET /examples/filtering/ HTTP/1.0] <span class="o">[</span>200] <span class="o">[</span>2779 ms] <span class="o">[</span>http-nio-8081-exec-5]
<span class="o">[</span>05/Dec/2022:18:41:58 +0100] <span class="o">[</span>GET /examples/filtering/ HTTP/1.0] <span class="o">[</span>200] <span class="o">[</span>1048 ms] <span class="o">[</span>http-nio-8081-exec-8]
<span class="o">[</span>05/Dec/2022:18:41:58 +0100] <span class="o">[</span>GET /examples/filtering/ HTTP/1.0] <span class="o">[</span>200] <span class="o">[</span>1052 ms] <span class="o">[</span>http-nio-8081-exec-9]
<span class="o">[</span>05/Dec/2022:18:41:59 +0100] <span class="o">[</span>GET /examples/filtering/ HTTP/1.0] <span class="o">[</span>200] <span class="o">[</span>2829 ms] <span class="o">[</span>http-nio-8081-exec-7]
<span class="o">[</span>05/Dec/2022:18:41:59 +0100] <span class="o">[</span>GET /examples/filtering/ HTTP/1.0] <span class="o">[</span>200] <span class="o">[</span>1058 ms] <span class="o">[</span>http-nio-8081-exec-1]
</code></pre></div></div>

<p>Let’s load the JFR into my viewer and look at the flame graph of the whole application:
(<a href="/assets/async-demos/filtering-1.html" target="_blank">HTML</a>)</p>

<p><img src="/assets/async-demos/filtering-1.png" alt="alt text" title="flames" /></p>

<p>It’s hard to guess why some requests are slower than others. We can see two different
methods executed at the top of the flame graph:</p>

<ul>
  <li><code class="language-plaintext highlighter-rouge">matrixMultiplySlow()</code></li>
  <li><code class="language-plaintext highlighter-rouge">matrixMultiplyFaster()</code></li>
</ul>

<p>We cannot conclude from that which one is responsible for worse latency. 
Let’s add filters to that graph to understand the latency of the second request from pasted access log:</p>

<div class="language-plaintext highlighter-rouge"><div class="highlight"><pre class="highlight"><code>[05/Dec/2022:18:41:57 +0100] [GET /examples/filtering/ HTTP/1.0] [200] [2779 ms] [http-nio-8081-exec-5]
</code></pre></div></div>

<ul>
  <li><em>Access log filter</em>:
    <ul>
      <li><em>End date</em> - <code class="language-plaintext highlighter-rouge">05/Dec/2022:18:41:57 +0100</code></li>
      <li><em>End date format</em> - let’s keep the default one</li>
      <li><em>Duration</em> - <code class="language-plaintext highlighter-rouge">2779</code></li>
      <li><em>Locale language</em> - <code class="language-plaintext highlighter-rouge">EN</code></li>
    </ul>
  </li>
  <li><em>Thread filter</em> - <code class="language-plaintext highlighter-rouge">http-nio-8081-exec-5</code></li>
</ul>

<p>Now the flame graph is obvious:
(<a href="/assets/async-demos/filtering-2.html" target="_blank">HTML</a>)</p>

<p><img src="/assets/async-demos/filtering-2.png" alt="alt text" title="flames" /></p>

<p>We can check this for a few more requests and figure out the following:</p>

<ul>
  <li>In every slow request, we executed <code class="language-plaintext highlighter-rouge">matrixMultiplySlow()</code></li>
  <li>In every fast request, we executed <code class="language-plaintext highlighter-rouge">matrixMultiplyFaster()</code></li>
</ul>

<p>This technique is great for dealing with the tail of the latency: We can focus our work on the longest
operations. That may lead us to some nice fixes.</p>

<h3 id="single-req-dns">Real-life example - DNS</h3>

<p>The point of the previous example was to show you why aggregated results can be useless for tracing
a single request. Now I want to show you a widespread issue I have diagnosed a few times.</p>

<p>Spring Boot has a commonly used addition called Actuator. One of the
features of the Actuator is the health check endpoint. Under URI <code class="language-plaintext highlighter-rouge">/actuator/health</code>, you can get JSON
with information about the health of your application. That endpoint is sometimes used as a load
balancer probe. Let’s consider a multi-node cluster of our example application with a load
balancer in front of the cluster, which:</p>

<ul>
  <li>probes the actuator if the application is alive, expecting <code class="language-plaintext highlighter-rouge">"status" : "UP"</code> in the response JSON</li>
  <li>timeouts the probe after <strong>1 second</strong></li>
</ul>

<p>Now, I will do one hack in my local configuration to make this example work. It will be explained at the end
of this example.</p>

<p>Let’s find out what our IP is:</p>

<div class="language-shell highlighter-rouge"><div class="highlight"><pre class="highlight"><code><span class="nv">$ </span>ifconfig 

eth0: <span class="nv">flags</span><span class="o">=</span>4163&lt;UP,BROADCAST,RUNNING,MULTICAST&gt;  mtu 9001
        inet 172.31.36.53  netmask 255.255.240.0  broadcast 172.31.47.255
</code></pre></div></div>

<p>Let’s probe an actuator by this IP, not a <code class="language-plaintext highlighter-rouge">localhost</code> (without the hack described later, you cannot get the same results):</p>

<div class="language-shell highlighter-rouge"><div class="highlight"><pre class="highlight"><code>./profiler.sh start <span class="nt">-e</span> wall <span class="nt">-f</span> actuator.jfr first-application-0.0.1-SNAPSHOT.jar
ab <span class="nt">-n</span> 1000 http://172.31.36.53:8081/actuator/health <span class="c"># check your IP</span>
./profiler.sh stop <span class="nt">-f</span> actuator.jfr first-application-0.0.1-SNAPSHOT.jar
</code></pre></div></div>

<p>The result of <code class="language-plaintext highlighter-rouge">ab</code>:</p>

<div class="language-shell highlighter-rouge"><div class="highlight"><pre class="highlight"><code>Connection Times <span class="o">(</span>ms<span class="o">)</span>
              min  mean[+/-sd] median   max
Connect:        0    0   0.0      0       0
Processing:     0    5 158.1      0    5000
Waiting:        0    5 158.1      0    5000
Total:          0    5 158.1      0    5000

Percentage of the requests served within a specific <span class="nb">time</span> <span class="o">(</span>ms<span class="o">)</span>
  50%      0
  66%      0
  75%      0
  80%      0
  90%      0
  95%      0
  98%      0
  99%      1
 100%   5000 <span class="o">(</span>longest request<span class="o">)</span>
</code></pre></div></div>

<p>So almost all the actuator endpoints returned in <strong>0ms</strong>, but at least one lasted <strong>5s</strong>.
We can see one longer request in the access logs:</p>

<div class="language-shell highlighter-rouge"><div class="highlight"><pre class="highlight"><code><span class="o">[</span>08/DEC/2022:08:56:24 +0000] <span class="o">[</span>GET /actuator/health HTTP/1.0] <span class="o">[</span>200] <span class="o">[</span>0 ms] <span class="o">[</span>http-nio-8081-exec-7]
<span class="o">[</span>08/DEC/2022:08:56:24 +0000] <span class="o">[</span>GET /actuator/health HTTP/1.0] <span class="o">[</span>200] <span class="o">[</span>0 ms] <span class="o">[</span>http-nio-8081-exec-10]
<span class="o">[</span>08/DEC/2022:08:56:24 +0000] <span class="o">[</span>GET /actuator/health HTTP/1.0] <span class="o">[</span>200] <span class="o">[</span>0 ms] <span class="o">[</span>http-nio-8081-exec-3]
<span class="o">[</span>08/DEC/2022:08:56:24 +0000] <span class="o">[</span>GET /actuator/health HTTP/1.0] <span class="o">[</span>200] <span class="o">[</span>0 ms] <span class="o">[</span>http-nio-8081-exec-2]
<span class="o">[</span>08/DEC/2022:08:56:29 +0000] <span class="o">[</span>GET /actuator/health HTTP/1.0] <span class="o">[</span>200] <span class="o">[</span>4999 ms] <span class="o">[</span>http-nio-8081-exec-8]
<span class="o">[</span>08/DEC/2022:08:56:29 +0000] <span class="o">[</span>GET /actuator/health HTTP/1.0] <span class="o">[</span>200] <span class="o">[</span>0 ms] <span class="o">[</span>http-nio-8081-exec-5]
</code></pre></div></div>

<p>That <strong>5s</strong> response would make our load balancer remove that node (for some time) from a cluster. Let’s
use the same technique to find out what was the reason for that latency:
(<a href="/assets/async-demos/actuator.html" target="_blank">HTML</a>)</p>

<p><img src="/assets/async-demos/actuator.png" alt="alt text" title="flames" /></p>

<p>I highlighted the usage of the <code class="language-plaintext highlighter-rouge">RemoteIpFilter</code> class. Time for some explanations: When your requests are hitting 
your application, you can check the IP of the requester with the basic <code class="language-plaintext highlighter-rouge">HttpServletRequest</code> API. But if you have
a load balancer before your application, well, you get an IP of the load balancer, not the original requester.
Load balancers usually add HTTP headers to the request to avoid such confusion. The original IP is sent
in the <code class="language-plaintext highlighter-rouge">X-Forwarded-For</code> header. The <code class="language-plaintext highlighter-rouge">RemoteIpFilter</code> is a tool that makes our lives easier and makes the
<code class="language-plaintext highlighter-rouge">HttpServletRequest</code> API returns proper IP and so on.</p>

<p>Let’s get back to the flame graph. We can see that this filter creates an instance of <code class="language-plaintext highlighter-rouge">XForwardedRequest</code> 
that executes <code class="language-plaintext highlighter-rouge">RequestFacade.getLocalName()</code>, that in the end executes <code class="language-plaintext highlighter-rouge">Inet6AddressImpl.getHostByAddr()</code>.
The last method is trying to identify the hostname by the IP address. How can it be done? Well, we just need a 
request to DNS, nothing more. In that case, the DNS protocol uses UDP, not TCP. UDP is a protocol that, by design,
can lose packets. In Linux, the <code class="language-plaintext highlighter-rouge">resolv.conf</code> is responsible for configuring DNS and the related tools
deal with all the retransmissions and other problems.
Here is an excerpt of the <a href="https://www.man7.org/linux/man-pages/man5/resolv.conf.5.html" target="_blank">manual</a>:</p>

<div class="language-plaintext highlighter-rouge"><div class="highlight"><pre class="highlight"><code>timeout:n
       Sets  the amount of time the resolver will wait for a re‐
       sponse from a remote  name  server  before  retrying  the
       query  via  a different name server.  This may not be the
       total time taken by any resolver API call and there is no
       guarantee  that a single resolver API call maps to a sin‐
       gle  timeout.   Measured  in  seconds,  the  default   is
       RES_TIMEOUT (currently 5, see &lt;resolv.h&gt;).  The value for
       this option is silently capped to 30.
</code></pre></div></div>

<p>Long story short - the default timeout is <strong>5s</strong>. If your DNS request is lost, the tools related to <code class="language-plaintext highlighter-rouge">resolv.conf</code> will probe the next
<em>nameserver</em> after <strong>5s</strong>. That’s what is happening in our example and what I observed in quite a few Java applications. 
DNS is commonly used for DDoS attacks. Therefore you can easily have a firewall in your 
infrastructure that can drop some DNS packets by design.</p>

<p>The funny thing about <code class="language-plaintext highlighter-rouge">RemoteIpFilter</code> is that the result of that DNS probing is stored in the field <code class="language-plaintext highlighter-rouge">localName</code> which 
is not used later. So we are just making DNS requests for nothing. To avoid that problem, write
a filter that won’t fire DNS requests. <code class="language-plaintext highlighter-rouge">RemoteIpFilter</code> is open-source, so you can easily use it.
There is also <code class="language-plaintext highlighter-rouge">RemoteIpValve</code> that can be enabled by just an entry in the Spring Boot properties. It used
to have the same issue. I didn’t check if the issue is still present in Spring Boot 3; it might be fixed accidentally
with <a href="https://bz.apache.org/bugzilla/show_bug.cgi?id=57665" target="_blank">this bug fix</a> which introduced the
<code class="language-plaintext highlighter-rouge">changeLocalName</code> property. If you want to be sure, you need to check it yourself.</p>

<p>This is not the only DNS request that can be done 
by the Actuator health check. That endpoint also probes your databases, queues, and many other things. The same may happen if that probing
is done by DNS name.</p>

<p>About the hack. If you want to simulate not responsive DNS, you can add 72.66.115.13 (blackhole.webpagetest.org) 
as your nameserver. That one is designed to drop all the packets. On different Linux distributions, it is done differently. 
I just use an AWS instance with Amazon Linux distribution, and there I could just edit the <code class="language-plaintext highlighter-rouge">/etc/resolv.conf</code> file, but 
in distros like Ubuntu, that file is generated by other services; see <a href="https://ubuntu.com/server/docs/service-domain-name-service-dns" target="_blank">ubuntu.com</a> for more information.</p>

<h2 id="continuous">Continuous profiling</h2>

<p>Let’s now focus on a different problem: We had some performance degradation/outage in our system one hour ago.
What can we do? The problem is gone, so attaching a profiler now won’t help us much. We can start profiling 
and wait for the problem to occur again, but maybe we can inspire ourselves with a concept used
in the aviation business.</p>

<p><img src="/assets/async-demos/cont-1.png" alt="alt text" title="cont" /></p>

<p>In case of an airplane disaster, what is the plane owner doing? Are they adding logs or attaching instruments to the airplane and waiting 
for the next crash? No, the aviation business has a flight recorder on every plane.</p>

<p><img src="/assets/async-demos/cont-2.png" alt="alt text" title="cont" /></p>

<p>This box records all available data it can during the flight. After any disaster, the data are ready to be analyzed.
Can we apply a similar approach to Java profiling? Yes, we can. We can have a profiler attached 24/7 dumping the data
every fixed interval of time. If anything detrimental happens to our application, we have the data that we can analyze.</p>

<p>From my personal experience, continuous profiling is the best technique to diagnose degradations
and outages efficiently. It is also handy to understand why the performance differs
between two versions of the same application. You only need to get profiles of the previous version from your archives and compare them to the current one.</p>

<p>Here are the ways of enabling async-profiler in continuous mode:</p>

<h3 id="continuous-bash">Command line</h3>

<p>Here is the simplest way to run async-profiler in continuous mode (dump a profile every <strong>60 seconds</strong> in <strong>wall</strong> mode):</p>

<div class="language-shell highlighter-rouge"><div class="highlight"><pre class="highlight"><code><span class="k">while </span><span class="nb">true
</span><span class="k">do
	</span><span class="nv">CURRENT_DATE</span><span class="o">=</span><span class="sb">`</span><span class="nb">date</span> +%F_%T<span class="sb">`</span>
	./profiler.sh <span class="nt">-e</span> wall <span class="nt">-f</span> out-<span class="nv">$CURRENT_DATE</span>.jfr <span class="nt">-d</span> 60 &lt;pid or application name&gt; 
<span class="k">done</span>
</code></pre></div></div>

<p>It looks dirt simple because it is, but I used that loop many times. Async-profiler includes this with the <code class="language-plaintext highlighter-rouge">--loop</code> option since version 2.6 in its <code class="language-plaintext highlighter-rouge">profiler.sh</code> script:</p>

<div class="language-shell highlighter-rouge"><div class="highlight"><pre class="highlight"><code>./profiler.sh <span class="nt">-e</span> wall <span class="nt">--loop</span> 1m <span class="nt">-f</span> profile-%t.jfr &lt;pid or application name&gt;
</code></pre></div></div>

<h3 id="continuous-java">Java</h3>

<p>I already introduced the Java API of AsyncProfiler <a href="#how-to-java">here</a>. To do it continuously, you can create a thread
that is executing:</p>

<div class="language-java highlighter-rouge"><div class="highlight"><pre class="highlight"><code><span class="nc">AsyncProfiler</span> <span class="n">asyncProfiler</span> <span class="o">=</span> <span class="nc">AsyncProfiler</span><span class="o">.</span><span class="na">getInstance</span><span class="o">();</span>

<span class="nc">DateTimeFormatter</span> <span class="n">formatter</span> <span class="o">=</span> <span class="nc">DateTimeFormatter</span><span class="o">.</span><span class="na">ofPattern</span><span class="o">(</span><span class="s">"yyyy-MM-dd_HH:mm:ss"</span><span class="o">);</span>

<span class="k">while</span> <span class="o">(</span><span class="kc">true</span><span class="o">)</span> <span class="o">{</span>
    <span class="nc">String</span> <span class="n">date</span> <span class="o">=</span> <span class="n">formatter</span><span class="o">.</span><span class="na">format</span><span class="o">(</span><span class="nc">LocalDateTime</span><span class="o">.</span><span class="na">now</span><span class="o">());</span>
    <span class="n">asyncProfiler</span><span class="o">.</span><span class="na">execute</span><span class="o">(</span>
        <span class="nc">String</span><span class="o">.</span><span class="na">format</span><span class="o">(</span><span class="s">"start,jfr,event=wall,file=out-%s.jfr"</span><span class="o">,</span> <span class="n">date</span><span class="o">)</span>
    <span class="o">);</span>
    <span class="nc">Thread</span><span class="o">.</span><span class="na">sleep</span><span class="o">(</span><span class="mi">60</span> <span class="o">*</span> <span class="mi">1000</span><span class="o">);</span>
    <span class="n">asyncProfiler</span><span class="o">.</span><span class="na">execute</span><span class="o">(</span>
        <span class="nc">String</span><span class="o">.</span><span class="na">format</span><span class="o">(</span><span class="s">"stop,file=out-%s.jfr"</span><span class="o">,</span> <span class="n">date</span><span class="o">)</span>
    <span class="o">);</span>
<span class="o">}</span>
</code></pre></div></div>

<h3 id="continuous-spring">Spring boot</h3>

<p>If you have a Spring/SpringBoot application, you can use a starter written by Michał Rowicki and me:</p>

<div class="language-xml highlighter-rouge"><div class="highlight"><pre class="highlight"><code><span class="nt">&lt;dependency&gt;</span>
    <span class="nt">&lt;groupId&gt;</span>com.github.krzysztofslusarski<span class="nt">&lt;/groupId&gt;</span>
    <span class="nt">&lt;artifactId&gt;</span>continuous-async-profiler-spring-starter<span class="nt">&lt;/artifactId&gt;</span>
    <span class="nt">&lt;version&gt;</span>2.1<span class="nt">&lt;/version&gt;</span>
<span class="nt">&lt;/dependency&gt;</span>
</code></pre></div></div>

<p>Read the <strong><a href="https://github.com/krzysztofslusarski/continuous-async-profiler" target="_blank">README</a></strong> to get more details.</p>

<h2 id="context-id">Contextual profiling</h2>

<p>Continuous profiling, together with the possibility to extract a profile of a single request, is very
powerful. Unfortunately, there are applications where that is not enough. Some examples:</p>

<ul>
  <li>Any work that is delegated to a different thread will be missed in that profile</li>
  <li>If one request is computed by multiple threads/JVMs, we need to combine multiple profiles</li>
  <li>Applications in a distributed architecture, usually with microservices:<br />
There are usually remote calls to other services, even if every single request is processed by a single thread.</li>
</ul>

<p>We can extract a profile for each microservice to understand the request processing behavior in such a distributed architecture. This is doable but consumes a lot of time.</p>

<p>All the problems mentioned above can be covered by <strong>contextual profiling</strong>. The concept is pretty simple:
Whenever any thread is executing any work, that work is done in some context, usually in the context
of a single request. Instead of just doing that work, we do the following:</p>

<div class="language-java highlighter-rouge"><div class="highlight"><pre class="highlight"><code><span class="kt">long</span> <span class="n">span</span> <span class="o">=</span> <span class="nc">Span</span><span class="o">.</span><span class="na">start</span><span class="o">();</span>
<span class="n">actualWork</span><span class="o">();</span>
<span class="nc">Span</span><span class="o">.</span><span class="na">end</span><span class="o">(</span><span class="n">span</span><span class="o">,</span> <span class="n">contextId</span><span class="o">);</span>
</code></pre></div></div>

<p>The profiler will store span details in the JFR file. Span is a very simple structure. It contains details about
thread that was executing the span, start time and duration. That’s all we need to correlate the span with all
samples gathered in the <code class="language-plaintext highlighter-rouge">actualWork()</code>.</p>

<h3 id="context-id-spring">Spring Boot microservices</h3>

<p>Let’s try to join Spring Boot microservices with contextual profiling. In Spring Boot 3.0
we have included <strong>Micrometer Tracing</strong>. One of its functionalities is generating a <strong>context ID</strong> 
(called <code class="language-plaintext highlighter-rouge">traceId</code>) for every request. That <code class="language-plaintext highlighter-rouge">traceId</code> is passed during the execution to
other Spring Boot microservices. We just need to pass that <code class="language-plaintext highlighter-rouge">traceId</code> to the async-profiler
and we are done.</p>

<p>Ok, let’s integrate it with the async-profiler. This time I will use the Java API:</p>

<div class="language-java highlighter-rouge"><div class="highlight"><pre class="highlight"><code><span class="kd">public</span> <span class="kd">abstract</span> <span class="kd">class</span> <span class="nc">AsyncProfilerUtils</span> <span class="o">{</span>
    <span class="kd">private</span> <span class="kd">static</span> <span class="kd">volatile</span> <span class="nc">AsyncProfiler</span> <span class="n">asyncProfiler</span><span class="o">;</span>
    <span class="c1">// ...</span>

    <span class="kd">public</span> <span class="kd">static</span> <span class="nc">AsyncProfiler</span> <span class="nf">load</span><span class="o">()</span> <span class="o">{</span>
        <span class="c1">// Lazy load with double-checked locking</span>
        <span class="k">return</span> <span class="n">asyncProfiler</span><span class="o">;</span>
    <span class="o">}</span>

    <span class="kd">public</span> <span class="kd">static</span> <span class="kt">void</span> <span class="nf">start</span><span class="o">(</span><span class="nc">String</span> <span class="n">filename</span><span class="o">)</span> <span class="kd">throws</span> <span class="nc">IOException</span> <span class="o">{</span>
        <span class="n">load</span><span class="o">().</span><span class="na">execute</span><span class="o">(</span><span class="s">"start,jfr,event=wall,file="</span> <span class="o">+</span> <span class="n">filename</span><span class="o">);</span>
    <span class="o">}</span>

    <span class="kd">public</span> <span class="kd">static</span> <span class="kt">void</span> <span class="nf">stop</span><span class="o">(</span><span class="nc">String</span> <span class="n">filename</span><span class="o">)</span> <span class="kd">throws</span> <span class="nc">IOException</span> <span class="o">{</span>
        <span class="n">load</span><span class="o">().</span><span class="na">execute</span><span class="o">(</span><span class="s">"stop,jfr,event=wall,file="</span> <span class="o">+</span> <span class="n">filename</span><span class="o">);</span>
    <span class="o">}</span>
<span class="o">}</span>
</code></pre></div></div>

<p>I load the profiler from using  <code class="language-plaintext highlighter-rouge">AsyncProfiler.getInstance()</code> and use <strong>wall-clock</strong> mode; I believe it is the
most suitable mode for most enterprise applications.</p>

<p>To integrate the profiler with the Micrometer Tracing, we need to implement <code class="language-plaintext highlighter-rouge">ObservationHandler</code>:</p>

<div class="language-java highlighter-rouge"><div class="highlight"><pre class="highlight"><code><span class="kd">public</span> <span class="kd">class</span> <span class="nc">AsyncProfilerObservationHandler</span> <span class="kd">implements</span> <span class="nc">ObservationHandler</span><span class="o">&lt;</span><span class="nc">Observation</span><span class="o">.</span><span class="na">Context</span><span class="o">&gt;</span> <span class="o">{</span>
    <span class="kd">private</span> <span class="kd">static</span> <span class="kd">final</span> <span class="nc">ThreadLocal</span><span class="o">&lt;</span><span class="nc">TraceContext</span><span class="o">&gt;</span> <span class="no">LOCAL_TRACE_CONTEXT</span> <span class="o">=</span> <span class="k">new</span> <span class="nc">ThreadLocal</span><span class="o">&lt;&gt;();</span>
    <span class="kd">private</span> <span class="kd">static</span> <span class="kd">final</span> <span class="nc">ThreadLocal</span><span class="o">&lt;</span><span class="nc">Long</span><span class="o">&gt;</span> <span class="no">LOCAL_SPAN_START_TIME</span> <span class="o">=</span> <span class="k">new</span> <span class="nc">ThreadLocal</span><span class="o">&lt;&gt;();</span>

    <span class="nd">@Override</span>
    <span class="kd">public</span> <span class="kt">boolean</span> <span class="nf">supportsContext</span><span class="o">(</span><span class="nc">Observation</span><span class="o">.</span><span class="na">Context</span> <span class="n">context</span><span class="o">)</span> <span class="o">{</span>
        <span class="k">return</span> <span class="kc">true</span><span class="o">;</span>
    <span class="o">}</span>

    <span class="nd">@Override</span>
    <span class="kd">public</span> <span class="kt">void</span> <span class="nf">onStart</span><span class="o">(</span><span class="nc">Observation</span><span class="o">.</span><span class="na">Context</span> <span class="n">context</span><span class="o">)</span> <span class="o">{</span>
        <span class="nc">TracingContext</span> <span class="n">tracingContext</span> <span class="o">=</span> <span class="n">context</span><span class="o">.</span><span class="na">get</span><span class="o">(</span><span class="nc">TracingContext</span><span class="o">.</span><span class="na">class</span><span class="o">);</span>
        <span class="nc">TraceContext</span> <span class="n">traceContext</span> <span class="o">=</span> <span class="n">tracingContext</span><span class="o">.</span><span class="na">getSpan</span><span class="o">().</span><span class="na">context</span><span class="o">();</span>
        <span class="nc">TraceContext</span> <span class="n">currentTraceContext</span> <span class="o">=</span> <span class="no">LOCAL_TRACE_CONTEXT</span><span class="o">.</span><span class="na">get</span><span class="o">();</span>
        
        <span class="k">if</span> <span class="o">(</span><span class="n">currentTraceContext</span> <span class="o">==</span> <span class="kc">null</span> <span class="o">||</span> <span class="o">!</span><span class="n">currentTraceContext</span><span class="o">.</span><span class="na">traceId</span><span class="o">().</span><span class="na">equals</span><span class="o">(</span><span class="n">traceContext</span><span class="o">.</span><span class="na">traceId</span><span class="o">()))</span> <span class="o">{</span>
            <span class="no">LOCAL_TRACE_CONTEXT</span><span class="o">.</span><span class="na">set</span><span class="o">(</span><span class="n">traceContext</span><span class="o">);</span>
            <span class="no">LOCAL_SPAN_START_TIME</span><span class="o">.</span><span class="na">set</span><span class="o">(</span><span class="nc">Span</span><span class="o">.</span><span class="na">start</span><span class="o">());</span>
        <span class="o">}</span>
    <span class="o">}</span>
    
    <span class="nd">@Override</span>
    <span class="kd">public</span> <span class="kt">void</span> <span class="nf">onError</span><span class="o">(</span><span class="nc">Observation</span><span class="o">.</span><span class="na">Context</span> <span class="n">context</span><span class="o">)</span> <span class="o">{</span>
    <span class="o">}</span>
    
    <span class="nd">@Override</span>
    <span class="kd">public</span> <span class="kt">void</span> <span class="nf">onEvent</span><span class="o">(</span><span class="nc">Observation</span><span class="o">.</span><span class="na">Event</span> <span class="n">event</span><span class="o">,</span> <span class="nc">Observation</span><span class="o">.</span><span class="na">Context</span> <span class="n">context</span><span class="o">)</span> <span class="o">{</span>
    <span class="o">}</span>
    
    <span class="nd">@Override</span>
    <span class="kd">public</span> <span class="kt">void</span> <span class="nf">onStop</span><span class="o">(</span><span class="nc">Observation</span><span class="o">.</span><span class="na">Context</span> <span class="n">context</span><span class="o">)</span> <span class="o">{</span>
        <span class="nc">TracingContext</span> <span class="n">tracingContext</span> <span class="o">=</span> <span class="n">context</span><span class="o">.</span><span class="na">get</span><span class="o">(</span><span class="nc">TracingContext</span><span class="o">.</span><span class="na">class</span><span class="o">);</span>
        <span class="nc">TraceContext</span> <span class="n">traceContext</span> <span class="o">=</span> <span class="n">tracingContext</span><span class="o">.</span><span class="na">getSpan</span><span class="o">().</span><span class="na">context</span><span class="o">();</span>
        <span class="nc">TraceContext</span> <span class="n">currentTraceContext</span> <span class="o">=</span> <span class="no">LOCAL_TRACE_CONTEXT</span><span class="o">.</span><span class="na">get</span><span class="o">();</span>
        <span class="nc">Long</span> <span class="n">spanStartTime</span> <span class="o">=</span> <span class="no">LOCAL_SPAN_START_TIME</span><span class="o">.</span><span class="na">get</span><span class="o">();</span>
        <span class="k">if</span> <span class="o">(</span><span class="n">currentTraceContext</span> <span class="o">!=</span> <span class="kc">null</span> <span class="o">&amp;&amp;</span> <span class="n">spanStartTime</span> <span class="o">!=</span> <span class="kc">null</span> <span class="o">&amp;&amp;</span> <span class="n">currentTraceContext</span><span class="o">.</span><span class="na">spanId</span><span class="o">().</span><span class="na">equals</span><span class="o">(</span><span class="n">traceContext</span><span class="o">.</span><span class="na">spanId</span><span class="o">()))</span> <span class="o">{</span>
            <span class="no">LOCAL_TRACE_CONTEXT</span><span class="o">.</span><span class="na">remove</span><span class="o">();</span>
            <span class="no">LOCAL_SPAN_START_TIME</span><span class="o">.</span><span class="na">remove</span><span class="o">();</span>
            <span class="nc">Span</span><span class="o">.</span><span class="na">end</span><span class="o">(</span><span class="n">spanStartTime</span><span class="o">,</span> <span class="n">traceContext</span><span class="o">.</span><span class="na">traceId</span><span class="o">());</span>
        <span class="o">}</span>
    <span class="o">}</span>
<span class="o">}</span>
</code></pre></div></div>

<p><strong>Big warning</strong>: Don’t treat that class as production ready. It’s suitable for that example
but will not work with any asynchronous/reactive calls. Mind that <code class="language-plaintext highlighter-rouge">onStart/onStop</code>
can be called multiple times with the same <code class="language-plaintext highlighter-rouge">traceId</code> and different <code class="language-plaintext highlighter-rouge">spanId</code>.</p>

<p>Now we need to register that implementation:</p>

<div class="language-java highlighter-rouge"><div class="highlight"><pre class="highlight"><code><span class="nd">@Bean</span>
<span class="nd">@Profile</span><span class="o">(</span><span class="s">"context"</span><span class="o">)</span>
<span class="nc">ObservedAspect</span> <span class="nf">observedAspect</span><span class="o">(</span><span class="nc">ObservationRegistry</span> <span class="n">observationRegistry</span><span class="o">)</span> <span class="o">{</span>
    <span class="n">observationRegistry</span><span class="o">.</span><span class="na">observationConfig</span><span class="o">().</span><span class="na">observationHandler</span><span class="o">(</span><span class="k">new</span> <span class="nc">AsyncProfilerObservationHandler</span><span class="o">());</span>
    <span class="k">return</span> <span class="k">new</span> <span class="nf">ObservedAspect</span><span class="o">(</span><span class="n">observationRegistry</span><span class="o">);</span>
<span class="o">}</span>
</code></pre></div></div>

<p>That will also register us using the <code class="language-plaintext highlighter-rouge">@Observed</code> aspect.</p>

<p>And that’s it. Let’s try it out. We need to rerun the Spring Boot applications with active profiling:</p>

<div class="language-shell highlighter-rouge"><div class="highlight"><pre class="highlight"><code>java <span class="nt">-Xms1G</span> <span class="nt">-Xmx1G</span> <span class="se">\</span>
<span class="nt">-Dspring</span>.profiles.active<span class="o">=</span>context <span class="se">\</span>
<span class="nt">-XX</span>:+UnlockDiagnosticVMOptions <span class="nt">-XX</span>:+DebugNonSafepoints <span class="se">\</span>
<span class="nt">-jar</span> first-application/target/first-application-0.0.1-SNAPSHOT.jar 

java <span class="nt">-Xms1G</span> <span class="nt">-Xmx1G</span> <span class="se">\</span>
<span class="nt">-Dspring</span>.profiles.active<span class="o">=</span>context <span class="se">\</span>
<span class="nt">-jar</span> second-application/target/second-application-0.0.1-SNAPSHOT.jar

java <span class="nt">-Xms1G</span> <span class="nt">-Xmx1G</span> <span class="se">\</span>
<span class="nt">-Dspring</span>.profiles.active<span class="o">=</span>context <span class="se">\</span>
<span class="nt">-jar</span> third-application/target/third-application-0.0.1-SNAPSHOT.jar
</code></pre></div></div>

<div class="language-shell highlighter-rouge"><div class="highlight"><pre class="highlight"><code><span class="c"># little warmup</span>
ab <span class="nt">-n</span> 24 <span class="nt">-c</span> 1 http://localhost:8081/examples/context/observe

<span class="c"># profiling time - this time, we start profiler from Java</span>
curl <span class="nt">-v</span> http://localhost:8081/examples/context/start
curl <span class="nt">-v</span> http://localhost:8082/examples/context/start
curl <span class="nt">-v</span> http://localhost:8083/examples/context/start

ab <span class="nt">-n</span> 24 <span class="nt">-c</span> 1 http://localhost:8081/examples/context/observe

<span class="c"># stopping the profiler</span>
curl <span class="nt">-v</span> http://localhost:8081/examples/context/stop
curl <span class="nt">-v</span> http://localhost:8082/examples/context/stop
curl <span class="nt">-v</span> http://localhost:8083/examples/context/stop
</code></pre></div></div>

<p>Let’s look at the timings during profiling. I’ve cut the output to 12 rows:</p>

<div class="language-shell highlighter-rouge"><div class="highlight"><pre class="highlight"><code><span class="o">[</span>26/lip/2026:19:13:58 +0200] <span class="o">[</span>GET /examples/context/observe HTTP/1.0] <span class="o">[</span>200] <span class="o">[</span>1593 ms] <span class="o">[</span>http-nio-8081-exec-2]
<span class="o">[</span>26/lip/2026:19:14:02 +0200] <span class="o">[</span>GET /examples/context/observe HTTP/1.0] <span class="o">[</span>200] <span class="o">[</span>3164 ms] <span class="o">[</span>http-nio-8081-exec-3]
<span class="o">[</span>26/lip/2026:19:14:05 +0200] <span class="o">[</span>GET /examples/context/observe HTTP/1.0] <span class="o">[</span>200] <span class="o">[</span>3094 ms] <span class="o">[</span>http-nio-8081-exec-4]
<span class="o">[</span>26/lip/2026:19:14:06 +0200] <span class="o">[</span>GET /examples/context/observe HTTP/1.0] <span class="o">[</span>200] <span class="o">[</span>1590 ms] <span class="o">[</span>http-nio-8081-exec-5]
<span class="o">[</span>26/lip/2026:19:14:08 +0200] <span class="o">[</span>GET /examples/context/observe HTTP/1.0] <span class="o">[</span>200] <span class="o">[</span>1590 ms] <span class="o">[</span>http-nio-8081-exec-6]
<span class="o">[</span>26/lip/2026:19:14:13 +0200] <span class="o">[</span>GET /examples/context/observe HTTP/1.0] <span class="o">[</span>200] <span class="o">[</span>4821 ms] <span class="o">[</span>http-nio-8081-exec-7]
<span class="o">[</span>26/lip/2026:19:14:14 +0200] <span class="o">[</span>GET /examples/context/observe HTTP/1.0] <span class="o">[</span>200] <span class="o">[</span>1589 ms] <span class="o">[</span>http-nio-8081-exec-8]
<span class="o">[</span>26/lip/2026:19:14:16 +0200] <span class="o">[</span>GET /examples/context/observe HTTP/1.0] <span class="o">[</span>200] <span class="o">[</span>1594 ms] <span class="o">[</span>http-nio-8081-exec-9]
<span class="o">[</span>26/lip/2026:19:14:19 +0200] <span class="o">[</span>GET /examples/context/observe HTTP/1.0] <span class="o">[</span>200] <span class="o">[</span>3086 ms] <span class="o">[</span>http-nio-8081-exec-10]
<span class="o">[</span>26/lip/2026:19:14:22 +0200] <span class="o">[</span>GET /examples/context/observe HTTP/1.0] <span class="o">[</span>200] <span class="o">[</span>3160 ms] <span class="o">[</span>http-nio-8081-exec-1]
<span class="o">[</span>26/lip/2026:19:14:24 +0200] <span class="o">[</span>GET /examples/context/observe HTTP/1.0] <span class="o">[</span>200] <span class="o">[</span>1585 ms] <span class="o">[</span>http-nio-8081-exec-2]
<span class="o">[</span>26/lip/2026:19:14:27 +0200] <span class="o">[</span>GET /examples/context/observe HTTP/1.0] <span class="o">[</span>200] <span class="o">[</span>3090 ms] <span class="o">[</span>http-nio-8081-exec-3]
</code></pre></div></div>

<p>We can see that we have three groups of timings:</p>
<ul>
  <li><code class="language-plaintext highlighter-rouge">~1500ms</code></li>
  <li><code class="language-plaintext highlighter-rouge">~3000ms</code></li>
  <li><code class="language-plaintext highlighter-rouge">~4800ms</code></li>
</ul>

<p>After we executed the script above, we had three JFR files in the <code class="language-plaintext highlighter-rouge">/tmp</code> directory. When we load all three files 
together to my viewer and check the <em>Span stats</em> section, we can see:</p>

<p><img src="/assets/async-demos/context-1.png" alt="alt text" title="context-1" /></p>

<p>So we have similar timings from our JFR files. Looking good. Let’s filter all the samples by context ID. It’s
called a <em>Span (equals)</em> in my viewer, let’s use a value <code class="language-plaintext highlighter-rouge">6a6640603d40ced403d3184933910cf8</code> which took <code class="language-plaintext highlighter-rouge">4821ms</code> 
according to records in the JFR. Let’s also add an additional <em>filename level</em>. The filename is correlated to
the application name. Here comes the flame graph: (<a href="/assets/async-demos/context-1.html" target="_blank">HTML</a>)</p>

<p><img src="/assets/async-demos/context-2.png" alt="alt text" title="flames" /></p>

<p>All three applications are on the same flame graph. This is beautiful. Just a reminder: it’s not a whole application.
It’s a <strong>single request</strong> presented here. I highlighted the <code class="language-plaintext highlighter-rouge">slowPath()</code> method
executed in the second and third app, which causes higher latency. You can play with the HTML flame graph 
to see what is happening there or jump into the code. I want to focus on what insights the context ID 
functionality gives us. Because there is more. We’ve already added an additional <em>filename level</em>. We can also
add timestamps as another level. Let’s do that. I will present you only the bottom of the graph since
that’s what is important here: (<a href="/assets/async-demos/context-2.html" target="_blank">HTML</a>)</p>

<p><img src="/assets/async-demos/context-3.png" alt="alt text" title="flames" /></p>

<p>The image may look blurred, but you can check the <a href="/assets/async-demos/context-2.html" target="_blank">HTML</a>
version for clarity. At the bottom, you can see five brown rectangles. Those are timestamps truncated to seconds
(in UTC and local TZ, that’s why there are 2 rows).
So from left to right, we can see what was happening to our request second by second. Let’s highlight
when the second application was running during that request:</p>

<p><img src="/assets/async-demos/context-4.png" alt="alt text" title="flames" /></p>

<p>And the third:</p>

<p><img src="/assets/async-demos/context-5.png" alt="alt text" title="flames" /></p>

<p>The first application is always running since it’s the entry point to our distributed architecture. The important code in the second application
is the following:</p>

<div class="language-java highlighter-rouge"><div class="highlight"><pre class="highlight"><code><span class="nd">@RequiredArgsConstructor</span>
<span class="kd">class</span> <span class="nc">ContextService</span> <span class="o">{</span>
    <span class="c1">// ...</span>
    <span class="kt">void</span> <span class="nf">doSomething</span><span class="o">()</span> <span class="o">{</span>
        <span class="k">if</span> <span class="o">(</span><span class="n">counter</span><span class="o">.</span><span class="na">incrementAndGet</span><span class="o">()</span> <span class="o">%</span> <span class="mi">3</span> <span class="o">==</span> <span class="mi">0</span><span class="o">)</span> <span class="o">{</span>
            <span class="n">slowPath</span><span class="o">();</span>
            <span class="k">return</span><span class="o">;</span>
        <span class="o">}</span>

        <span class="n">fastPath</span><span class="o">();</span>
    <span class="o">}</span>

    <span class="kd">private</span> <span class="kt">void</span> <span class="nf">fastPath</span><span class="o">()</span> <span class="o">{</span>
        <span class="c1">// ...</span>
    <span class="o">}</span>

    <span class="kd">private</span> <span class="kt">void</span> <span class="nf">slowPath</span><span class="o">()</span> <span class="o">{</span>
        <span class="c1">// ...</span>
    <span class="o">}</span>
<span class="o">}</span>
</code></pre></div></div>

<p>And the third application:</p>

<div class="language-java highlighter-rouge"><div class="highlight"><pre class="highlight"><code><span class="kd">class</span> <span class="nc">ContextService</span> <span class="o">{</span>
    <span class="c1">// ...</span>
    <span class="kt">void</span> <span class="nf">doSomething</span><span class="o">()</span> <span class="o">{</span>
        <span class="k">if</span> <span class="o">(</span><span class="n">counter</span><span class="o">.</span><span class="na">incrementAndGet</span><span class="o">()</span> <span class="o">%</span> <span class="mi">4</span> <span class="o">==</span> <span class="mi">0</span><span class="o">)</span> <span class="o">{</span>
            <span class="n">blackhole</span> <span class="o">=</span> <span class="n">slowPath</span><span class="o">();</span>
            <span class="k">return</span><span class="o">;</span>
        <span class="o">}</span>
        <span class="n">blackhole</span> <span class="o">=</span> <span class="n">fastPath</span><span class="o">();</span>
    <span class="o">}</span>

    <span class="kd">private</span> <span class="kt">int</span> <span class="nf">slowPath</span><span class="o">()</span> <span class="o">{</span>
        <span class="c1">// ...</span>
    <span class="o">}</span>

    <span class="kd">private</span> <span class="kt">int</span> <span class="nf">fastPath</span><span class="o">()</span> <span class="o">{</span>
        <span class="c1">// ...</span>
    <span class="o">}</span>
<span class="o">}</span>
</code></pre></div></div>

<p>So the second application is slower every third request, and the third application is slower every fourth request.
That means that for every twelfth request, we are slower in both of them.</p>

<p>I firmly believe that contextual profiling is the future in that area. Everything you see here should be taken with a grain of
salt. My Spring integration and my JFR viewer are far away from something professional. I want to inspire you to
search for new possibilities like that. If you find any, share it with the rest of the Java performance community.</p>

<h3 id="context-id-hz">Distributed systems</h3>

<p>First, let’s differentiate distributed architecture from distributed systems. For this post, let’s assume
the following:</p>

<ul>
  <li>a distributed architecture is a set of applications that works together - like microservices</li>
  <li>a distributed system is one application that is deployed on more than one JVM to service some request
it distributes the work to more than one instance</li>
</ul>

<p>One example of a distributed system may be Hazelcast. I’ve applied the span functionality to trace the tail of
the latency in SQL queries.</p>

<p>Sample benchmark details:</p>

<ul>
  <li>Hazelcast cluster size: <strong>4</strong></li>
  <li>Servers with <strong>Intel Xeon CPU E5-2687W</strong></li>
  <li>Heap size: <strong>10 GB</strong></li>
  <li><strong>JDK17</strong></li>
  <li>SQL query that is benchmarked: <code class="language-plaintext highlighter-rouge">select count(*) from iMap</code></li>
  <li>iMap size – <strong>1 million</strong> serialized Java objects</li>
  <li>Benchmark duration: <strong>8 minutes</strong></li>
</ul>

<p>The latency distribution for that benchmark is:</p>

<p><img src="/assets/distributed/dist.png" alt="alt text" title="dist" /></p>

<p>The <strong>50th</strong> percentile is <strong>1470 ms</strong>, whereas the <strong>99.9th</strong> is <strong>3718 ms</strong>. 
Let’s now analyze the <strong>JFR</strong> file with my tool.
I’ve created a table with the longest queries in the files:</p>

<p><img src="/assets/distributed/cid.png" alt="alt text" title="cid" /></p>

<p>Let’s analyze a single query using the span functionality. The full flame graph:</p>

<p><img src="/assets/distributed/1.png" alt="alt text" title="1" /></p>

<p>Let’s focus on the bottom rows:</p>

<p><img src="/assets/distributed/2.png" alt="alt text" title="2" /></p>

<p>Let’s start with timestamps and highlight them one by one:</p>

<p><img src="/assets/distributed/3.png" alt="alt text" title="3" />
<img src="/assets/distributed/4.png" alt="alt text" title="4" />
<img src="/assets/distributed/5.png" alt="alt text" title="5" />
<img src="/assets/distributed/6.png" alt="alt text" title="6" />
<img src="/assets/distributed/7.png" alt="alt text" title="7" /></p>

<p>Summing that up:</p>

<ul>
  <li><strong>41.91%</strong> of samples were gathered between 14:47:19 and 14:47:20</li>
  <li><strong>35.79%</strong> of samples were gathered between 14:47:20 and 14:47:21</li>
  <li><strong>6.68%</strong> of samples were gathered between 14:47:21 and 14:47:22</li>
  <li><strong>12.37%</strong> of samples were gathered between 14:47:22 and 14:47:23</li>
  <li><strong>3.34%</strong> of samples were gathered between 14:47:23 and 14:47:24</li>
</ul>

<p>Let’s highlight the filenames (which are named with the <strong>IP</strong> of the server) one by one:</p>

<p><img src="/assets/distributed/8.png" alt="alt text" title="8" />
<img src="/assets/distributed/9.png" alt="alt text" title="9" />
<img src="/assets/distributed/10.png" alt="alt text" title="10" />
<img src="/assets/distributed/11.png" alt="alt text" title="11" /></p>

<p>A little summary:</p>

<ul>
  <li><strong>25.42%</strong> of samples are from node 10.212.1.101</li>
  <li><strong>23,75%</strong> of samples are from node 10.212.1.102</li>
  <li><strong>21.07%</strong> of samples are from node 10.212.1.103</li>
  <li><strong>29.77%</strong> of samples are from node 10.212.1.104</li>
</ul>

<p>Since brown bars are sorted alphabetically by timestamps, we can conclude that the <strong>10.212.1.104</strong> server is doing any work
in the last seconds of processing.</p>

<p>I checked five more long latency requests and the results were the same, confirming that the <strong>10.212.1.104</strong> server is 
the problem. I spent a lot of time trying to figure out what was wrong with that machine. My biggest suspect was a 
difference in meltdown/spectre patches in the kernel. In the end, we reinstalled Linux on those machines, which solved
the problem with the <strong>10.212.1.104</strong> server.</p>

<h2 id="stability">Stability</h2>

<p>Attaching a profiler to a JVM can potentially cause it to crash. It’s essential to be aware of this risk, as bugs can occur not only in profilers but also in the JVM itself. The OpenJDK developers are working on improving the stability of the API used by profilers to minimize this risk. You can learn more about their work at:</p>

<ul>
  <li><a href="https://github.com/openjdk/jdk/pulls?q=is%3Apr+author%3Aparttimenerd" target="_blank">Johannes Bechberger</a></li>
  <li><a href="https://github.com/openjdk/jdk/pulls?q=is%3Apr+author%3Ajbachorik" target="_blank">Jaroslav Bachorik</a></li>
</ul>

<p>In my opinion, async-profiler is a very mature product already. I know a few companies
that are running async-profiler in continuous mode 24/7. Over two years, I only heard about one production crash caused by a profiler. It is working with <strong>40</strong> production JVMs, at least in wall-clock mode there. I have used async-profiler on multiple systems without crashes this year. While there is always some risk when attaching a profiler to a JVM, I believe the risk is minimal and can be safely ignored.</p>

<p>However, if you experience a profiler-related crash, I encourage you to file a GitHub issue to help improve the OpenJDK.
During the crash, the <code class="language-plaintext highlighter-rouge">hs_err.&lt;pid&gt;</code> file is generated. It may be beneficial for finding the root cause of a problem.</p>

<p>The main problem, according to Johannes Bechberger, stated in a recent <a href="https://openjdk.org/jeps/435" target="_blank">JEP proposal</a>, is that async-profiler uses the internal AsyncGetCallTrace API for stack walking. This API was introduced in November 2002 for Sun Studio but was removed in January 2003 and demoted to an internal API (<a href="https://docs.oracle.com/en/java/javase/17/docs/specs/jvmti.html#ChangeHistory" target="_blank">JVMTI</a>). It is neither exported in any header nor standardized. To this date, there is only one <a href="https://github.com/openjdk/jdk/tree/master/test/hotspot/jtreg/serviceability/AsyncGetCallTrace" target="_blank">tiny test</a> in the whole OpenJDK: The API might be broken with any version, Johannes Bechberger caught such an issue with <a href="https://github.com/openjdk/jdk/pull/7559" target="_blank">PR 7559</a> before the release. Be aware of this risk and test every JDK with your profiling setup before using it in production.</p>

<p>There is an ongoing effort by Johannes Bechberger, with the help of Jaroslav Bachorik and others, to improve this situation by proposing the new <a href="https://openjdk.org/jeps/435" target="_blank">AsyncGetStackTrace API</a>, that will hopefully be integrated into the OpenJDK. This API will be official, well-tested with stability and stress tests in the official OpenJDK test suite, and therefore more stable than AsyncGetCallTrace. It will also give the users of tools like async-profiler more information, like C/C++ frames between Java frames and inlining information for all Java frames. If you want to learn more, consider reading the <a href="https://openjdk.org/jeps/435" target="_blank">JEP</a> or visit the <a href="https://github.com/parttimenerd/asgct2-demo" target="_blank">demo repository</a> to see it in action.</p>

<p>Furthermore, many bugs have been found by both OpenJDK developers by using the <a href="https://github.com/parttimenerd/jdk-profiling-tester" target="_blank">JDK Profiling Tester</a> to find and fix many stability issues. There are currently no known real-world stability issues.</p>

<h2 id="overhead">Overhead</h2>

<p>In the application where the profiler is running in continuous mode on production the 
overhead (in terms of response time) is typically between <strong>0%</strong> and <strong>2%</strong>. That number is a comparison of response times 
before and after introducing continuous profiling there. A bit of context:</p>

<ul>
  <li>Spring and Spring Boot applications</li>
  <li>Mostly services that handle HTTP requests</li>
  <li>Not really CPU intensive - I would say that on average <strong>60%</strong> of the request time was spent off-CPU (waiting for DB/other service)</li>
  <li>JDK 11 and 17 - HotSpot from various vendors</li>
  <li>Wall-clock event, dump of JFR every minute from Java API</li>
  <li>Environment provided by VMware, both VMs and Tanzu clusters</li>
  <li>Async-profiler 1.8.x, later 2.8.x</li>
</ul>

<p>Johannes Bechberger shared his benchmark results with me. He used the
<a href="https://dacapobench.sourceforge.net/" target="_blank">DaCapo Benchmark Suite</a>:</p>

<ul>
  <li>ThreadRipper 3995WX with 128GB RAM</li>
  <li>Async-profiler 2.8.3</li>
  <li><code class="language-plaintext highlighter-rouge">dacapo benchmarks avrora fop h2 jython lusearch pmd -t 8 -n 3</code></li>
  <li>CPU event</li>
</ul>

<p>Johannes’s results shows <strong>~6%</strong> overhead on default sampling interval without <code class="language-plaintext highlighter-rouge">jfrsync</code> flag, and <strong>~7.5%</strong> with <code class="language-plaintext highlighter-rouge">jfrsync</code>. 
The chart for his results:</p>

<p><img src="/assets/async-demos/overhead.png" alt="alt text" title="chart" /></p>

<p>The logarithmic-scaled X-axis is the number of samples per second, and the Y-axis is the additional overhead.</p>

<p>Remember: <strong>You should always measure the overhead in your application by yourself and configure the profiling interval and captured events according to your specific needs.</strong>.</p>

<h2 id="random">Random thoughts</h2>

<ol>
  <li>You need to remember that EVERY profiler lies in some way. The async-profiler is vulnerable to
<a href="https://bugs.openjdk.org/browse/JDK-8281677" target="_blank">JDK-8281677</a>. There is nothing that the profiler
can do; JVM is lying to the profiler, so that lie is passed to the end user. You can change the mechanism
used by a profiler, but you will be lied to, maybe differently.</li>
  <li>You can run an async-profiler to collect more than one event. It is allowed to gather <code class="language-plaintext highlighter-rouge">lock</code> and <code class="language-plaintext highlighter-rouge">alloc</code>
together with one of the modes that gathers execution samples, like <code class="language-plaintext highlighter-rouge">cpu</code>, <code class="language-plaintext highlighter-rouge">method</code>, …</li>
  <li>You can run an async-profiler with the <code class="language-plaintext highlighter-rouge">jfrsync</code> option that will gather more information exposed 
by the JVM, but be aware to use the <code class="language-plaintext highlighter-rouge">alloc</code> option for information on allocations. This way, you can also
capture GC information and more.</li>
</ol>

<p>If you want to know more on this topic, consider the curated collection of blogs and other resources you find <a href="https://github.com/parttimenerd/jug-profiling-talk" target="_blank">here</a> and the <a href="https://www.youtube.com/playlist?list=PLLLT4NxU7U1QYiqanOw48h0VUjlUvqCCv" target="_blank">YouTube playlist</a> with in-depth talks on profiling. Consider contacting Johannes Bechberger, who curates both, if you have any suggestions.</p>]]></content><author><name></name></author><summary type="html"><![CDATA[[Java][Profiling] Async-profiler - manual by use cases]]></summary></entry><entry><title type="html">[Java][Profiling][Memory leak] Finding heap memory leaks with Async-profiler</title><link href="https://krzysztofslusarski.github.io/2022/11/27/async-live.html" rel="alternate" type="text/html" title="[Java][Profiling][Memory leak] Finding heap memory leaks with Async-profiler" /><published>2022-11-27T01:51:30+00:00</published><updated>2022-11-27T01:51:30+00:00</updated><id>https://krzysztofslusarski.github.io/2022/11/27/async-live</id><content type="html" xml:base="https://krzysztofslusarski.github.io/2022/11/27/async-live.html"><![CDATA[<h1 id="javaprofilingmemory-leak-finding-heap-memory-leaks-with-async-profiler">[Java][Profiling][Memory leak] Finding heap memory leaks with Async-profiler</h1>

<p><strong>Async-profiler 2.9</strong> was released. The brand-new feature is <code class="language-plaintext highlighter-rouge">live</code> mode, which can help you detect
heap memory leaks.</p>

<p>Let’s start with the definition:</p>

<blockquote>
  <p>Heap memory leak happens when in your application you have Java objects that are no longer needed for
program execution, but cannot be freed by garbage collector.</p>
</blockquote>

<h2 id="why-is-it-so-hard">Why is it so hard?</h2>

<p>If you have a heap memory leak in your application then you have two groups of objects:</p>

<p><img src="/assets/async-live/leak-1.png" alt="alt text" title="leak" /></p>

<ul>
  <li><strong>Live set</strong> - this is a group of objects that are still needed by your application</li>
  <li><strong>Memory leak</strong> - this is a group of objects that are no longer needed</li>
</ul>

<p>Garbage collectors cannot free the second group if there is at least one strong reference from <strong>live set</strong> to <strong>memory
leak</strong>. The biggest problems with diagnosis memory leaks are:</p>

<ul>
  <li>the fact that the object was created <strong>is not an issue</strong> - it was created because it was needed for something</li>
  <li>the fact that the mentioned reference was created <strong>is not an issue</strong> - it had some purpose too</li>
  <li>we need to understand why that reference was not removed by our application</li>
</ul>

<p>The last one is not trivial. All the observability/profiling tools give us a great possibility to understand why
some event has happened, but with memory leaks we need to understand why something hasn’t happened.</p>

<h2 id="tools">Tools</h2>

<p>Since there is no tool that would tell us why something is not happening we need to use our brain to find the
root cause of the problem. We can use two additional tools that can help us:</p>

<ul>
  <li><strong>heap dump</strong> - that shows us current state of a heap - we can find out what kind of objects are, but shouldn’t be
there</li>
  <li><strong>profiler</strong> - that shows us where those objects were created</li>
</ul>

<p>There were already profilers on a market that had a great feature of detecting where not freed objects were created.
Unfortunately they used instrumentation and the overhead was so big that they couldn’t be used in production. To
make use of them we needed memory leaks recreated on test or local environments.</p>

<p>Async-profiler uses different way of finding allocated objects (quote from it’s README):</p>

<blockquote>
  <p>async-profiler does not use intrusive techniques like bytecode instrumentation or expensive DTrace probes which have
significant performance impact. It also does not affect Escape Analysis or prevent from JIT optimizations like
allocation elimination. Only actual heap allocations are measured.</p>

  <p>The profiler features TLAB-driven sampling. It relies on HotSpot-specific callbacks to receive two kinds of
notifications:</p>

  <ul>
    <li>when an object is allocated in a newly created TLAB (aqua frames in a Flame Graph);</li>
    <li>when an object is allocated on a slow path outside TLAB (brown frames).</li>
  </ul>

  <p>This means not each allocation is counted, but only allocations every N kB, where N is the average size of TLAB. This
makes heap sampling very cheap and suitable for production. On the other hand, the collected data may be incomplete,
though in practice it will often reflect the top allocation sources.</p>
</blockquote>

<p>I used that feature on many production systems before. The <code class="language-plaintext highlighter-rouge">live</code> option adds a filter to present only objects
that haven’t been removed by GC.</p>

<h2 id="testing-application">Testing application</h2>

<p>Let’s create a simple Spring Boot application with memory leak, that is hard to find by just a heap dump:</p>

<div class="language-java highlighter-rouge"><div class="highlight"><pre class="highlight"><code><span class="nd">@RestController</span>
<span class="nd">@RequiredArgsConstructor</span>
<span class="nd">@RequestMapping</span><span class="o">(</span><span class="s">"/hard"</span><span class="o">)</span>
<span class="kd">class</span> <span class="nc">HardOne</span> <span class="o">{</span>
    <span class="kd">private</span> <span class="kd">final</span> <span class="nc">LeakOne</span> <span class="n">leakOne</span><span class="o">;</span>

    <span class="nd">@GetMapping</span>
    <span class="kt">void</span> <span class="nf">doIt</span><span class="o">()</span> <span class="o">{</span>
        <span class="nc">String</span> <span class="n">newOne</span> <span class="o">=</span> <span class="nc">RandomStringUtils</span><span class="o">.</span><span class="na">randomAlphabetic</span><span class="o">(</span><span class="mi">10000</span><span class="o">);</span>
        <span class="n">leakOne</span><span class="o">.</span><span class="na">doLeak</span><span class="o">(</span><span class="n">newOne</span><span class="o">);</span>
        <span class="nc">LeakTwo</span><span class="o">.</span><span class="na">doLeak</span><span class="o">(</span><span class="n">newOne</span><span class="o">);</span>
    <span class="o">}</span>
<span class="o">}</span>
</code></pre></div></div>

<div class="language-java highlighter-rouge"><div class="highlight"><pre class="highlight"><code><span class="nd">@Component</span>
<span class="kd">class</span> <span class="nc">LeakOne</span> <span class="o">{</span>
    <span class="kd">private</span> <span class="kd">final</span> <span class="nc">Set</span><span class="o">&lt;</span><span class="nc">String</span><span class="o">&gt;</span> <span class="n">leak</span> <span class="o">=</span> <span class="k">new</span> <span class="nc">HashSet</span><span class="o">&lt;&gt;();</span>

    <span class="kt">void</span> <span class="nf">doLeak</span><span class="o">(</span><span class="nc">String</span> <span class="n">s</span><span class="o">)</span> <span class="o">{</span>
        <span class="n">leak</span><span class="o">.</span><span class="na">add</span><span class="o">(</span><span class="n">s</span><span class="o">);</span>
    <span class="o">}</span>
<span class="o">}</span>
</code></pre></div></div>

<div class="language-java highlighter-rouge"><div class="highlight"><pre class="highlight"><code><span class="kd">class</span> <span class="nc">LeakTwo</span> <span class="o">{</span>
    <span class="kd">private</span> <span class="kd">static</span> <span class="kd">final</span> <span class="nc">Set</span><span class="o">&lt;</span><span class="nc">String</span><span class="o">&gt;</span> <span class="n">leak</span> <span class="o">=</span> <span class="k">new</span> <span class="nc">HashSet</span><span class="o">&lt;&gt;();</span>

    <span class="kd">static</span> <span class="kt">void</span> <span class="nf">doLeak</span><span class="o">(</span><span class="nc">String</span> <span class="n">s</span><span class="o">)</span> <span class="o">{</span>
        <span class="n">leak</span><span class="o">.</span><span class="na">add</span><span class="o">(</span><span class="n">s</span><span class="o">);</span>
    <span class="o">}</span>
<span class="o">}</span>
</code></pre></div></div>

<p>If we look at a heap dump after execution <code class="language-plaintext highlighter-rouge">http://localhost:8080/hard</code> 10k times we would see:</p>

<p><img src="/assets/async-live/leak-2.png" alt="alt text" title="leak" /></p>

<p>Usually I analyze heap dumps with potential memory leak in two easy steps:</p>

<ul>
  <li>I locate objects that shouldn’t be there</li>
  <li>I calculate <em>path to GC roots</em> to understand why they are still alive</li>
</ul>

<p>In that dump we can see the leaking <code class="language-plaintext highlighter-rouge">Strings</code>, but we cannot detect where they are held, since there is no
<strong>dominator</strong>. There are simply two <code class="language-plaintext highlighter-rouge">HashSets</code> that hold a strong reference to those leaked objects, so there is
no one guilty class. In such situations the allocation profiler is much more useful.</p>

<h2 id="lets-test-it">Let’s test it</h2>

<p>First let’s try simple allocation mode to see if the <code class="language-plaintext highlighter-rouge">live</code> option really does any change.</p>

<div class="language-shell highlighter-rouge"><div class="highlight"><pre class="highlight"><code>./profiler.sh <span class="nt">-e</span> alloc <span class="nt">--total</span> start LeakApplication
ab <span class="nt">-n</span> 10000 http://localhost:8080/hard 
./profiler.sh <span class="nt">-f</span> live.html stop LeakApplication
</code></pre></div></div>

<p>The result:</p>

<p><img src="/assets/async-live/leak-3.png" alt="alt text" title="leak" /></p>

<p>Now let’s add the <code class="language-plaintext highlighter-rouge">live</code> option:</p>

<div class="language-shell highlighter-rouge"><div class="highlight"><pre class="highlight"><code>./profiler.sh <span class="nt">-e</span> alloc <span class="nt">--live</span> <span class="nt">--total</span> start LeakApplication
ab <span class="nt">-n</span> 10000 http://localhost:8080/hard 
./profiler.sh <span class="nt">-f</span> live.html stop LeakApplication
</code></pre></div></div>

<p><img src="/assets/async-live/leak-4.png" alt="alt text" title="leak" /></p>

<p>We can see that the profile looks different, but we can also see allocations other than our memory leak. This is
done because GC hasn’t freed them yet. Let’s run a GC before capturing the results this time:</p>

<div class="language-shell highlighter-rouge"><div class="highlight"><pre class="highlight"><code>./profiler.sh <span class="nt">-e</span> alloc <span class="nt">--live</span> <span class="nt">--total</span> start LeakApplication
ab <span class="nt">-n</span> 10000 http://localhost:8080/hard 
jcmd LeakApplication GC.run
./profiler.sh <span class="nt">-f</span> live.html stop LeakApplication
</code></pre></div></div>

<p><img src="/assets/async-live/leak-5.png" alt="alt text" title="leak" /></p>

<p><strong>Perfect</strong>. Ladies and gentlemen, we have the first profiler that can help us detect heap memory leaks in our
production environment (at your own risk, of course). Thank you, Andrei Pangin.</p>]]></content><author><name></name></author><summary type="html"><![CDATA[[Java][Profiling][Memory leak] Finding heap memory leaks with Async-profiler]]></summary></entry><entry><title type="html">[Java][Profiling][Hazelcast] Performance tuning of Hazelcast SQL engine</title><link href="https://krzysztofslusarski.github.io/2022/08/25/hz-sql.html" rel="alternate" type="text/html" title="[Java][Profiling][Hazelcast] Performance tuning of Hazelcast SQL engine" /><published>2022-08-25T01:51:30+00:00</published><updated>2022-08-25T01:51:30+00:00</updated><id>https://krzysztofslusarski.github.io/2022/08/25/hz-sql</id><content type="html" xml:base="https://krzysztofslusarski.github.io/2022/08/25/hz-sql.html"><![CDATA[<h1 id="javaprofilinghazelcast-performance-tuning-of-hazelcast-sql-engine">[Java][Profiling][Hazelcast] Performance tuning of Hazelcast SQL engine</h1>

<p>This blog post was originally posted on
<a href="https://hazelcast.com/blog/performance-tuning-of-the-hazelcast-sql-engine" target="_blank">Hazelcast’s website</a>.</p>

<p><strong>Hazelcast</strong> in version <strong>5.1</strong> contains two querying APIs:</p>

<ul>
  <li>Predicate API</li>
  <li>SQL engine</li>
</ul>

<p>Predicate API is an older Java-based API. Even though it contains <code class="language-plaintext highlighter-rouge">sqlPredicate</code>, which allows using SQL-like
syntax for the <code class="language-plaintext highlighter-rouge">WHERE</code> clause, the syntax is non-standard, for example <code class="language-plaintext highlighter-rouge">NULL</code> handling doesn’t
support the (in)famous ternary logic. It fetches the results in one batch, which limits the supported result size.</p>

<p>On the other hand, SQL Engine is a more modern engine, it uses standard SQL, a cost-based optimizer,
and is available in all programming languages. It also supports <code class="language-plaintext highlighter-rouge">JOIN</code>, <code class="language-plaintext highlighter-rouge">ORDER BY</code>, <code class="language-plaintext highlighter-rouge">GROUP BY</code>
or <code class="language-plaintext highlighter-rouge">UNION</code> operators, which don’t have an equivalent in the Predicate API. It streams the results to the
client, so the result size isn’t limited (though this is also a restriction, because it’s not possible to restart
the query if it fails mid-way).</p>

<p>In the next major release, we plan to deprecate the Predicate API. For this we need feature parity, and also
match the <strong>performance</strong> of Predicate API. The <strong>performance</strong> is the focus of this blog post: we’ll describe our journey in
benchmarking and fixing some performance issues we had.</p>

<h2 id="benchmark-details">Benchmark details</h2>

<p>Here is a list of benchmarks that we did for that comparison:</p>

<table>
  <thead>
    <tr>
      <th> </th>
      <th>SQL</th>
      <th>Predicate API</th>
    </tr>
  </thead>
  <tbody>
    <tr>
      <td>1</td>
      <td><code class="language-plaintext highlighter-rouge">SELECT __key, this FROM iMap</code></td>
      <td><code class="language-plaintext highlighter-rouge">map.entrySet()</code></td>
    </tr>
    <tr>
      <td>2</td>
      <td><code class="language-plaintext highlighter-rouge">SELECT count(*) FROM iMap</code> <code class="language-plaintext highlighter-rouge">SELECT count(__key) FROM iMap</code></td>
      <td><code class="language-plaintext highlighter-rouge">map.aggregate(Aggregators.count())</code></td>
    </tr>
    <tr>
      <td>3</td>
      <td><code class="language-plaintext highlighter-rouge">SELECT sum(\"value\") FROM iMap</code></td>
      <td><code class="language-plaintext highlighter-rouge">map.aggregate(Aggregators.longSum("value"))</code></td>
    </tr>
    <tr>
      <td>4</td>
      <td><code class="language-plaintext highlighter-rouge">SELECT sum(JSON_VALUE(this, '$.value' RETURNING INTEGER)) FROM iMap</code></td>
      <td><code class="language-plaintext highlighter-rouge">map.aggregate(Aggregators.longSum("value"))</code></td>
    </tr>
    <tr>
      <td>5</td>
      <td><code class="language-plaintext highlighter-rouge">SELECT __key, this FROM iMap WHERE \"value\" = ?</code></td>
      <td><code class="language-plaintext highlighter-rouge">map.entrySet(Predicates.equal("value", valueMatch))</code></td>
    </tr>
  </tbody>
</table>

<p>The fifth benchmark was run with and without index on <code class="language-plaintext highlighter-rouge">value</code> field. For benchmark number three we used three different
serialization methods:</p>
<ul>
  <li><code class="language-plaintext highlighter-rouge">IdentifiedDataSerializable</code></li>
  <li><code class="language-plaintext highlighter-rouge">Portable</code></li>
  <li><code class="language-plaintext highlighter-rouge">HazelcastJsonValue</code> with <code class="language-plaintext highlighter-rouge">json-flat</code> SQL mapping</li>
</ul>

<p>For the rest of the benchmarks we used <code class="language-plaintext highlighter-rouge">IdentifiedDataSerializable</code>. If you are not familiar with our serialization options 
check <a href="https://docs.hazelcast.com/hazelcast/5.1/serialization/serialization" target="_blank">this page</a>.</p>

<p>We didn’t benchmark joins and streaming queries since they cannot be executed with Predicate API. These functionalities
are available in SQL engine only.</p>

<h2 id="testing-environment">Testing environment</h2>

<p>All the benchmarks were run in throughput and latency modes since we cared about both. In this post I’m going to cover only the latency part
of those benchmarks.</p>

<p>First results showed that the SQL was slower in most of them. Next step was to run those benchmarks again with the 
attached profiler. I used <strong>Async-profiler</strong>, and since I was tracing latency issues, I chose <strong>wall-clock mode</strong>. 
You can read about different modes in <a href="https://krzysztofslusarski.github.io/2022/04/26/distributed.html" target="_blank">my previous post</a>.</p>

<p>All of those benchmarks were run on our testing lab, so we knew that the results were valid (no noisy-neighbor issue). 
The setup for the benchmarks was:</p>

<ul>
  <li>Hazelcast cluster size: <strong>4</strong></li>
  <li>Machines with <strong>Intel Xeon CPU E5-2687W</strong></li>
  <li>Heap size: <strong>10 GB</strong></li>
  <li><strong>JDK17</strong></li>
</ul>

<h2 id="how-does-hazelcast-sql-work">How does Hazelcast SQL work?</h2>

<p>Each of the cluster members contains two major modules: <strong>IMDG</strong> and <strong>JET</strong>. <strong>IMDG</strong> is a module where we store our
data. <strong>JET</strong> is a distributed batch and stream processing engine. Additionally, for parsing the SQL queries we use
<strong>Apache Calcite</strong>.</p>

<p><img src="/assets/hz-sql/arch-1.png" alt="alt text" title="arch" /></p>

<p>When a client sends a query to a cluster, that query is just a string with parameters. The query is sent to a random
member of the cluster. That member is called a <strong>coordinator</strong> of that query. The coordinator needs to:</p>

<ul>
  <li>Create a query plan</li>
  <li>Convert the query plan to JET job</li>
  <li>Distribute the JET job to all the members</li>
</ul>

<p>After that is done all the members are executing the query, and the results are streamed by the coordinator to 
the client.</p>

<p><img src="/assets/hz-sql/arch-2.png" alt="alt text" title="arch" /></p>

<h2 id="flame-graphs">Flame graphs</h2>

<p>If you do <strong>sampling profiling</strong> you need to visualize the results. The results are nothing more than a <strong>set of stacktraces</strong>.
My favorite way of visualization is a <strong>flame graph</strong>. The easiest way to understand what flame graphs are is to understand how 
they are created.</p>

<p>First part is to draw a rectangle for each frame of each stacktrace. The stacktraces are drawn bottom-up and sorted 
alphabetically. For example, such a graph:</p>

<p><img src="/assets/hz-sql/flame-1.png" alt="alt text" title="flame" /></p>

<p>corresponds to set of stactraces:</p>

<ul>
  <li>3 samples - <code class="language-plaintext highlighter-rouge">a() -&gt; h()</code></li>
  <li>5 samples - <code class="language-plaintext highlighter-rouge">b() -&gt; d() -&gt; e() -&gt; f()</code></li>
  <li>2 samples - <code class="language-plaintext highlighter-rouge">b() -&gt; d() -&gt; e() -&gt; g()</code></li>
  <li>2 samples - <code class="language-plaintext highlighter-rouge">b() -&gt; d()</code></li>
  <li>2 samples - <code class="language-plaintext highlighter-rouge">c()</code></li>
</ul>

<p>The next step is <strong>joining</strong> the rectangles with the same method name to one bar:</p>

<p><img src="/assets/hz-sql/flame-2.png" alt="alt text" title="flame" /></p>

<p>The flame graph usually shows you how some resource is utilized by your application. The resource is utilized 
<strong>by the top methods</strong> of that graph (visualized with green bar):</p>

<p><img src="/assets/hz-sql/flame-3.png" alt="alt text" title="flame" /></p>

<p>So in this example method <code class="language-plaintext highlighter-rouge">b()</code> is not utilizing the resource at all, it just invokes methods that do it. Flame graphs 
are commonly used to present the <strong>CPU utilization</strong>, but CPU is just one of the resources that we can visualize this way.
If you use <strong>wall-clock mode</strong> then your resource is <strong>time</strong>. If you use <strong>allocation mode</strong> then your resource is 
<strong>heap</strong>.</p>

<h2 id="client-part">Client part</h2>

<p>Benchmark details:</p>

<ul>
  <li>Query: <code class="language-plaintext highlighter-rouge">SELECT __key, this FROM IMap</code></li>
  <li>Values in IMap have fields: <code class="language-plaintext highlighter-rouge">String</code> and <code class="language-plaintext highlighter-rouge">int[20]</code>, serialized with <code class="language-plaintext highlighter-rouge">IdentifiedDataSerializable</code></li>
  <li>IMap size - <strong>100_000</strong> entries</li>
  <li>Latency test - <strong>24</strong> queries per second</li>
</ul>

<p>Let’s start with profiling the client side. Here is a wall-clock flame graph of the method that fetches the data on
the client’s side:</p>

<p><img src="/assets/hz-sql/flame-1-1.png" alt="alt text" title="flame" /></p>

<p>Let’s look at the bottom of the flame graph, method <code class="language-plaintext highlighter-rouge">testSelect()</code> iterates over the results and for each row 
it executes three things:</p>

<ul>
  <li>Method <code class="language-plaintext highlighter-rouge">accept()</code> - that executes the deserializon of the row - each SQL row travels to the client through
the network as a byte array, so we need to deserialize it to the object format</li>
  <li>Method <code class="language-plaintext highlighter-rouge">ClientIterator.hasNext()</code> - that one returns the next row if it is already fetched, or waits to
receive the next portion of the result set. In the flame graph we see the waiting part. At this point in time the
execution is done in the <strong>cluster</strong> - nothing to improve on the client’s side.</li>
  <li>Some third method, let’s zoom in that part of the flame graph</li>
</ul>

<p><img src="/assets/hz-sql/flame-1-2.png" alt="alt text" title="flame" /></p>

<p>Here we can see that the method <code class="language-plaintext highlighter-rouge">getColumnValueForClient()</code> (3rd from the top) executes <code class="language-plaintext highlighter-rouge">LinkedList.get()</code>
which consumes a lot of time. Let’s go to the source code:</p>

<p><img src="/assets/hz-sql/source-1-1.png" alt="alt text" title="source" /></p>

<p><code class="language-plaintext highlighter-rouge">columns</code> is a field of type <code class="language-plaintext highlighter-rouge">List&lt;List&lt;?&gt;&gt;</code>, and the problematic method executes <code class="language-plaintext highlighter-rouge">columns.get(columnIndex).get(rowIndex)</code>. 
Executing <code class="language-plaintext highlighter-rouge">LinkedList.get(index)</code> is known to have bad performance, since it has <code class="language-plaintext highlighter-rouge">O(size)</code> complexity. 
The instance is not created here, it is passed in the constructor, so we need to debug the application to find the
origin of that <code class="language-plaintext highlighter-rouge">LinkedList</code>. Two breakpoints later I found a place where it was created. One solution is to
switch that <code class="language-plaintext highlighter-rouge">List</code> to <code class="language-plaintext highlighter-rouge">ArrayList</code> like this:</p>

<p><img src="/assets/hz-sql/source-1-2.png" alt="alt text" title="source" /></p>

<p>But it is not always that easy. The code where that list was created was done many years ago and is used not only by SQL 
engine. We need to be careful here. I asked colleagues from the other team if we can do it, they did their benchmarks
and agreed to that change:</p>

<p><img src="/assets/hz-sql/slack-1.png" alt="alt text" title="slack" /></p>

<p>How did that affect our performance? Well it depends on the number of columns and whether we do deserialization on the 
client’s side (it is done lazily). Here is the latency distribution for two columns and no deserialization:</p>

<p><img src="/assets/hz-sql/chart-1.png" alt="alt text" title="chart" /></p>

<p>Was it a mistake to choose <code class="language-plaintext highlighter-rouge">LinkedList</code> in that code? No. It was a coherent decision made by the state of Hazelcast at the 
moment of creation of that code.</p>

<p><strong>Thing to remember</strong> is that performance is a living organism. It evolves with new features. What was efficient yesterday 
could be a bottleneck tomorrow.</p>

<p>PR: <a href="https://github.com/hazelcast/hazelcast/pull/20398" target="_blank">https://github.com/hazelcast/hazelcast/pull/20398</a></p>

<h2 id="cluster-side---sum">Cluster side - sum()</h2>

<p>Benchmark details:</p>

<ul>
  <li>Query: <code class="language-plaintext highlighter-rouge">SELECT sum(\”value\”) FROM IMap</code></li>
  <li>Values in IMap have fields: one <code class="language-plaintext highlighter-rouge">Long</code>, and one <code class="language-plaintext highlighter-rouge">int[20]</code>, serialized with <code class="language-plaintext highlighter-rouge">IdentifiedDataSerializable</code></li>
  <li>IMap size - <strong>1_000_000</strong> entries</li>
  <li>Latency test - <strong>6</strong> queries per second</li>
</ul>

<p>In this benchmark we need to deserialize all the instances in IMap, get a single field from that deserialized object
and aggregate it. The majority of work is deserialization. It was strange to me that the Predicate API had different performance
than SQL.</p>

<p>Here is a flame graph for Predicate API:</p>

<p><img src="/assets/hz-sql/flame-2-1.png" alt="alt text" title="flame" /></p>

<p>And here is one for SQL:</p>

<p><img src="/assets/hz-sql/flame-2-2.png" alt="alt text" title="flame" /></p>

<p>Now let’s do something a bit silly. Open both graphs in separate browser tabs (right mouse click on the graph -&gt; open 
graphics in a new tab) and then just switch between those two tabs very quickly and try to find a difference. Did you 
spot it? It is at the top. The SQL graph has a lot of <strong>yellow/red code</strong> there, the Predicate API does not. 
Let’s see what it is about:</p>

<p><img src="/assets/hz-sql/flame-2-3.png" alt="alt text" title="flame" /></p>

<p>The frames that we can see in SQL only are <code class="language-plaintext highlighter-rouge">Class.forName()</code>. We had a class definition cache in Hazelcast already, 
and it was strange that it wasn’t used for SQL. We can highlight all invocations of that method to see how much time it
consumes:</p>

<p><img src="/assets/hz-sql/flame-2-4.png" alt="alt text" title="flame" /></p>

<p>So that loading of classes consumed <strong>~25%</strong> of deserialization of Java objects. Let’s look at the code of our class
loading:</p>

<p><img src="/assets/hz-sql/source-2-1.png" alt="alt text" title="source" /></p>

<p>We have four layers of caches here, each <code class="language-plaintext highlighter-rouge">tryLoadClass()</code> checks if the definition is in the cache, if not it 
loads it. If none of the classloaders loaded the class we called <code class="language-plaintext highlighter-rouge">Class.forName()</code>.</p>

<p>The difference between Predicate API and SQL was that in SQL the <code class="language-plaintext highlighter-rouge">contextClassLoader</code> was <code class="language-plaintext highlighter-rouge">null</code>, since you 
cannot use user classes with SQL query. We decided to add another level of cache:</p>

<p><img src="/assets/hz-sql/source-2-2.png" alt="alt text" title="source" /></p>

<p>How did that improve the performance?</p>

<p><img src="/assets/hz-sql/chart-2.png" alt="alt text" title="chart" /></p>

<p><strong>Thing to remember</strong> is that “If it looks stupid but works, it isn’t stupid” – that also applies to the
performance analysis. Comparing two flame graphs by quickly switching the browser tabs looks silly, but hey, it works
like a charm if you want to compare resource utilization that should look the same.</p>

<p>PR: <a href="https://github.com/hazelcast/hazelcast/pull/20459" target="_blank">https://github.com/hazelcast/hazelcast/pull/20459</a></p>

<h2 id="cluster-side---sum-with-json">Cluster side - sum() with JSON</h2>

<p>Benchmark details:</p>
<ul>
  <li>Query: <code class="language-plaintext highlighter-rouge">SELECT sum(json_value(this, '$.value' returning integer)) FROM cache</code></li>
  <li>Values in IMap have two fields: <code class="language-plaintext highlighter-rouge">Long</code> and <code class="language-plaintext highlighter-rouge">int[20]</code>, serialized as <code class="language-plaintext highlighter-rouge">JSON</code></li>
  <li>IMap size - <strong>1_000_000</strong> entries</li>
  <li>Latency test - <strong>5</strong> queries per second</li>
</ul>

<p>Let’s go straight to the flame graph of evaluation a value from JSON:</p>

<p><img src="/assets/hz-sql/flame-3-1.png" alt="alt text" title="flame" /></p>

<p>The big left part of that graph is acquiring a lock, it utilizes:</p>

<p><img src="/assets/hz-sql/flame-3-2.png" alt="alt text" title="flame" /></p>

<p><strong>~70%</strong> of the time of evaluation of the value. That part of code uses <strong>Guava cache</strong> that uses <code class="language-plaintext highlighter-rouge">ReentrantLock</code>
internally. The cache contains a mapping from string JSON path to our object that represents that path. The usage of
that cache is usually single insert and multiple reads. For such a usage pattern the <code class="language-plaintext highlighter-rouge">ReentrantLock</code> is not the
best choice, <code class="language-plaintext highlighter-rouge">ConcurrentHashMap</code> is better for example. Simple switch from Guava cache to CHM did this improvement:</p>

<p><img src="/assets/hz-sql/chart-3.png" alt="alt text" title="chart" /></p>

<p>In the end we decided to do <strong>two</strong> implementations of a cache, one for a single JSON path based on a field, 
the second for the rest of the cases.</p>

<p><strong>Thing to remember</strong> is that the performance bottleneck may be in 3rd party libraries/frameworks. 
It doesn’t mean that their code is bad, usually we simply do not know the trade-offs there, and that may hurt us.</p>

<p>PR: <a href="https://github.com/hazelcast/hazelcast/pull/20655" target="_blank">https://github.com/hazelcast/hazelcast/pull/20655</a></p>

<h2 id="cluster-side---scan-for-a-single-value-by-index">Cluster side - scan for a single value by index</h2>

<p>Benchmark details:</p>

<ul>
  <li>Query: <code class="language-plaintext highlighter-rouge">SELECT __key, this FROM iMap where col=...; // Index on col</code></li>
  <li>Values in IMap have two fields: <code class="language-plaintext highlighter-rouge">String</code> and <code class="language-plaintext highlighter-rouge">int[20]</code>, serialized with <code class="language-plaintext highlighter-rouge">IdentifiedDataSerializable</code></li>
  <li>IMap size - <strong>10_000_000</strong> entries</li>
  <li>Latency test - <strong>7500</strong> queries per second</li>
</ul>

<p>This is a benchmark where we test a distributed deployment overhead of a job on a busy cluster. The part after the
deployment is easy, we just need to take an index and fetch a single row from it. Unfortunately in such queries 
we will never be better than Predicate API, since the execution plan for SQL is much bigger than for Predicate API,
and serialization and deployment takes more time. What we can do is to speed up that part in SQL to 
be as fast as possible.</p>

<p>When I ran the first instance of that benchmark the mean latency was around <strong>4,5ms</strong> on a stressed cluster. 
To fight that kind of latency we need to focus on all the resources that are needed for that code to run. 
Let’s look at the heap allocation:</p>

<p><img src="/assets/hz-sql/flame-4-1.png" alt="alt text" title="flame" /></p>

<p>Over <strong>90%</strong> of recorded allocation (during creation of the plan) was done in the constructor of <code class="language-plaintext highlighter-rouge">SenderTasklet</code>.
That class is responsible for sending computation results to other nodes in the cluster. It created a <strong>32k</strong> byte
array as a buffer of data to send. The value <strong>32k</strong> was ok for a task manipulating multiple entries, but for a task
that processes only one row it was a waste of heap memory.</p>

<p>We went with the solution to have a buffer with two initial sizes:</p>

<ul>
  <li>Small initial size: <strong>1k</strong></li>
  <li>If that buffer is too small it expands to <strong>32k</strong> immediately</li>
</ul>

<p>That approach didn’t hit larger tasks, they need to waste 1k array at the beginning, but allocation of such an 
array is much cheaper than 32k, since 32k is often allocated <strong>outside the TLAB</strong>.</p>

<p>That change lowered the allocation rate of that benchmark from <strong>3,8GB/s</strong> to <strong>2,3GB/s</strong>, but that was not the 
only change in that part of our engine. My colleague pointed out that in some cases we created a <code class="language-plaintext highlighter-rouge">SenderTasklet</code>
that knew it would never send any data through the network. We can avoid the creation of unnecessary
<code class="language-plaintext highlighter-rouge">SenderTasklet</code>. That change lowered the heap allocation rate to <strong>1,5GB/s</strong>.</p>

<p>There were plenty of PRs for lowering down that deployment overhead. Current status (mean) is:</p>

<p><img src="/assets/hz-sql/chart-4.png" alt="alt text" title="chart" /></p>

<p>We lowered the mean latency from <strong>4.5ms</strong> to <strong>1.8ms</strong> on a stressed cluster, and we still have ideas how to 
make it even better.</p>

<p><strong>Thing to remember</strong> is that allocation on heap is fast, but no allocation is faster.</p>

<p>PRs:
<a href="https://github.com/hazelcast/hazelcast/pull/20882" target="_blank">https://github.com/hazelcast/hazelcast/pull/20882</a>
and
<a href="https://github.com/hazelcast/hazelcast/pull/20940" target="_blank">https://github.com/hazelcast/hazelcast/pull/20940</a></p>

<h2 id="summary">Summary</h2>

<p>Our SQL engine in release 5.2 is currently faster with better throughput than Predicate API in most of the 
benchmarks. The only kind of query where Predicate API is faster is a query that normally takes just milliseconds 
to execute. As I’ve mentioned in the last example, we still have ideas on how to make the SQL engine faster.
We are going to realize those in future releases.</p>

<p>In this post I focused on four different issues that can teach us something. Let me gather those four 
things to remember:</p>

<ul>
  <li>Performance is a living organism. It evolves with new features. What was efficient yesterday could be a bottleneck tomorrow.</li>
  <li>“If it looks stupid but works, it isn’t stupid” - every flame graph analysis technique is good as long as it works for you</li>
  <li>The performance bottleneck may be hidden in 3rd party libraries/frameworks</li>
  <li>Allocation on heap is fast, but no allocation is faster</li>
</ul>

<p>One additional “lesson learned” is that the Async-profiler is a very useful tool for finding such high-level bottlenecks. 
You need to remember that there are issues in which such a profiler won’t help. Some performance bottlenecks can be understood
after analyzing assembly code or with Top-down Microarchitecture Analysis.</p>]]></content><author><name></name></author><summary type="html"><![CDATA[[Java][Profiling][Hazelcast] Performance tuning of Hazelcast SQL engine]]></summary></entry><entry><title type="html">[Java][Profiling][JVM] Tracing a Single Operation in Distributed Systems</title><link href="https://krzysztofslusarski.github.io/2022/04/26/distributed.html" rel="alternate" type="text/html" title="[Java][Profiling][JVM] Tracing a Single Operation in Distributed Systems" /><published>2022-04-26T01:51:30+00:00</published><updated>2022-04-26T01:51:30+00:00</updated><id>https://krzysztofslusarski.github.io/2022/04/26/distributed</id><content type="html" xml:base="https://krzysztofslusarski.github.io/2022/04/26/distributed.html"><![CDATA[<h1 id="javaprofilingjvm-tracing-a-single-operation-in-distributed-systems">[Java][Profiling][JVM] Tracing a Single Operation in Distributed Systems</h1>

<p>This blog post was originally posted on 
<a href="https://hazelcast.com/blog/tracing-a-single-operation-in-distributed-systems" target="_blank">Hazelcast’s website</a>.</p>

<p>Let’s start with the basics. It is easy these days if we want to speed up a whole application! You run a JVM profiler, 
gather the results, and analyze the results to identify where the time and /or resources are wasted. Equipped with this
understanding, you can make the application more efficient.</p>

<p>But what if we want to solve the problem of knowing <em><strong>why a single request is slow</strong></em>? It is tough to find a single request in 
profiler results. Additionally, as we will explore in this article, this problem becomes increasingly complex as we move from 
monolithic applications toward distributed architectures and distributed systems.</p>

<h2 id="profiler-mode">Profiler mode</h2>

<p>Often, the mistake made by software engineers during their initial profiling sessions is choosing the wrong profiler mode. 
Every profiler has multiple modes, and you need to select the one to help you solve your problem. The most common issues are:</p>

<ul>
  <li>“my application/request is slow” – essentially, you want to measure where <strong>time</strong> is wasted; the correct 
mode to use is <strong>“wall-clock”</strong></li>
  <li>“my application/request consumes too much CPU” – here, one would like to identify the section of code that is consuming excess 
<strong>CPU</strong>, and the <strong>“CPU”</strong> mode should be used</li>
  <li>“my application/request has a high allocation rate” – you should use <strong>“allocation”</strong> mode for this analysis</li>
</ul>

<p>A common mistake is using <strong>“CPU”</strong> mode to analyze why an application is slow. If your application is CPU intensive, 
then yes, it may work. But if your application waits on IOs (like WS invocations or DB queries), locks, or waits, 
you will waste your time.</p>

<p>Since we want to solve the problem of slow requests, we’ll use the <strong>“wall-clock”</strong> profiler mode.</p>

<h2 id="profiler">Profiler</h2>
<p>Nowadays, we have plenty of profilers on the market. We need to select a profiler that supports <strong>“wall-clock”</strong> mode and runs 
with a small overhead so that it can even be used on a production system. The only profiler that fits these requirements that 
I am aware of is the <strong>Async-profiler</strong>, so we will focus on this one. It also supports dumping results in <strong>JFR format</strong> where 
each sample contains:</p>

<ul>
  <li>Stacktrace</li>
  <li>Thread name</li>
  <li>Timestamp</li>
  <li>Thread state – if that thread consumes CPU or not</li>
</ul>

<h2 id="monolithic-application">Monolithic application</h2>

<p>Let’s start with a monolithic application’s most straightforward architecture to trace. A single thread processes the majority 
of the requests in a monolithic application. If we know the thread that has executed a slow request, then JFR output contains 
all the information we need. We need to filter that file with two filters:</p>

<ul>
  <li>Thread name – it should equal the one that has processed the request</li>
  <li>Timestamp – it should be between the start and the end of the request execution</li>
</ul>

<p>There are multiple ways of gathering this in our application. We can use our application log or application server access log.</p>

<h2 id="distributed-architecture-like-microservices">Distributed architecture (like microservices)</h2>

<p>The situation is more complicated in distributed architecture since one request is processed by multiple JVMs (we focus only on 
JVM applications here; this article will not solve problems in other execution engines). The standard approach to understanding 
what is happening in such an architecture is to use <em><strong>correlation id</strong></em> (in short, <strong>CID</strong>). The first application that receives
a request from an outside world generates a <strong>CID</strong> passed in every request between applications in a distributed 
architecture. Adding that <strong>CID</strong> to our logs, we can extract the specific thread on a particular JVM that executed the request.
Then like before, we need to filter the <strong>JFR</strong> files from all the applications. It is exhausting but doable.
We need to have the profiler running on all the JVMs.</p>

<h2 id="distributed-systems">Distributed systems</h2>

<p>First of all, let’s understand the difference between distributed systems and distributed architecture. Those phrases are often 
used interchangeably, but the distributed systems I am referring to in this article are entirely different from distributed 
architecture. For this article, let’s assume that a distributed system is a single system in the architecture that distributes
the work to multiple instances and threads to give the response ASAP.</p>
<p>You can imagine how difficult it is to trace a single request with such a definition. It is executed not only on multiple threads 
but also on multiple JVMs. How the hell can we trace that? Is that execution slow on each node? Or maybe one node is slower?
Or maybe one thread on one node has too much work? How can we distinguish that?</p>

<p>The first approach is creating a <strong>CID</strong> and logging the thread on which JVM executes it. It would work, but it would be even
more painful than the distributed architecture problem. To troubleshoot this problem regularly, well, we need something more
innovative. What if we could add the <strong>CID</strong> to the <strong>JFR</strong> file? That would be great, as we wouldn’t have to aggregate multiple 
data sources. We would need the <strong>CID</strong> and <strong>JFR</strong> files from all the JVMs, and the only filter we need to apply to the <strong>JFR</strong>
file is equality to <strong>CID</strong>.</p>

<h2 id="bad-news">Bad news</h2>

<p>Well, Async-profiler has no such feature, so we have two options:</p>

<ol>
  <li><em>“roll over and die”</em> and accept the current state of the reality and be miserable</li>
  <li>or we can create our reality and software that fulfills our needs</li>
</ol>

<p>As a software engineer, you have an opportunity no other profession has. You can choose option two! The easiest way to
 modify Async-profiler was simply by contributing to the open-sourced project. I prepared a
<a href="https://github.com/jvm-profiling-tools/async-profiler/pull/576" target="_blank">PR</a>. When writing this article, this PR had 
not been merged. It may never be merged, but the PR state is good enough to solve my current problem of finding the cause of
long requests using the benchmarks on my test environment.</p>

<h2 id="good-news">Good news</h2>

<p>Even if my PR is not merged, the contextual profiling feature is on the Async-profiler roadmap; it will support this 
functionality sooner or later.</p>

<h2 id="jfr-filtering-and-transformation">JFR filtering and transformation</h2>

<p>We now have a tool that gathers the needed information in JFR format; great! Next, we need a tool that filters that output and 
presents it in a human-readable format. My favorite format to understand profiler output is a flame graph. Previously, I had 
written a tool that filters and converts JFR to flame graph, which I have now extended. It was straightforward as it’s just 
parsing, filtering, and transforming problems. That change is already in a master branch of my 
<a href="https://github.com/krzysztofslusarski/jvm-profiling-toolkit" target="_blank">tool</a>.</p>

<h2 id="we-have-all-the-tools-we-need-lets-try-it-now">We have all the tools we need; let’s try it now!</h2>

<p>Benchmark details:</p>

<ul>
  <li>Hazelcast cluster size: <strong>4</strong></li>
  <li>Machines with <strong>Intel Xeon CPU E5-2687W</strong></li>
  <li>Heap size: <strong>10 GB</strong></li>
  <li><strong>JDK17</strong></li>
  <li>SQL query that is benchmarked: <code class="language-plaintext highlighter-rouge">select count(*) form iMap</code></li>
  <li>iMap size – <strong>1 million</strong> java serialized objects</li>
  <li>Benchmark duration: <strong>8 minutes</strong></li>
</ul>

<p>The latency distribution for that benchmark:</p>

<p><img src="/assets/distributed/dist.png" alt="alt text" title="dist" /></p>

<p>The <strong>50th</strong> percentile is <strong>1470 ms</strong>, whereas the <strong>99.9th</strong> is <strong>3718 ms</strong>. Let’s now analyze the <strong>JFR</strong> outputs with my tool. 
I’ve created a table with the longest <strong>CIDs</strong> in the files:</p>

<p><img src="/assets/distributed/cid.png" alt="alt text" title="cid" /></p>

<p>Let’s analyze a single <strong>CID</strong>. I selected additional levels in my tool, namely the filename and timestamp. The full flame graph:</p>

<p><img src="/assets/distributed/1.png" alt="alt text" title="1" /></p>

<p>Let’s focus on the bottom rows:</p>

<p><img src="/assets/distributed/2.png" alt="alt text" title="2" /></p>

<p>The brown squares are timestamps with human-readable dates. The cyan ones are filenames from which upper stacktraces come.</p>

<p>Let’s start with timestamps and highlight them one by one:</p>

<p><img src="/assets/distributed/3.png" alt="alt text" title="3" />
<img src="/assets/distributed/4.png" alt="alt text" title="4" />
<img src="/assets/distributed/5.png" alt="alt text" title="5" />
<img src="/assets/distributed/6.png" alt="alt text" title="6" />
<img src="/assets/distributed/7.png" alt="alt text" title="7" /></p>

<p>Summing that up:</p>

<ul>
  <li><strong>41.91%</strong> of samples were gathered between 14:47:19 and 14:47:20</li>
  <li><strong>35.79%</strong> of samples were gathered between 14:47:20 and 14:47:21</li>
  <li><strong>6.68%</strong> of samples were gathered between 14:47:21 and 14:47:22</li>
  <li><strong>12.37%</strong> of samples were gathered between 14:47:22 and 14:47:23</li>
  <li><strong>3.34%</strong> of samples were gathered between 14:47:23 and 14:47:24</li>
</ul>

<p>Let’s highlight the filenames (which are named with the <strong>IP</strong> of the server) one by one:</p>

<p><img src="/assets/distributed/8.png" alt="alt text" title="8" />
<img src="/assets/distributed/9.png" alt="alt text" title="9" />
<img src="/assets/distributed/10.png" alt="alt text" title="10" />
<img src="/assets/distributed/11.png" alt="alt text" title="11" /></p>

<p>A little summary:</p>

<ul>
  <li><strong>25.42%</strong> of samples are from node 10.212.1.101</li>
  <li><strong>23,75%</strong> of samples are from node 10.212.1.102</li>
  <li><strong>21.07%</strong> of samples are from node 10.212.1.103</li>
  <li><strong>29.77%</strong> of samples are from node 10.212.1.104</li>
</ul>

<p>Since brown bars are sorted alphabetically by timestamps, we can conclude that the <strong>10.212.1.104</strong> server doing any work
in the last seconds of processing.</p>

<p>So, the server with IP <strong>10.212.1.104</strong> is problematic. Maybe it is slower. Perhaps the work between nodes was distributed
without proper balance, and this server had more work to do. Maybe there were some long GC pauses on that server. That
topic is out of scope for this article, so I won’t dig into it here.</p>

<p>I checked five more long latency requests and the results were the same, confirming that the <strong>10.212.1.104</strong> server is the 
problem. I want to point out in this article that we now have a tool that gives us a great starting point for further 
investigation.</p>

<h2 id="some-caveats">Some caveats</h2>

<ol>
  <li>The current state of my PR to Async-profiler is <strong>not merged</strong> The API can change, the whole solution may be completely 
different in the end. My implementation uses <strong>JNI</strong> calls when passing <strong>CID</strong> to the profiler; this may be problematic in 
some applications. The additional overhead for passing the <strong>CID</strong> was <strong>~0,06%</strong> with the example above. Remember that in 
Hazelcast Jet, we need to give new <strong>CID</strong> very frequently since our green threads execute multiple fast tasklets. Based on
this, you should consider that <a href="https://github.com/jvm-profiling-tools/async-profiler/pull/576" target="_blank">PR</a> 
as POC for now.</li>
  <li>The Async-profiler sampling interval is one sample every <strong>10ms</strong>. This rate allows you to track latencies with hundreds of 
ms or more. With lower latencies, you need pieces to be gathered more often. The sampling interval can be changed, but it may
degrade your performance if you sample too frequently.</li>
</ol>]]></content><author><name></name></author><summary type="html"><![CDATA[[Java][Profiling][JVM] Tracing a Single Operation in Distributed Systems This blog post was originally posted on Hazelcast’s website.]]></summary></entry><entry><title type="html">[Java][Profiling][JVM] JVM thread state changes by example</title><link href="https://krzysztofslusarski.github.io/2022/03/21/cont-longtts-addition.html" rel="alternate" type="text/html" title="[Java][Profiling][JVM] JVM thread state changes by example" /><published>2022-03-21T01:51:30+00:00</published><updated>2022-03-21T01:51:30+00:00</updated><id>https://krzysztofslusarski.github.io/2022/03/21/cont-longtts-addition</id><content type="html" xml:base="https://krzysztofslusarski.github.io/2022/03/21/cont-longtts-addition.html"><![CDATA[<h1 id="javaprofilingjvm-jvm-thread-state-changes-by-example">[Java][Profiling][JVM] JVM thread state changes by example</h1>

<p>This article is a continuation of <a href="https://krzysztofslusarski.github.io/2021/08/22/cont-longtts.html" target="_blank">this one</a>,
where we have studied following code of JVM sources:</p>

<p>File <code class="language-plaintext highlighter-rouge">io_util.c</code>:</p>

<div class="language-c highlighter-rouge"><div class="highlight"><pre class="highlight"><code><span class="cp">#define BUF_SIZE 8192
</span>
<span class="kt">void</span>
<span class="nf">writeBytes</span><span class="p">(</span><span class="n">JNIEnv</span> <span class="o">*</span><span class="n">env</span><span class="p">,</span> <span class="n">jobject</span> <span class="n">this</span><span class="p">,</span> <span class="n">jbyteArray</span> <span class="n">bytes</span><span class="p">,</span>
           <span class="n">jint</span> <span class="n">off</span><span class="p">,</span> <span class="n">jint</span> <span class="n">len</span><span class="p">,</span> <span class="n">jboolean</span> <span class="n">append</span><span class="p">,</span> <span class="n">jfieldID</span> <span class="n">fid</span><span class="p">)</span>
<span class="p">{</span>
    <span class="p">...</span>
    <span class="k">if</span> <span class="p">(</span><span class="n">len</span> <span class="o">==</span> <span class="mi">0</span><span class="p">)</span> <span class="p">{</span>
        <span class="k">return</span><span class="p">;</span>
    <span class="p">}</span> <span class="k">else</span> <span class="k">if</span> <span class="p">(</span><span class="n">len</span> <span class="o">&gt;</span> <span class="n">BUF_SIZE</span><span class="p">)</span> <span class="p">{</span>
        <span class="n">buf</span> <span class="o">=</span> <span class="n">malloc</span><span class="p">(</span><span class="n">len</span><span class="p">);</span>
        <span class="k">if</span> <span class="p">(</span><span class="n">buf</span> <span class="o">==</span> <span class="nb">NULL</span><span class="p">)</span> <span class="p">{</span>
            <span class="n">JNU_ThrowOutOfMemoryError</span><span class="p">(</span><span class="n">env</span><span class="p">,</span> <span class="nb">NULL</span><span class="p">);</span>
            <span class="k">return</span><span class="p">;</span>
        <span class="p">}</span>
    <span class="p">}</span> <span class="k">else</span> <span class="p">{</span>
        <span class="n">buf</span> <span class="o">=</span> <span class="n">stackBuf</span><span class="p">;</span>
    <span class="p">}</span>
    <span class="p">(</span><span class="o">*</span><span class="n">env</span><span class="p">)</span><span class="o">-&gt;</span><span class="n">GetByteArrayRegion</span><span class="p">(</span><span class="n">env</span><span class="p">,</span> <span class="n">bytes</span><span class="p">,</span> <span class="n">off</span><span class="p">,</span> <span class="n">len</span><span class="p">,</span> <span class="p">(</span><span class="n">jbyte</span> <span class="o">*</span><span class="p">)</span><span class="n">buf</span><span class="p">);</span>
    <span class="p">...</span>
    <span class="k">if</span> <span class="p">(</span><span class="n">buf</span> <span class="o">!=</span> <span class="n">stackBuf</span><span class="p">)</span> <span class="p">{</span>
        <span class="n">free</span><span class="p">(</span><span class="n">buf</span><span class="p">);</span>
    <span class="p">}</span>
<span class="p">}</span>
</code></pre></div></div>

<p>I also mentioned that there are <strong>four</strong> essential states of a single JVM thread:</p>

<blockquote>
  <p>There are 4 essential states:</p>

  <p>_thread_new         : Just started, but not executed init. code yet (most likely still in OS init code)</p>

  <p>_thread_in_native   : In native code. This is a safepoint region, since all oops will be in jobject handles</p>

  <p>_thread_in_vm       : Executing in the vm</p>

  <p>_thread_in_Java     : Executing either interpreted or compiled Java code (or could be in a stub)</p>
</blockquote>

<p>However, there are some understatements.</p>

<ul>
  <li>Is a whole <code class="language-plaintext highlighter-rouge">writeBytes</code> is done in <code class="language-plaintext highlighter-rouge">_thread_in_vm</code>?</li>
  <li>Which call from the JVM code can cause a page fault?</li>
</ul>

<p>We didn’t see the answer for the second question in the previous articles since JVM was compiled <strong>without debug symbols</strong>.</p>

<h2 id="our-own-jvm-from-sources">Our own JVM from sources</h2>

<p>Let’s try to compile our <strong>own version</strong> of JVM from sources <strong>with debug symbols</strong>. To do it we need to execute (if you’re doing
it for the first time you may need to install some dependencies, check the 
<a href="https://github.com/openjdk/jdk11u-dev/blob/master/doc/building.md">instruction</a> first):</p>

<div class="language-shell highlighter-rouge"><div class="highlight"><pre class="highlight"><code>git clone <span class="nt">--depth</span> 1 https://github.com/openjdk/jdk11u-dev.git
<span class="nb">cd </span>jdk11u-dev
bash configure <span class="nt">--with-debug-level</span><span class="o">=</span>slowdebug
make images
</code></pre></div></div>

<p>After a success compilation you should see:</p>
<div class="language-plaintext highlighter-rouge"><div class="highlight"><pre class="highlight"><code>Creating support/demos/image/jfc/J2Ddemo/J2Ddemo.jar
Creating support/classlist.jar
Creating images/jmods/jdk.jlink.jmod
Creating images/jmods/java.base.jmod
Creating jdk image
Stopping sjavac server
Finished building target 'images' in configuration 'linux-x86_64-normal-server-slowdebug'
</code></pre></div></div>

<p>Let’s run our reproduction <code class="language-plaintext highlighter-rouge">Test</code> from previous article with our custom JVM.</p>

<div class="language-shell highlighter-rouge"><div class="highlight"><pre class="highlight"><code>./build/linux-x86_64-normal-server-slowdebug/jdk/bin/java <span class="nt">-Xmx700M</span> <span class="nt">-XX</span>:+AlwaysPreTouch <span class="nt">-XX</span>:+SafepointTimeout <span class="nt">-XX</span>:SafepointTimeoutDelay<span class="o">=</span>100 <span class="nt">-XX</span>:+UnlockDiagnosticVMOptions <span class="nt">-XX</span>:+AbortVMOnSafepointTimeout Temp
</code></pre></div></div>

<p>This time our <code class="language-plaintext highlighter-rouge">hs_err</code> has much more details:</p>

<div class="language-plaintext highlighter-rouge"><div class="highlight"><pre class="highlight"><code>Current thread (0x00007f12b401e800):  JavaThread "main" [_thread_in_vm, id=3325, stack(0x00007f12bd06b000,0x00007f12bd16c000)]

Stack: [0x00007f12bd06b000,0x00007f12bd16c000],  sp=0x00007f12bd168148,  free space=1012k
Native frames: (J=compiled Java code, A=aot compiled Java code, j=interpreted, Vv=VM code, C=native code)
C  [libc.so.6+0x15baa1]  __memmove_ssse3_back+0x1b11
V  [libjvm.so+0x30bd40]  Copy::conjoint_jbytes(void const*, void*, unsigned long)+0x2b
V  [libjvm.so+0x30b6a8]  void AccessInternal::arraycopy_conjoint&lt;signed char&gt;(signed char*, signed char*, unsigned long)+0x2b
V  [libjvm.so+0xc03380]  EnableIf&lt;(((!HasDecorator&lt;64ul, 4ul&gt;::value)&amp;&amp;(!(HasDecorator&lt;64ul, 33554432ul&gt;::value&amp;&amp;RawAccessBarrierArrayCopy::IsHeapWordSized&lt;signed char&gt;::value)))&amp;&amp;(!HasDecorator&lt;64ul, 67108864ul&gt;::value))&amp;&amp;(!HasDecorator&lt;64ul, 134217728ul&gt;::value), void&gt;::type RawAccessBarrierArrayCopy::arraycopy&lt;64ul, signed char&gt;(arrayOopDesc*, unsigned long, signed char*, arrayOopDesc*, unsigned long, signed char*, unsigned long)+0x6d
V  [libjvm.so+0xc03218]  bool RawAccessBarrier&lt;64ul&gt;::arraycopy&lt;signed char&gt;(arrayOopDesc*, unsigned long, signed char*, arrayOopDesc*, unsigned long, signed char*, unsigned long)+0x48
V  [libjvm.so+0xc03119]  EnableIf&lt;HasDecorator&lt;2642000ul, 4096ul&gt;::value&amp;&amp;AccessInternal::PreRuntimeDispatch::CanHardwireRaw&lt;2642000ul&gt;::value, bool&gt;::type AccessInternal::PreRuntimeDispatch::arraycopy&lt;2642000ul, signed char&gt;(arrayOopDesc*, unsigned long, signed char*, arrayOopDesc*, unsigned long, signed char*, unsigned long)+0x48
V  [libjvm.so+0xc02fd2]  EnableIf&lt;!HasDecorator&lt;2637904ul, 4096ul&gt;::value, bool&gt;::type AccessInternal::PreRuntimeDispatch::arraycopy&lt;2637904ul, signed char&gt;(arrayOopDesc*, unsigned long, signed char*, arrayOopDesc*, unsigned long, signed char*, unsigned long)+0x59
V  [libjvm.so+0xc02e96]  bool AccessInternal::arraycopy_reduce_types&lt;2637904ul, signed char&gt;(arrayOopDesc*, unsigned long, signed char*, arrayOopDesc*, unsigned long, signed char*, unsigned long)+0x48
V  [libjvm.so+0xc02cf6]  bool AccessInternal::arraycopy&lt;2621440ul, signed char&gt;(arrayOopDesc*, unsigned long, signed char const*, arrayOopDesc*, unsigned long, signed char*, unsigned long)+0x50
V  [libjvm.so+0xc02a56]  void Access&lt;2621440ul&gt;::arraycopy&lt;signed char&gt;(arrayOopDesc*, unsigned long, signed char const*, arrayOopDesc*, unsigned long, signed char*, unsigned long)+0x4d
V  [libjvm.so+0xcc85aa]  void ArrayAccess&lt;0ul&gt;::arraycopy_to_native&lt;signed char&gt;(arrayOopDesc*, unsigned long, signed char*, unsigned long)+0x47
V  [libjvm.so+0xcbe07e]  jni_GetByteArrayRegion+0x2f4
C  [libjava.so+0x1e858]  writeBytes+0x15d
C  [libjava.so+0x10d86]  Java_java_io_FileOutputStream_writeBytes+0x5b
j  java.io.FileOutputStream.writeBytes([BIIZ)V+0 java.base
j  java.io.FileOutputStream.write([BII)V+16 java.base
j  java.io.BufferedOutputStream.write([BII)V+20 java.base
j  java.io.FilterOutputStream.write([B)V+5 java.base
j  Temp.main([Ljava/lang/String;)V+58
v  ~StubRoutines::call_stub
V  [libjvm.so+0xbebc5d]  JavaCalls::call_helper(JavaValue*, methodHandle const&amp;, JavaCallArguments*, Thread*)+0x647
V  [libjvm.so+0x10a88dc]  os::os_exception_wrapper(void (*)(JavaValue*, methodHandle const&amp;, JavaCallArguments*, Thread*), JavaValue*, methodHandle const&amp;, JavaCallArguments*, Thread*)+0x32
V  [libjvm.so+0xbeb614]  JavaCalls::call(JavaValue*, methodHandle const&amp;, JavaCallArguments*, Thread*)+0xa8
V  [libjvm.so+0xc96122]  jni_invoke_static(JNIEnv_*, JavaValue*, _jobject*, JNICallType, _jmethodID*, JNI_ArgumentPusher*, Thread*)+0x1f0
V  [libjvm.so+0xcad204]  jni_CallStaticVoidMethod+0x36a
C  [libjli.so+0x5062]  JavaMain+0xcf7
</code></pre></div></div>

<p>Now we can see that the <code class="language-plaintext highlighter-rouge">writeBytes</code> executes <code class="language-plaintext highlighter-rouge">jni_GetByteArrayRegion</code> which in the end calls <code class="language-plaintext highlighter-rouge">__memmove_ssse3_back</code>.
So it’s not the <code class="language-plaintext highlighter-rouge">malloc</code>, that make sense. The <code class="language-plaintext highlighter-rouge">malloc</code> returns a pointer returned by the OS. The page fault happens when you
first time <strong>touch the page</strong>.</p>

<h2 id="thread-state-changes">Thread state changes</h2>

<p>Now let’s try to understand how the thread state changes over time. Is a whole <code class="language-plaintext highlighter-rouge">writeBytes</code> executed in
<code class="language-plaintext highlighter-rouge">_thread_in_vm</code>? Or maybe we go from <code class="language-plaintext highlighter-rouge">_thread_in_Java</code> to <code class="language-plaintext highlighter-rouge">_thread_in_native</code> and then we hit <code class="language-plaintext highlighter-rouge">_thread_in_vm</code>?</p>

<p>We will use such a program to track it:</p>

<div class="language-java highlighter-rouge"><div class="highlight"><pre class="highlight"><code><span class="kn">import</span> <span class="nn">java.io.BufferedOutputStream</span><span class="o">;</span>
<span class="kn">import</span> <span class="nn">java.io.FileOutputStream</span><span class="o">;</span>

<span class="kd">class</span> <span class="nc">Temp</span> <span class="o">{</span>
    <span class="kd">public</span> <span class="kd">static</span> <span class="kt">void</span> <span class="nf">main</span><span class="o">(</span><span class="nc">String</span><span class="o">[]</span> <span class="n">args</span><span class="o">)</span> <span class="kd">throws</span> <span class="nc">Exception</span> <span class="o">{</span>
        <span class="kt">byte</span><span class="o">[]</span> <span class="n">arr</span> <span class="o">=</span> <span class="k">new</span> <span class="kt">byte</span><span class="o">[</span><span class="mi">300</span> <span class="o">*</span> <span class="mi">1024</span> <span class="o">*</span> <span class="mi">1024</span><span class="o">];</span>
        <span class="k">for</span> <span class="o">(</span><span class="kt">int</span> <span class="n">i</span> <span class="o">=</span> <span class="mi">0</span><span class="o">;</span> <span class="n">i</span> <span class="o">&lt;</span> <span class="n">arr</span><span class="o">.</span><span class="na">length</span><span class="o">;</span> <span class="n">i</span><span class="o">++)</span> <span class="o">{</span>
            <span class="n">arr</span><span class="o">[</span><span class="n">i</span><span class="o">]</span> <span class="o">=</span> <span class="o">(</span><span class="kt">byte</span><span class="o">)</span> <span class="n">i</span><span class="o">;</span>
        <span class="o">}</span>

        <span class="nc">Thread</span><span class="o">.</span><span class="na">sleep</span><span class="o">(</span><span class="mi">3000</span><span class="o">);</span>
        <span class="k">try</span> <span class="o">(</span><span class="nc">BufferedOutputStream</span> <span class="n">bos</span> <span class="o">=</span> <span class="k">new</span> <span class="nc">BufferedOutputStream</span><span class="o">(</span><span class="k">new</span> <span class="nc">FileOutputStream</span><span class="o">(</span><span class="s">"/home/&lt;username&gt;/tmp.tmp"</span><span class="o">)))</span> <span class="o">{</span>
            <span class="n">bos</span><span class="o">.</span><span class="na">write</span><span class="o">(</span><span class="n">arr</span><span class="o">);</span>
        <span class="o">}</span>
    <span class="o">}</span>
<span class="o">}</span>
</code></pre></div></div>

<p>Let’s customize our JVM a bit and add custom debug <code class="language-plaintext highlighter-rouge">printf</code>.</p>

<p>File <code class="language-plaintext highlighter-rouge">io_util.c</code>:</p>

<div class="language-c highlighter-rouge"><div class="highlight"><pre class="highlight"><code><span class="cp">#define BUF_SIZE 8192
</span>
<span class="kt">void</span>
<span class="nf">writeBytes</span><span class="p">(</span><span class="n">JNIEnv</span> <span class="o">*</span><span class="n">env</span><span class="p">,</span> <span class="n">jobject</span> <span class="n">this</span><span class="p">,</span> <span class="n">jbyteArray</span> <span class="n">bytes</span><span class="p">,</span>
           <span class="n">jint</span> <span class="n">off</span><span class="p">,</span> <span class="n">jint</span> <span class="n">len</span><span class="p">,</span> <span class="n">jboolean</span> <span class="n">append</span><span class="p">,</span> <span class="n">jfieldID</span> <span class="n">fid</span><span class="p">)</span>
<span class="p">{</span>
    <span class="n">printf</span><span class="p">(</span> <span class="s">"WriteBytes start</span><span class="se">\n</span><span class="s">"</span> <span class="p">);</span>
    <span class="p">...</span>
    <span class="k">if</span> <span class="p">(</span><span class="n">len</span> <span class="o">==</span> <span class="mi">0</span><span class="p">)</span> <span class="p">{</span>
        <span class="k">return</span><span class="p">;</span>
    <span class="p">}</span> <span class="k">else</span> <span class="k">if</span> <span class="p">(</span><span class="n">len</span> <span class="o">&gt;</span> <span class="n">BUF_SIZE</span><span class="p">)</span> <span class="p">{</span>
        <span class="n">printf</span><span class="p">(</span> <span class="s">"Malloc start</span><span class="se">\n</span><span class="s">"</span> <span class="p">);</span>
        <span class="n">buf</span> <span class="o">=</span> <span class="n">malloc</span><span class="p">(</span><span class="n">len</span><span class="p">);</span>
        <span class="n">printf</span><span class="p">(</span> <span class="s">"Malloc ended</span><span class="se">\n</span><span class="s">"</span> <span class="p">);</span>
        <span class="k">if</span> <span class="p">(</span><span class="n">buf</span> <span class="o">==</span> <span class="nb">NULL</span><span class="p">)</span> <span class="p">{</span>
            <span class="n">JNU_ThrowOutOfMemoryError</span><span class="p">(</span><span class="n">env</span><span class="p">,</span> <span class="nb">NULL</span><span class="p">);</span>
            <span class="k">return</span><span class="p">;</span>
        <span class="p">}</span>
    <span class="p">}</span> <span class="k">else</span> <span class="p">{</span>
        <span class="n">buf</span> <span class="o">=</span> <span class="n">stackBuf</span><span class="p">;</span>
    <span class="p">}</span>
    <span class="n">printf</span><span class="p">(</span> <span class="s">"GetByteArrayRegion start</span><span class="se">\n</span><span class="s">"</span> <span class="p">);</span>
    <span class="p">(</span><span class="o">*</span><span class="n">env</span><span class="p">)</span><span class="o">-&gt;</span><span class="n">GetByteArrayRegion</span><span class="p">(</span><span class="n">env</span><span class="p">,</span> <span class="n">bytes</span><span class="p">,</span> <span class="n">off</span><span class="p">,</span> <span class="n">len</span><span class="p">,</span> <span class="p">(</span><span class="n">jbyte</span> <span class="o">*</span><span class="p">)</span><span class="n">buf</span><span class="p">);</span>
    <span class="n">printf</span><span class="p">(</span> <span class="s">"GetByteArrayRegion ended</span><span class="se">\n</span><span class="s">"</span> <span class="p">);</span>
    <span class="p">...</span>
    <span class="k">if</span> <span class="p">(</span><span class="n">buf</span> <span class="o">!=</span> <span class="n">stackBuf</span><span class="p">)</span> <span class="p">{</span>
        <span class="n">free</span><span class="p">(</span><span class="n">buf</span><span class="p">);</span>
    <span class="p">}</span>
    <span class="n">printf</span><span class="p">(</span> <span class="s">"WriteBytes end</span><span class="se">\n</span><span class="s">"</span> <span class="p">);</span>
<span class="p">}</span>
</code></pre></div></div>

<p>And let’s modify <code class="language-plaintext highlighter-rouge">thread.hpp</code>:</p>

<div class="language-c highlighter-rouge"><div class="highlight"><pre class="highlight"><code>  <span class="n">JavaThreadState</span> <span class="n">thread_state</span><span class="p">()</span> <span class="k">const</span>           <span class="p">{</span> <span class="k">return</span> <span class="n">_thread_state</span><span class="p">;</span> <span class="p">}</span>
  <span class="kt">void</span> <span class="nf">set_thread_state</span><span class="p">(</span><span class="n">JavaThreadState</span> <span class="n">s</span><span class="p">)</span>       <span class="p">{</span>
    <span class="n">printf</span><span class="p">(</span> <span class="s">"New thread state (%ld) %d -&gt; %d: </span><span class="se">\n</span><span class="s">"</span><span class="p">,</span> <span class="n">os</span><span class="o">::</span><span class="n">current_thread_id</span><span class="p">(),</span>  <span class="n">_thread_state</span><span class="p">,</span> <span class="n">s</span> <span class="p">);</span>
    <span class="n">assert</span><span class="p">(</span><span class="n">current_or_null</span><span class="p">()</span> <span class="o">==</span> <span class="nb">NULL</span> <span class="o">||</span> <span class="n">current_or_null</span><span class="p">()</span> <span class="o">==</span> <span class="n">this</span><span class="p">,</span>
           <span class="s">"state change should only be called by the current thread"</span><span class="p">);</span>
    <span class="n">_thread_state</span> <span class="o">=</span> <span class="n">s</span><span class="p">;</span>
  <span class="p">}</span>
</code></pre></div></div>

<p>The output:</p>

<div class="language-plaintext highlighter-rouge"><div class="highlight"><pre class="highlight"><code>WriteBytes start
New thread state (346625) 4 -&gt; 5: 
New thread state (346625) 5 -&gt; 6: 
New thread state (346625) 6 -&gt; 7: 
New thread state (346625) 7 -&gt; 4: 
Malloc start
Malloc ended
GetByteArrayRegion start
New thread state (346625) 4 -&gt; 5: 
New thread state (346625) 5 -&gt; 6: 
New thread state (346625) 6 -&gt; 7: 
New thread state (346625) 7 -&gt; 4: 
GetByteArrayRegion ended
New thread state (346625) 4 -&gt; 5: 
New thread state (346625) 5 -&gt; 6: 
New thread state (346625) 6 -&gt; 7: 
New thread state (346625) 7 -&gt; 4: 
New thread state (346625) 4 -&gt; 5: 
New thread state (346625) 5 -&gt; 6: 
New thread state (346625) 6 -&gt; 7: 
New thread state (346625) 7 -&gt; 4: 
New thread state (346625) 4 -&gt; 5: 
New thread state (346625) 5 -&gt; 6: 
New thread state (346625) 6 -&gt; 7: 
New thread state (346625) 7 -&gt; 4: 
New thread state (346625) 4 -&gt; 5: 
New thread state (346625) 5 -&gt; 6: 
New thread state (346625) 6 -&gt; 7: 
New thread state (346625) 7 -&gt; 4: 
WriteBytes end
</code></pre></div></div>

<p>Now we have a bunch of <strong>magic numbers</strong>, the dictionary for them is in the <code class="language-plaintext highlighter-rouge">globalDefinitions.hpp</code>:</p>

<div class="language-c highlighter-rouge"><div class="highlight"><pre class="highlight"><code><span class="k">enum</span> <span class="n">JavaThreadState</span> <span class="p">{</span>
  <span class="n">_thread_uninitialized</span>     <span class="o">=</span>  <span class="mi">0</span><span class="p">,</span> <span class="c1">// should never happen (missing initialization)</span>
  <span class="n">_thread_new</span>               <span class="o">=</span>  <span class="mi">2</span><span class="p">,</span> <span class="c1">// just starting up, i.e., in process of being initialized</span>
  <span class="n">_thread_new_trans</span>         <span class="o">=</span>  <span class="mi">3</span><span class="p">,</span> <span class="c1">// corresponding transition state (not used, included for completness)</span>
  <span class="n">_thread_in_native</span>         <span class="o">=</span>  <span class="mi">4</span><span class="p">,</span> <span class="c1">// running in native code</span>
  <span class="n">_thread_in_native_trans</span>   <span class="o">=</span>  <span class="mi">5</span><span class="p">,</span> <span class="c1">// corresponding transition state</span>
  <span class="n">_thread_in_vm</span>             <span class="o">=</span>  <span class="mi">6</span><span class="p">,</span> <span class="c1">// running in VM</span>
  <span class="n">_thread_in_vm_trans</span>       <span class="o">=</span>  <span class="mi">7</span><span class="p">,</span> <span class="c1">// corresponding transition state</span>
  <span class="n">_thread_in_Java</span>           <span class="o">=</span>  <span class="mi">8</span><span class="p">,</span> <span class="c1">// running in Java or in stub code</span>
  <span class="n">_thread_in_Java_trans</span>     <span class="o">=</span>  <span class="mi">9</span><span class="p">,</span> <span class="c1">// corresponding transition state (not used, included for completness)</span>
  <span class="n">_thread_blocked</span>           <span class="o">=</span> <span class="mi">10</span><span class="p">,</span> <span class="c1">// blocked in vm</span>
  <span class="n">_thread_blocked_trans</span>     <span class="o">=</span> <span class="mi">11</span><span class="p">,</span> <span class="c1">// corresponding transition state</span>
  <span class="n">_thread_max_state</span>         <span class="o">=</span> <span class="mi">12</span>  <span class="c1">// maximum thread state+1 - used for statistics allocation</span>
<span class="p">};</span>
</code></pre></div></div>

<p>Our thread state path looks like this (I skipped the <code class="language-plaintext highlighter-rouge">_trans</code> states):</p>

<div class="language-plaintext highlighter-rouge"><div class="highlight"><pre class="highlight"><code>_thread_in_native
WriteBytes start 
_thread_in_vm  
_thread_in_native 
Malloc start
Malloc ended
GetByteArrayRegion start 
_thread_in_vm  
_thread_in_native 
GetByteArrayRegion ended 
_thread_in_vm  
_thread_in_native  
_thread_in_vm  
_thread_in_native  
_thread_in_vm  
_thread_in_native  
_thread_in_vm  
_thread_in_native 
WriteBytes end
</code></pre></div></div>

<p>So the <strong>answer</strong> is that the <code class="language-plaintext highlighter-rouge">writeBytes</code> executes code in <code class="language-plaintext highlighter-rouge">_thread_in_native</code> and switches to <code class="language-plaintext highlighter-rouge">_thread_in_vm</code> 
when needed.</p>]]></content><author><name></name></author><summary type="html"><![CDATA[[Java][Profiling][JVM] JVM thread state changes by example]]></summary></entry><entry><title type="html">[Java][Profiling][JVM] Everybody lies, profilers too</title><link href="https://krzysztofslusarski.github.io/2022/03/21/everybody-lies.html" rel="alternate" type="text/html" title="[Java][Profiling][JVM] Everybody lies, profilers too" /><published>2022-03-21T01:51:30+00:00</published><updated>2022-03-21T01:51:30+00:00</updated><id>https://krzysztofslusarski.github.io/2022/03/21/everybody-lies</id><content type="html" xml:base="https://krzysztofslusarski.github.io/2022/03/21/everybody-lies.html"><![CDATA[<h1 id="javaprofilingjvm-everybody-lies-profilers-too">[Java][Profiling][JVM] Everybody lies, profilers too</h1>

<p>There is an excellent presentation on YouTube called <a href="https://www.youtube.com/watch?v=7IkHIqPeFjY" target="_blank">Profilers are lying hobbitses</a>
by <strong>Nitsan Wakart</strong>. I strongly recommend you to watch it. Here is another example of lie from profilers.</p>

<h2 id="profiled-application">Profiled application</h2>

<p>Simple class:</p>

<div class="language-java highlighter-rouge"><div class="highlight"><pre class="highlight"><code><span class="kn">import</span> <span class="nn">java.util.ArrayList</span><span class="o">;</span>
<span class="kn">import</span> <span class="nn">java.util.List</span><span class="o">;</span>

<span class="cm">/** Andrei Pangin is an author of that reproduction. Details later. */</span>
<span class="kd">public</span> <span class="kd">class</span> <span class="nc">ArrayListGrow</span> <span class="o">{</span>
    <span class="kd">static</span> <span class="kd">final</span> <span class="kt">int</span> <span class="no">SIZE</span> <span class="o">=</span> <span class="mi">2048</span><span class="o">;</span>
    <span class="kd">static</span> <span class="kd">volatile</span> <span class="nc">List</span><span class="o">&lt;</span><span class="nc">Object</span><span class="o">&gt;</span> <span class="n">tmp</span><span class="o">;</span>

    <span class="kd">static</span> <span class="kt">void</span> <span class="nf">runTest</span><span class="o">()</span> <span class="o">{</span>
        <span class="nc">List</span><span class="o">&lt;</span><span class="nc">Object</span><span class="o">&gt;</span> <span class="n">list</span> <span class="o">=</span> <span class="k">new</span> <span class="nc">ArrayList</span><span class="o">&lt;&gt;(</span><span class="no">SIZE</span><span class="o">);</span>
        <span class="n">fill</span><span class="o">(</span><span class="n">list</span><span class="o">);</span>
        <span class="n">tmp</span> <span class="o">=</span> <span class="n">list</span><span class="o">;</span>
    <span class="o">}</span>

    <span class="kd">static</span> <span class="kt">void</span> <span class="nf">fill</span><span class="o">(</span><span class="nc">List</span><span class="o">&lt;</span><span class="nc">Object</span><span class="o">&gt;</span> <span class="n">list</span><span class="o">)</span> <span class="o">{</span>
        <span class="k">for</span> <span class="o">(</span><span class="kt">int</span> <span class="n">i</span> <span class="o">=</span> <span class="mi">0</span><span class="o">;</span> <span class="n">i</span> <span class="o">&lt;</span> <span class="no">SIZE</span><span class="o">;</span> <span class="n">i</span><span class="o">++)</span> <span class="o">{</span>
            <span class="n">list</span><span class="o">.</span><span class="na">add</span><span class="o">(</span><span class="n">i</span><span class="o">);</span>
        <span class="o">}</span>
    <span class="o">}</span>

    <span class="kd">static</span> <span class="kt">void</span> <span class="nf">spoil</span><span class="o">()</span> <span class="o">{</span>
        <span class="k">for</span> <span class="o">(</span><span class="kt">int</span> <span class="n">i</span> <span class="o">=</span> <span class="mi">0</span><span class="o">;</span> <span class="n">i</span> <span class="o">&lt;</span> <span class="mi">1000000</span><span class="o">;</span> <span class="n">i</span><span class="o">++)</span> <span class="o">{</span>
            <span class="k">new</span> <span class="nc">ArrayList</span><span class="o">&lt;&gt;(</span><span class="mi">0</span><span class="o">).</span><span class="na">add</span><span class="o">(</span><span class="s">""</span><span class="o">);</span>
        <span class="o">}</span>
    <span class="o">}</span>

    <span class="kd">public</span> <span class="kd">static</span> <span class="kt">void</span> <span class="nf">main</span><span class="o">(</span><span class="nc">String</span><span class="o">[]</span> <span class="n">args</span><span class="o">)</span> <span class="o">{</span>
        <span class="n">spoil</span><span class="o">();</span>

        <span class="k">while</span> <span class="o">(</span><span class="kc">true</span><span class="o">)</span> <span class="o">{</span>
            <span class="n">runTest</span><span class="o">();</span>
        <span class="o">}</span>
    <span class="o">}</span>
<span class="o">}</span>
</code></pre></div></div>

<p>Let’s run that code using Amazon Corretto 1.8.0_312, and run the <strong>Async-profiler</strong> in CPU mode.</p>

<div class="language-shell highlighter-rouge"><div class="highlight"><pre class="highlight"><code>./profiler.sh <span class="nt">-d</span> 10 ArrayListGrow
</code></pre></div></div>

<p>The beginning of the <strong>output</strong> is:</p>

<div class="language-plaintext highlighter-rouge"><div class="highlight"><pre class="highlight"><code>Profiling for 10 seconds
Done
--- Execution profile ---
Total samples       : 1020

--- 8199255026 ns (80.37%), 820 samples
  [ 0] java.util.Arrays.copyOf
  [ 1] java.util.ArrayList.grow
  [ 2] java.util.ArrayList.ensureExplicitCapacity
  [ 3] java.util.ArrayList.ensureCapacityInternal
  [ 4] java.util.ArrayList.add
  [ 5] ArrayListGrow.fill
  [ 6] ArrayListGrow.runTest
  [ 7] ArrayListGrow.main
</code></pre></div></div>

<p>That means that our <code class="language-plaintext highlighter-rouge">ArrayList</code> executes method <code class="language-plaintext highlighter-rouge">grow()</code> while adding an element. That <code class="language-plaintext highlighter-rouge">add</code> is invoked
from <code class="language-plaintext highlighter-rouge">ArrayListGrow.fill</code>. But <strong>how is it possible</strong>? That list is created with <code class="language-plaintext highlighter-rouge">new ArrayList&lt;&gt;(SIZE)</code> and we are adding
exactly <code class="language-plaintext highlighter-rouge">SIZE</code> elements. The <code class="language-plaintext highlighter-rouge">ArrayList</code> shouldn’t grow in that case. Let’s run it in the debugger. Let’s create
a breakpoint at <code class="language-plaintext highlighter-rouge">runTest()</code> line to skip the <code class="language-plaintext highlighter-rouge">spoil()</code> part first:</p>

<p><img src="/assets/everybody-lies/1.png" alt="alt text" title="1" /></p>

<p>Now let’s remove that one and create one in <code class="language-plaintext highlighter-rouge">ArrayList.grow()</code>:</p>

<p><img src="/assets/everybody-lies/2.png" alt="alt text" title="2" /></p>

<p>Let’s hit continue, so debugger could stop in the new breakpoint… and it <strong>doesn’t want to stop</strong>. So the profiler shows us a huge 
usage of <code class="language-plaintext highlighter-rouge">ArrayList.grow()</code>, and the debugger shows us no usage of that method. Who should we trust?</p>

<p>This time the debugger has right, but we cannot blame any profiler for that lie since this is a …</p>

<h2 id="jvm-bug">JVM bug</h2>

<p>That bug was originally spotted by me, the original discussion over that topic is
<a href="https://github.com/jvm-profiling-tools/async-profiler/discussions/541" target="_blank">here</a>. My reconstruction was
much more complicated than Andrei’s, that’s why I prefer to show his version. The bug is registered with number
<a href="https://bugs.openjdk.java.net/browse/JDK-8281677" target="_blank">JDK-8281677</a>.</p>

<p>This bug hurts all profilers that use <code class="language-plaintext highlighter-rouge">AsyncGetCallTrace</code> or <code class="language-plaintext highlighter-rouge">PerfMapAgent</code>, so basically every modern profilers
(Async-profiler, JProfiler in async mode, Perf + PMA, eBpf profiler + PMA, …).</p>

<p>This bug <strong>is not just an</strong> <code class="language-plaintext highlighter-rouge">ArrayList</code> issue. I encountered multiple parts of my code where profiler lied to me because of that.</p>]]></content><author><name></name></author><summary type="html"><![CDATA[[Java][Profiling][JVM] Everybody lies, profilers too]]></summary></entry><entry><title type="html">[Java][JVM] Core dump - the last line of defence during outages</title><link href="https://krzysztofslusarski.github.io/2021/11/14/coredump.html" rel="alternate" type="text/html" title="[Java][JVM] Core dump - the last line of defence during outages" /><published>2021-11-14T05:51:30+00:00</published><updated>2021-11-14T05:51:30+00:00</updated><id>https://krzysztofslusarski.github.io/2021/11/14/coredump</id><content type="html" xml:base="https://krzysztofslusarski.github.io/2021/11/14/coredump.html"><![CDATA[<h1 id="javajvm-core-dump---the-last-line-of-defence-during-outages">[Java][JVM] Core dump - the last line of defence during outages</h1>

<h2 id="context">Context</h2>

<p>There are situations where an application running on the JVM doesn’t respond. It can be so unresponsive that you cannot attach to it with any of the external 
tools, like <strong>JMX client</strong>, <strong>jcmd</strong>, <strong>jstack</strong>, <strong>jmap</strong> and so on. The first thought may be to restart the JVM. It will probably help, but during such
a situation the application is in a specific <strong>state</strong>. If you restart the application, that state is lost.</p>

<h2 id="the-jvm-is-just-a-process">The JVM is just a process</h2>

<p>You need to understand that the JVM is just a process from an operating system perspective. The OS offers us tools to diagnose unresponsive processes. The
easiest way is to fetch a <a href="https://en.wikipedia.org/wiki/Core_dump">core dump</a>. You can do it with a single line:</p>

<div class="language-shell highlighter-rouge"><div class="highlight"><pre class="highlight"><code>gcore <span class="nt">-o</span> &lt;filename&gt; &lt;pid&gt;
</code></pre></div></div>

<p>It will create a very large file <code class="language-plaintext highlighter-rouge">&lt;filename&gt;.&lt;pid&gt;</code>. This operation may take a while.</p>

<h2 id="what-can-we-do-with-such-a-dump">What can we do with such a dump?</h2>

<p>Since JDK 9 there is a tool called <code class="language-plaintext highlighter-rouge">jhsdb</code> delivered in every JDK. With that tool you can manipulate the core dump in multiple ways. The two basic modes
are:</p>

<h3 id="heap-dump">Heap dump</h3>

<p>You can fetch the heap dump from a core dump using:</p>
<div class="language-shell highlighter-rouge"><div class="highlight"><pre class="highlight"><code>jhsdb jmap <span class="nt">--binaryheap</span> <span class="nt">--dumpfile</span> &lt;output hprof file&gt; <span class="nt">--core</span> &lt;core dump file&gt; <span class="nt">--exe</span> &lt;path to java exe&gt;
</code></pre></div></div>

<p><strong>Mind that</strong> the <code class="language-plaintext highlighter-rouge">jhsdb</code> and <code class="language-plaintext highlighter-rouge">java</code>, that is pointed as a last argument, must be from exactly the same distribution as the JVM, from which the core dump
has been created.</p>

<h3 id="thread-dump">Thread dump</h3>

<p>You can fetch the heap dump from a core dump using:</p>
<div class="language-shell highlighter-rouge"><div class="highlight"><pre class="highlight"><code>jhsdb jstack <span class="nt">--core</span> &lt;core dump file&gt; <span class="nt">--exe</span> &lt;path to java exe&gt;
</code></pre></div></div>

<h2 id="there-is-more">There is more…</h2>

<p>There are other modes of the <code class="language-plaintext highlighter-rouge">jhsdb</code>, see the help of that tool to see if they are useful to you.</p>

<p>You can also find it useful that the core dump is just a process memory snapshot, so you can do everything you could do with other core dumps. For example:
you can attach the <code class="language-plaintext highlighter-rouge">gdb</code> to your dump:</p>

<div class="language-shell highlighter-rouge"><div class="highlight"><pre class="highlight"><code>gdb &lt;path to java exe&gt; &lt;core dump file&gt;
</code></pre></div></div>

<p>That will open you the GNU debugger. Sometimes this is useful, when you need to check where your threads have hung. Unfortunately there is an assembly code
and native stacks, but it is better than nothing.</p>]]></content><author><name></name></author><summary type="html"><![CDATA[[Java][JVM] Core dump - the last line of defence during outages]]></summary></entry><entry><title type="html">[Java][JMX][Monitoring] The ultimate monitoring of the JVM application - out of the box</title><link href="https://krzysztofslusarski.github.io/2021/09/04/jmx.html" rel="alternate" type="text/html" title="[Java][JMX][Monitoring] The ultimate monitoring of the JVM application - out of the box" /><published>2021-09-04T05:51:30+00:00</published><updated>2021-09-04T05:51:30+00:00</updated><id>https://krzysztofslusarski.github.io/2021/09/04/jmx</id><content type="html" xml:base="https://krzysztofslusarski.github.io/2021/09/04/jmx.html"><![CDATA[<h1 id="javajmxmonitoring-the-ultimate-monitoring-of-the-jvm-application---out-of-the-box">[Java][JMX][Monitoring] The ultimate monitoring of the JVM application - out of the box</h1>

<h2 id="context">Context</h2>

<p>Most of the applications I saw were deployed at the virtual machine. Most of them used <em>Spring Boot</em> with <em>Tomcat</em> as
a web server and <em>Hikari</em> as a connection pool. In this article I’m going to show you metrics from that technology.
If you are using others, you need to find corresponding metrics by yourself. The JMX mbean names are taken from
the <strong>Java 11</strong> with the <strong>G1GC</strong>.</p>

<p>Mind that some of the following metrics may have no sense in the cloud.</p>

<h2 id="foreword">Foreword</h2>

<p>This article is very long because there are a lot of metrics that you should focus on. In my applications I have all
of those metrics gathered in one dashboard. It is the first place I look when there is some outage. That dashboard 
doesn’t tell me the exact cause of the outage, but directs me to the source of the problem.</p>

<h2 id="hardware">Hardware</h2>

<p>Let’s start from the bottom. We have <strong>four</strong> crucial hardware components that almost all applications use:</p>
<ul>
  <li><strong>CPU</strong></li>
  <li><strong>RAM</strong></li>
  <li><strong>Disk</strong></li>
  <li><strong>Network</strong></li>
</ul>

<p>Mind that there are other components, like disk controllers, bridges and so on, but I’m going to focus on those four.</p>

<h3 id="cpu">CPU</h3>

<h4 id="cpu-utilization-chart-7-days">CPU utilization chart (7 days)</h4>

<p><img src="/assets/jmx-jvm/hw-cpu.png" alt="alt text" title="1" /></p>

<p>Possible failures:</p>

<ul>
  <li>The <strong>100%</strong> utilization of <strong>all</strong> cores</li>
  <li>The <strong>100%</strong> utilization of <strong>one</strong> core</li>
</ul>

<p>In this situation you need to check if that resource is utilized by your JVM. The first one can be easily diagnosed by 
<strong>JMX</strong>, I’m going to cover that later. The second one I usually diagnose at <strong>OS</strong> level using <code class="language-plaintext highlighter-rouge">pidstat -t &lt;time interval&gt;</code>.</p>

<h3 id="ram">RAM</h3>

<h4 id="available-memory-chart-7-days">Available memory chart (7 days)</h4>

<p><img src="/assets/jmx-jvm/hw-ram-1.png" alt="alt text" title="1" />
<img src="/assets/jmx-jvm/hw-ram-2.png" alt="alt text" title="1" /></p>

<p>You need to understand the difference between <strong>available</strong> and <strong>free</strong> memory. I suggest you read the beginning
of the <code class="language-plaintext highlighter-rouge">man free</code> at Linux. Long story short, your OS has internal caches and buffers. Those are used to help 
the performance of your application. Your OS can use them if there is enough memory available. If your application
needs the memory used before by cache/buffer, the OS will remove that cache/buffer to make that memory available for 
you.</p>

<p>Simplifying:</p>
<ul>
  <li><strong>Available memory</strong> - how much memory is available for your application</li>
  <li><strong>Free memory</strong> - how much memory is not used by any application and OS</li>
</ul>

<p>Possible failures:</p>
<ul>
  <li><strong>0 bytes</strong> of the available memory - this is a situation where out-of-memory killer kicks in</li>
  <li>The available memory drops to the level, where crucial cache/buffer is removed</li>
</ul>

<p>The first situation is shown in the second chart above. The available memory dropped to <strong>0</strong>, OOM killer killed the JVM.
In that situation you need to check the OS logs to find out which process ate that memory.</p>

<p>The second situation is easy to diagnose when you look also at your next resource.</p>

<h3 id="disk">Disk</h3>

<h4 id="io-operations-readswrites-chart-1-day">IO operations (reads/writes) chart (1 day)</h4>

<p><img src="/assets/jmx-jvm/hw-io-1.png" alt="alt text" title="1" />
<img src="/assets/jmx-jvm/hw-io-2.png" alt="alt text" title="1" /></p>

<p>Possible failures:</p>
<ul>
  <li><strong>Huge increase</strong> of IO operations</li>
</ul>

<p>The IO operations don’t appear out of nowhere. If the increase of <strong>IO reads</strong> is correlated with reduction of <strong>available
memory</strong> then you probably have a situation where a crucial cache/buffer is removed (shown at second chart above). 
In that situation you need to check <strong>RAM</strong> consumption to check which process eats the memory.</p>

<p>The increase of <strong>IO operations</strong> can be done by your JVM, you can check it with <code class="language-plaintext highlighter-rouge">pidstat -d &lt;time interval&gt;</code> at Linux. 
If that is your problem I suggest using the <strong>async-profiler</strong> in <strong>wall</strong> mode. With that profiler you can easily find
the part of your code that is using the IO.</p>

<h3 id="network">Network</h3>

<h4 id="net-transfer-inout-chart-1-day">Net transfer (in/out) chart (1 day)</h4>

<p><img src="/assets/jmx-jvm/hw-net.png" alt="alt text" title="1" /></p>

<p>Possible failures:</p>
<ul>
  <li><strong>Huge increase</strong> of the traffic</li>
  <li>No traffic</li>
</ul>

<p>In the first situation first you need to check if that traffic is done by your JVM. There are multiple tools to 
check it, I like the <code class="language-plaintext highlighter-rouge">nethogs</code>.  If that traffic is generated by the JVM then, again, the <strong>async-profiler</strong>
at <strong>wall</strong> mode is going to show you what part of your application generates it.</p>

<p>If there is no traffic, then:</p>
<ul>
  <li>You should check your health check endpoint if this is a way you inform other applications about the availability of 
your system</li>
  <li>You should check your service discovery/load balancer if you are using one, maybe there is some failure</li>
</ul>

<h2 id="jvm-from-jmx">JVM (from JMX)</h2>

<h3 id="cpu-again">CPU (again)</h3>

<h4 id="cpu-utilization-chart-7-days-1">CPU utilization chart (7 days)</h4>
<p><img src="/assets/jmx-jvm/cpu-1.png" alt="alt text" title="1" />
<img src="/assets/jmx-jvm/cpu-2.png" alt="alt text" title="1" />
<img src="/assets/jmx-jvm/cpu-3.png" alt="alt text" title="1" /></p>

<ul>
  <li>Object name - <code class="language-plaintext highlighter-rouge">java.lang:type=OperatingSystem</code></li>
  <li>Attributes - <code class="language-plaintext highlighter-rouge">SystemCpuLoad</code> and <code class="language-plaintext highlighter-rouge">ProcessCpuLoad</code></li>
</ul>

<p>The JVM reports through the JMX two metrics, the CPU utilization from OS level (which is the same as the first metric in this article), 
and how much of that utilization is done by that JVM. Comparing those two values can give you the information if your
application is responsible for the utilization. The last chart above shows the case where the application cannot 
perform well, because another process consumes a whole CPU.</p>

<h3 id="heap-after-gc">Heap after GC</h3>

<p>I’ve already written why that metric is useful in the <a href="https://krzysztofslusarski.github.io/2021/07/17/monday-hagc.html" target="_blank">previous article</a>.</p>

<h4 id="heap-after-gc-chart-7-days">Heap after GC chart (7 days)</h4>

<p><img src="/assets/jmx-jvm/after-1.png" alt="alt text" title="1" />
<img src="/assets/jmx-jvm/after-2.png" alt="alt text" title="1" />
<img src="/assets/jmx-jvm/after-3.png" alt="alt text" title="1" /></p>

<p>The committed, and the max heap size can be obtained from:</p>
<ul>
  <li>Object name - <code class="language-plaintext highlighter-rouge">java.lang:type=Memory</code></li>
  <li>Attribute - <code class="language-plaintext highlighter-rouge">HeapMemoryUsage</code> - a complex type with <code class="language-plaintext highlighter-rouge">max</code> and <code class="language-plaintext highlighter-rouge">committed</code> attributes</li>
</ul>

<p>The heap after GC can be obtained from:</p>
<ul>
  <li>Object name - <code class="language-plaintext highlighter-rouge">java.lang:name=G1 Young Generation,type=GarbageCollector</code></li>
  <li>Attribute - <code class="language-plaintext highlighter-rouge">LastGcInfo</code> - a complex type with <code class="language-plaintext highlighter-rouge">memoryUsageAfterGc</code> attribute</li>
</ul>

<p>I use that chart to find out if there is a <strong>heap memory leak</strong>. Check the <a href="https://krzysztofslusarski.github.io/2021/07/17/monday-hagc.html" target="_blank">previous article</a>
for details. The last chart above shows the memory leak. If you have a memory leak in your application then
you have to analyze the <strong>heap dump</strong>.</p>

<h3 id="heap-before-gc">Heap before GC</h3>

<p>I’ve already written why that metric is useful in the <a href="https://krzysztofslusarski.github.io/2021/07/28/monday-hbgc.html" target="_blank">previous article</a>.</p>

<h4 id="heap-before-gc-chart-7-days">Heap before GC chart (7 days)</h4>

<p><img src="/assets/jmx-jvm/before-1.png" alt="alt text" title="1" />
<img src="/assets/jmx-jvm/before-2.png" alt="alt text" title="1" /></p>

<p>The committed, and the max heap size can be obtained from:</p>
<ul>
  <li>Object name - <code class="language-plaintext highlighter-rouge">java.lang:type=Memory</code></li>
  <li>Attribute - <code class="language-plaintext highlighter-rouge">HeapMemoryUsage</code> - a complex type with <code class="language-plaintext highlighter-rouge">max</code> and <code class="language-plaintext highlighter-rouge">committed</code> attributes</li>
</ul>

<p>The heap before GC can be obtained from:</p>
<ul>
  <li>Object name - <code class="language-plaintext highlighter-rouge">java.lang:name=G1 Young Generation,type=GarbageCollector</code></li>
  <li>Attribute - <code class="language-plaintext highlighter-rouge">LastGcInfo</code> - a complex type with <code class="language-plaintext highlighter-rouge">memoryUsageBeforeGc</code> attribute</li>
</ul>

<p>I use that chart to find out if the heap <strong>is wasted</strong>, because the <strong>GC</strong> starts its work too early.
Check the <a href="https://krzysztofslusarski.github.io/2021/07/28/monday-hbgc.html" target="_blank">previous article</a>
for details. The second chart above shows the application where the <strong>GC</strong> runs inefficiently. If you have such a 
situation then you need to analyze the <strong>GC log</strong>.</p>

<h3 id="full-gc-count-g1gc">Full GC count (G1GC)</h3>

<h4 id="full-gc-count-chart-7-days">Full GC count chart (7 days)</h4>

<p><img src="/assets/jmx-jvm/fullgc-1.png" alt="alt text" title="1" />
<img src="/assets/jmx-jvm/fullgc-2.png" alt="alt text" title="1" />
<img src="/assets/jmx-jvm/fullgc-3.png" alt="alt text" title="1" />
<img src="/assets/jmx-jvm/fullgc-4.png" alt="alt text" title="1" />
<img src="/assets/jmx-jvm/fullgc-5.png" alt="alt text" title="1" /></p>

<ul>
  <li>Object name - <code class="language-plaintext highlighter-rouge">java.lang:name=G1 Old Generation,type=GarbageCollector</code></li>
  <li>Attributes - <code class="language-plaintext highlighter-rouge">CollectionCount</code></li>
</ul>

<p>The best situation is presented at the first chart: <strong>0 full GCs</strong>. Possible failures:</p>
<ul>
  <li><strong>Single Full GC</strong> (second chart) - for the most of the applications this is not a problem, but yours might be different</li>
  <li><strong>Few Full GCs</strong> in a short period (third chart)</li>
  <li><strong>Periodic Full GC</strong> (forth chart) - covered in the <a href="https://krzysztofslusarski.github.io/2021/05/16/fullgc.html" target="_blank">previous article</a></li>
  <li><strong>Multiple Full GCs</strong> (fifth chart)</li>
</ul>

<p>If you have a first situation, and it is a problem for you then you need to analyze <strong>GC logs</strong>. This is a place with information
why the <strong>G1GC</strong> has to run that phase.</p>

<p>If you have a second situation, it usually means that your application runs a part of code that needs almost all the
free heap. What I usually do in that situation is to check the <strong>access log</strong>, and the <strong>application log</strong>  to find
out what was going on in the time of full GCs. The <em>continuous profiling</em> is also useful in that case.</p>

<p>The last situation usually means that your application runs a part of code that needs more heap than you have. It usually
ends with <code class="language-plaintext highlighter-rouge">OutOfMemoryError</code>. I strongly recommend you to enable <code class="language-plaintext highlighter-rouge">-XX:+HeapDumpOnOutOfMemoryError</code>, it will 
dump you a <strong>heap dump</strong> when such a situation occurs, which is the best way to find the cause of it.</p>

<h3 id="code-cache-size">Code cache size</h3>

<h4 id="code-cache-size-chart-7-days">Code cache size chart (7 days)</h4>

<p><img src="/assets/jmx-jvm/code-cache-2.png" alt="alt text" title="1" /></p>

<ul>
  <li>Object name - <code class="language-plaintext highlighter-rouge">java.lang:name=CodeHeap 'non-profiled nmethods',type=MemoryPool</code> and
<code class="language-plaintext highlighter-rouge">java.lang:name=CodeHeap 'profiled nmethods',type=MemoryPool</code></li>
  <li>Attributes - <code class="language-plaintext highlighter-rouge">Usage</code> - a complex type with <code class="language-plaintext highlighter-rouge">max</code> and <code class="language-plaintext highlighter-rouge">committed</code> attributes</li>
</ul>

<p>Possible failures:</p>
<ul>
  <li><strong>Not enough</strong> code cache for a new compilation</li>
</ul>

<p>The <em>code cache</em> contains the <em>JIT compilations</em>. If that part of memory cannot fit a new compilation then the whole
<em>JIT</em> disables. After that, your application starts degrading the performance. You need to remember that the <em>code cache</em> 
can be <strong>fragmented</strong>. As a rule of thumb I assume that if the application uses <strong>&gt;=90%</strong> of that part of a memory, then
that part needs to be increased.</p>

<h3 id="off-heap-usage">Off-heap usage</h3>

<h4 id="off-heap-usage-charts-7-days">Off-heap usage charts (7 days)</h4>
<p><img src="/assets/jmx-jvm/off-heap-1.png" alt="alt text" title="1" />
<img src="/assets/jmx-jvm/off-heap-2.png" alt="alt text" title="1" /></p>

<ul>
  <li>Object name - <code class="language-plaintext highlighter-rouge">java.nio:name=direct,type=BufferPool</code> and
<code class="language-plaintext highlighter-rouge">java.nio:name=mapped,type=BufferPool</code></li>
  <li>Attributes - <code class="language-plaintext highlighter-rouge">MemoryUsed</code></li>
</ul>

<p>Possible failures:</p>
<ul>
  <li><strong>Too much</strong> memory allocated</li>
</ul>

<p>Most of the time the off-heap is used by frameworks/libraries. Those metrics are useful for control, if there is no 
memory leak in this area.</p>

<p>To find out what part of your code allocates the memory with these two mechanisms you can use:</p>
<ul>
  <li><strong>Heap dump</strong> for <code class="language-plaintext highlighter-rouge">DirectByteBuffer</code></li>
  <li><strong>Heap dump</strong> and <code class="language-plaintext highlighter-rouge">pmap</code> from OS level for <code class="language-plaintext highlighter-rouge">FileChannel</code></li>
</ul>

<h3 id="loaded-class-count">Loaded class count</h3>

<h3 id="loaded-class-count-chart-7-days">Loaded class count chart (7 days)</h3>
<p><img src="/assets/jmx-jvm/classes.png" alt="alt text" title="1" /></p>

<ul>
  <li>Object name - <code class="language-plaintext highlighter-rouge">java.lang:type=ClassLoading</code></li>
  <li>Attributes - <code class="language-plaintext highlighter-rouge">LoadedClassCount</code></li>
</ul>

<p>Possible failures:</p>
<ul>
  <li><strong>Memory leak at Metaspace</strong></li>
</ul>

<p>This problem was common in <strong>EJB servers</strong>. If you do not use hot swap, context reload, there is a little chance you 
have this leak. You need to remember that it is completely normal for that chart to be ascending. There are 
mechanisms (like the evil <strong>reflection</strong>) which create classes at runtime. If you think there is a memory leak
the first think you should look at are
<a href="https://krzysztofslusarski.github.io/2021/09/02/monday-class.html" target="_blank">classloader logs</a>.</p>

<p>The <strong>heap dump</strong> is also useful in that situation. It contains all class definitions and can tell you why they are
alive.</p>

<h3 id="hikari-active-connection-count">Hikari active connection count</h3>

<h4 id="hikari-active-connection-count-chart-7-days">Hikari active connection count chart (7 days)</h4>
<p><img src="/assets/jmx-jvm/active-connections.png" alt="alt text" title="1" /></p>

<ul>
  <li>Object name - <code class="language-plaintext highlighter-rouge">com.zaxxer.hikari:type=Pool (&lt;pool name&gt;)</code></li>
  <li>Attributes - <code class="language-plaintext highlighter-rouge">ActiveConnections</code></li>
</ul>

<p>This metric is useful for scaling and sizing your application. It tells you how many active connections you need to
your database. If this value is too big for you, your code may spend too much time with the opened transaction. The way
I’m finding such a situation in <em>Spring framework</em> is to take output for <strong>async-profiler</strong> in <strong>wall</strong> mode and 
look for long methods covered with <code class="language-plaintext highlighter-rouge">invokeWithinTransaction</code> method.</p>

<h3 id="hikari-threads-awaiting-connection">Hikari threads awaiting connection</h3>

<h4 id="hikari-threads-awaiting-connection-chart-7-days">Hikari threads awaiting connection chart (7 days)</h4>
<p><img src="/assets/jmx-jvm/avaiting-connections.png" alt="alt text" title="1" /></p>

<ul>
  <li>Object name - <code class="language-plaintext highlighter-rouge">com.zaxxer.hikari:type=Pool (&lt;pool name&gt;)</code></li>
  <li>Attributes - <code class="language-plaintext highlighter-rouge">ThreadsAwaitingConnection</code></li>
</ul>

<p>Possible failures:</p>
<ul>
  <li>A rapid increase from <strong>0</strong></li>
  <li>A constant value over <strong>0</strong></li>
</ul>

<p>The second situation is simple, your database connection pool has too low size to handle all the requests. Either your 
pool is too short, or you have a situation I’ve explained in the previous chapter.</p>

<p>The first situation (second chart above) means that you have one of the following issues:</p>
<ul>
  <li>A load to your application increased</li>
  <li>Your database slowed down</li>
  <li>Your application needed more time in transaction</li>
</ul>

<p>The last situation can be diagnosed the same way I’ve written above. The easiest way to diagnose the second option is to 
start from database level. There are dedicated tools to monitor that area like <em>Oracle Enterprise Manager</em></p>

<h3 id="tomcat-connection-count">Tomcat connection count</h3>

<h4 id="tomcat-connection-count-charts-75-days">Tomcat connection count charts (7/5 days)</h4>

<p><img src="/assets/jmx-jvm/tomcat-connection-count-1.png" alt="alt text" title="1" />
<img src="/assets/jmx-jvm/tomcat-connection-count-2.png" alt="alt text" title="1" /></p>

<ul>
  <li>Object name - <code class="language-plaintext highlighter-rouge">Tomcat:type=ThreadPool,name="&lt;pool name&gt;"</code></li>
  <li>Attributes - <code class="language-plaintext highlighter-rouge">connectionCount</code></li>
</ul>

<p>Possible failures:</p>
<ul>
  <li><strong>Huge increase</strong> in a <strong>short</strong> period</li>
</ul>

<p>This metric tells you how many connections are established to your server. If it is increasing rapidly then most 
probably you encounter one of the following situations:</p>
<ul>
  <li>The number of requests is increasing</li>
  <li>The time for your application to handle the request is increasing</li>
</ul>

<p>You need to remember that if your application slows down the number of incoming requests don’t decrease. The only way
for an application server to handle the same amount of requests with slower application is to create more <em>worker threads</em>
and accept more connections. If it is your case (the second chart above) then you need to find why your application
is slower, the best way from my experiences is <strong>async-profiler</strong> in <strong>wall</strong> mode.</p>

<h3 id="created-thread-count">Created thread count</h3>

<h4 id="created-thread-count-chart-7-days">Created thread count chart (7 days)</h4>

<p><img src="/assets/jmx-jvm/created-threads.png" alt="alt text" title="1" /></p>

<ul>
  <li>Object name - <code class="language-plaintext highlighter-rouge">java.lang:type=Threading</code></li>
  <li>Attributes - <code class="language-plaintext highlighter-rouge">TotalStartedThreadCount</code></li>
</ul>

<p>If the number of created threads is increasing it means there is a lack of a thread pool. I’ve written 
<a href="https://krzysztofslusarski.github.io/2020/12/14/jdkbugs.html" target="_blank">an article</a> explaining
how to find the part of code that lacks that pool.</p>

<h3 id="current-thread-count">Current thread count</h3>

<h4 id="current-thread-count-charts-7-days">Current thread count charts (7 days)</h4>

<p><img src="/assets/jmx-jvm/threads-1.png" alt="alt text" title="1" />
<img src="/assets/jmx-jvm/threads-2.png" alt="alt text" title="1" />
<img src="/assets/jmx-jvm/threads-3.png" alt="alt text" title="1" /></p>

<ul>
  <li>Object name - <code class="language-plaintext highlighter-rouge">java.lang:type=Threading</code></li>
  <li>Attributes - <code class="language-plaintext highlighter-rouge">ThreadCount</code></li>
</ul>

<p>Possible failures:</p>
<ul>
  <li><strong>Thread leak</strong></li>
  <li><strong>Huge increase</strong> in a <strong>short</strong> period</li>
</ul>

<p>There are some situations where the application has thread leak, they are very rare. That situation can be diagnosed the same
way as creating too many threads. The <strong>huge increase</strong> of threads in a <strong>short</strong> period means pretty much the same
as increasing the tomcat connection count. The application needs more threads to do its work. We can find the reason
with <strong>async-profiler</strong> in <strong>wall</strong> mode.</p>

<h2 id="afterword">Afterword</h2>

<p>As I said in the foreword, a dashboard with all those metrics helps me handle the outages, here are some examples:</p>

<ul>
  <li>If there is a huge <strong>CPU</strong> utilization, and it is not done by my JVM then it’s <strong>noisy neighbor</strong> situation, we need to
deal with the process that eats our resource</li>
  <li>If there is a huge <strong>CPU</strong> utilization, and it is done by my JVM, the application runs slow, and the <strong>code cache</strong> is
almost full then I look at log if the JIT compiler has been disable</li>
  <li>If there is a huge <strong>CPU</strong> utilization, and it is done by my JVM, the application runs slow, and the <strong>full GC</strong> is
happening all the time, I need a <strong>heap dump</strong> and <strong>GC logs</strong> to diagnose what is going on</li>
  <li>If there is a huge <strong>CPU</strong> utilization, and it is done by my JVM, and the <strong>GC</strong> runs very frequently, starting
its work too soon then I need <strong>GC logs</strong> to understand why this is happening</li>
  <li>If there is a huge <strong>CPU</strong> utilization, and it is done by my JVM (and it is not any of previous situations), I need <strong>CPU profiling</strong></li>
  <li>If there are multiple <strong>threads awaiting database connection</strong> then I need <strong>wall profiling</strong> and access to DB
performance tool</li>
  <li>It there was a <strong>0 available RAM</strong> for a while, and now there is no <strong>java process</strong> then I check in OS logs if
there was <strong>OOM killer</strong> activity logged</li>
</ul>

<p>… and so on.</p>

<p>Those charts do not solve the outage but show you where you should focus on your diagnosis. Remember, I just covered
the technology I use. <strong>You may have other metrics worth gathering</strong> (MQ, Kafka, custom thread pools and so on).</p>

<p>After fifteen years of handling different kinds of outages I can tell you one thing: 
<strong>I never start the diagnosis from the application log</strong>.</p>]]></content><author><name></name></author><summary type="html"><![CDATA[[Java][JMX][Monitoring] The ultimate monitoring of the JVM application - out of the box]]></summary></entry></feed>