[Java][Profiling][Memory leak] Finding heap memory leaks with Async-profiler
Async-profiler 2.9 was released. The brand-new feature is live mode, which can help you detect
heap memory leaks.
Let’s start with the definition:
Heap memory leak happens when in your application you have Java objects that are no longer needed for program execution, but cannot be freed by garbage collector.
Why is it so hard?
If you have a heap memory leak in your application then you have two groups of objects:

- Live set - this is a group of objects that are still needed by your application
- Memory leak - this is a group of objects that are no longer needed
Garbage collectors cannot free the second group if there is at least one strong reference from live set to memory leak. The biggest problems with diagnosis memory leaks are:
- the fact that the object was created is not an issue - it was created because it was needed for something
- the fact that the mentioned reference was created is not an issue - it had some purpose too
- we need to understand why that reference was not removed by our application
The last one is not trivial. All the observability/profiling tools give us a great possibility to understand why some event has happened, but with memory leaks we need to understand why something hasn’t happened.
Tools
Since there is no tool that would tell us why something is not happening we need to use our brain to find the root cause of the problem. We can use two additional tools that can help us:
- heap dump - that shows us current state of a heap - we can find out what kind of objects are, but shouldn’t be there
- profiler - that shows us where those objects were created
There were already profilers on a market that had a great feature of detecting where not freed objects were created. Unfortunately they used instrumentation and the overhead was so big that they couldn’t be used in production. To make use of them we needed memory leaks recreated on test or local environments.
Async-profiler uses different way of finding allocated objects (quote from it’s README):
async-profiler does not use intrusive techniques like bytecode instrumentation or expensive DTrace probes which have significant performance impact. It also does not affect Escape Analysis or prevent from JIT optimizations like allocation elimination. Only actual heap allocations are measured.
The profiler features TLAB-driven sampling. It relies on HotSpot-specific callbacks to receive two kinds of notifications:
- when an object is allocated in a newly created TLAB (aqua frames in a Flame Graph);
- when an object is allocated on a slow path outside TLAB (brown frames).
This means not each allocation is counted, but only allocations every N kB, where N is the average size of TLAB. This makes heap sampling very cheap and suitable for production. On the other hand, the collected data may be incomplete, though in practice it will often reflect the top allocation sources.
I used that feature on many production systems before. The live option adds a filter to present only objects
that haven’t been removed by GC.
Testing application
Let’s create a simple Spring Boot application with memory leak, that is hard to find by just a heap dump:
@RestController
@RequiredArgsConstructor
@RequestMapping("/hard")
class HardOne {
    private final LeakOne leakOne;

    @GetMapping
    void doIt() {
        String newOne = RandomStringUtils.randomAlphabetic(10000);
        leakOne.doLeak(newOne);
        LeakTwo.doLeak(newOne);
    }
}
@Component
class LeakOne {
    private final Set<String> leak = new HashSet<>();

    void doLeak(String s) {
        leak.add(s);
    }
}
class LeakTwo {
    private static final Set<String> leak = new HashSet<>();

    static void doLeak(String s) {
        leak.add(s);
    }
}
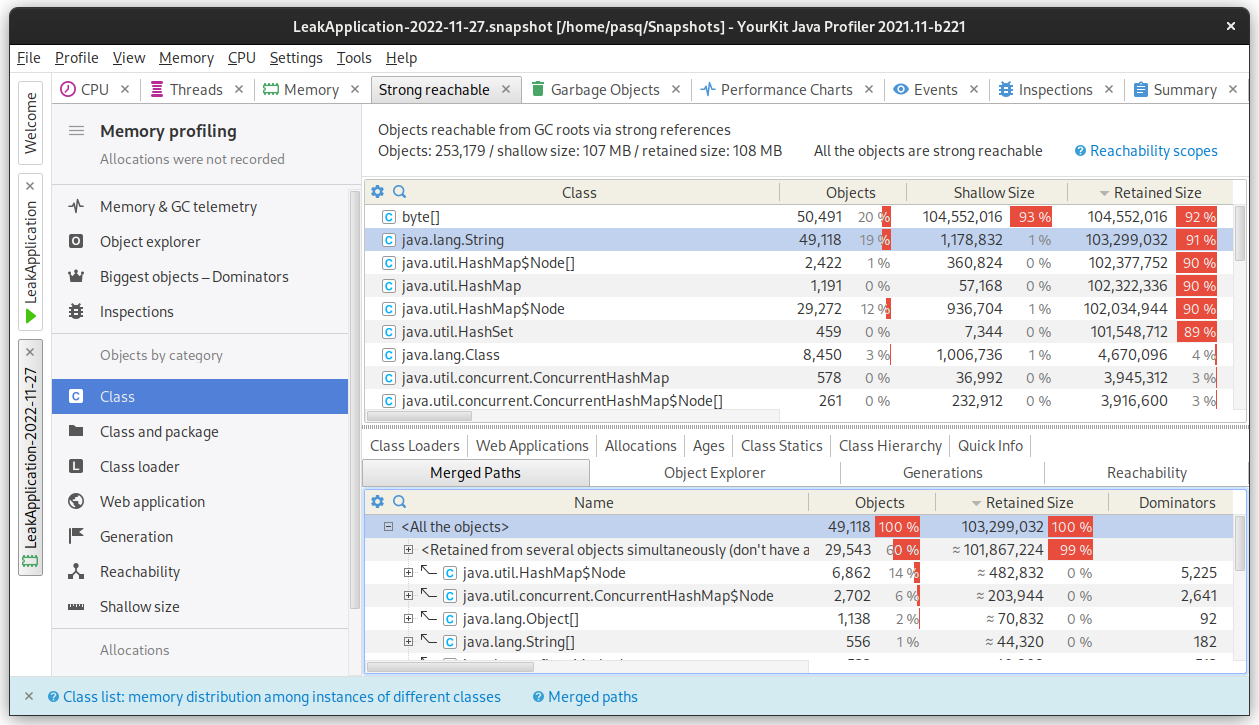
If we look at a heap dump after execution http://localhost:8080/hard 10k times we would see:

Usually I analyze heap dumps with potential memory leak in two easy steps:
- I locate objects that shouldn’t be there
- I calculate path to GC roots to understand why they are still alive
In that dump we can see the leaking Strings, but we cannot detect where they are held, since there is no
dominator. There are simply two HashSets that hold a strong reference to those leaked objects, so there is
no one guilty class. In such situations the allocation profiler is much more useful.
Let’s test it
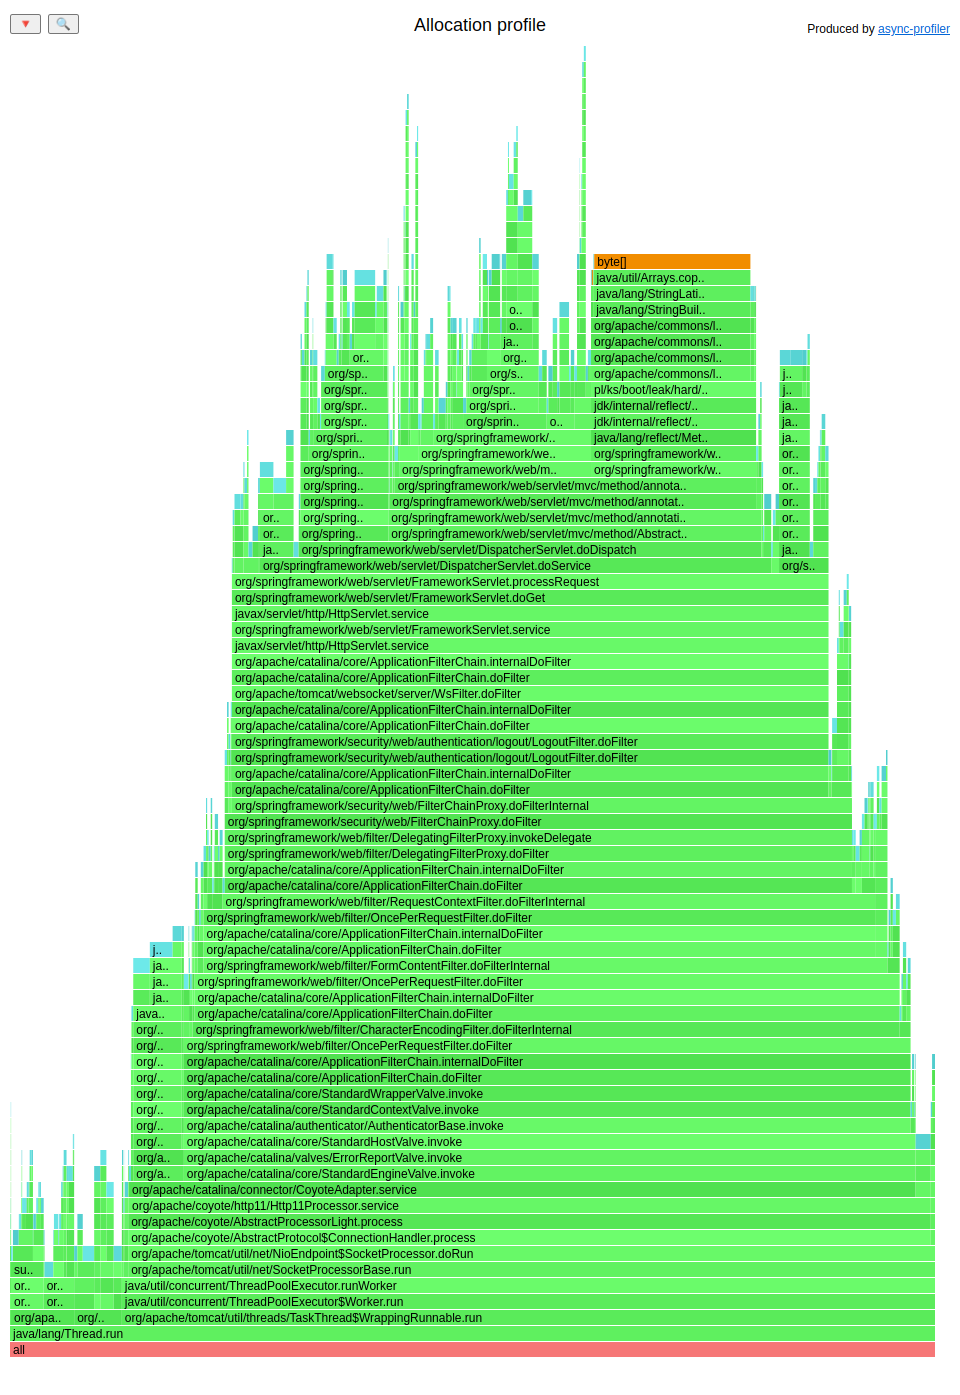
First let’s try simple allocation mode to see if the live option really does any change.
./profiler.sh -e alloc --total start LeakApplication
ab -n 10000 http://localhost:8080/hard
./profiler.sh -f live.html stop LeakApplication
The result:

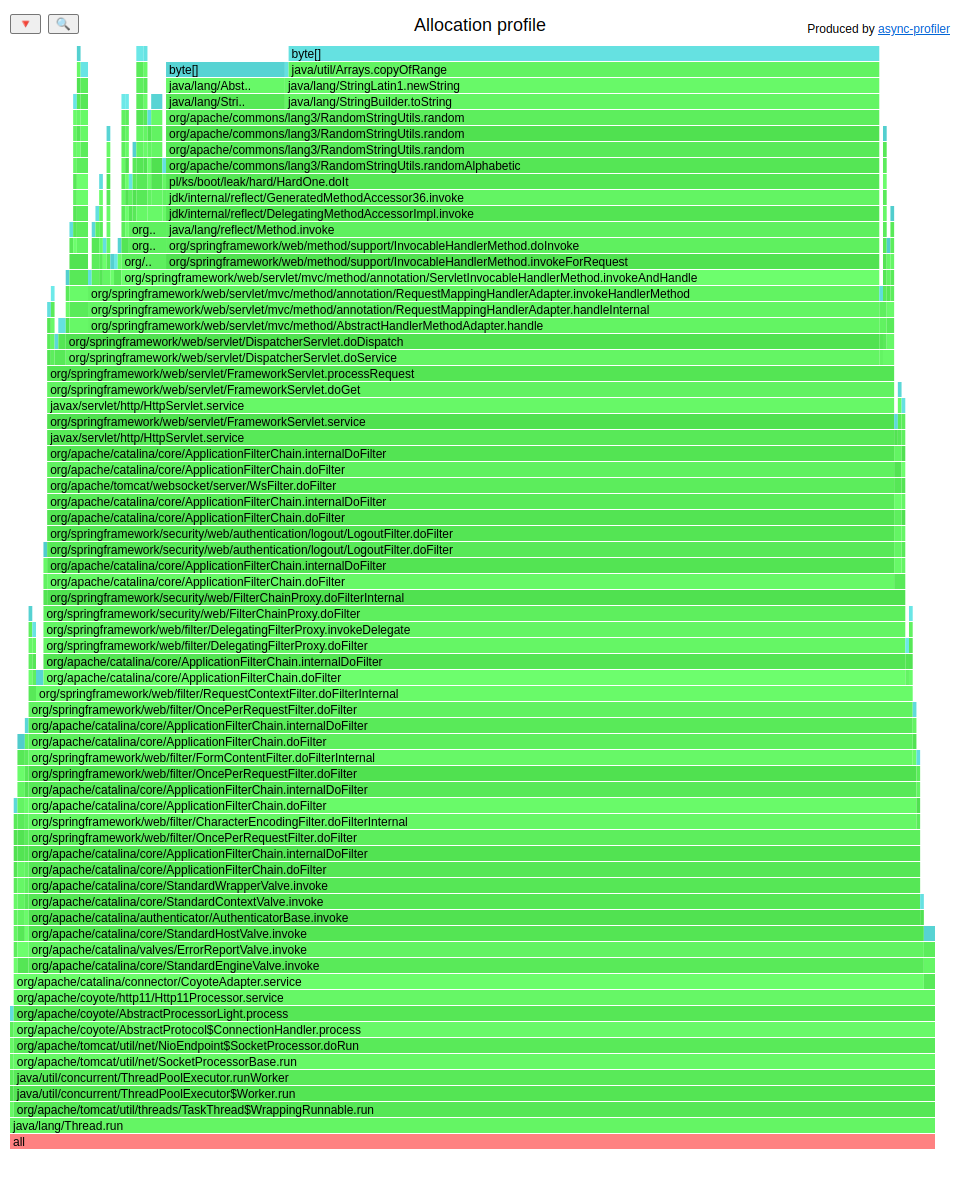
Now let’s add the live option:
./profiler.sh -e alloc --live --total start LeakApplication
ab -n 10000 http://localhost:8080/hard
./profiler.sh -f live.html stop LeakApplication

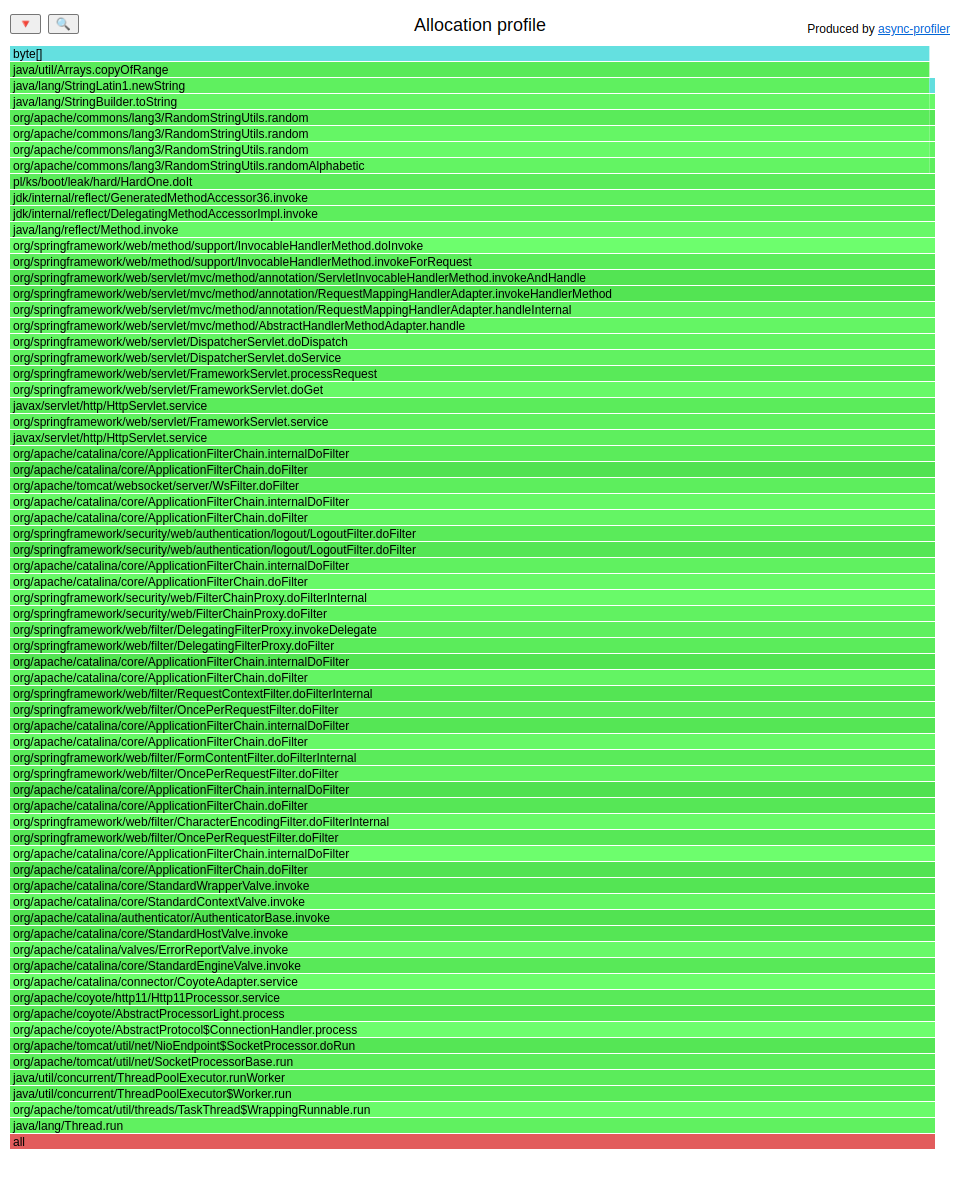
We can see that the profile looks different, but we can also see allocations other than our memory leak. This is done because GC hasn’t freed them yet. Let’s run a GC before capturing the results this time:
./profiler.sh -e alloc --live --total start LeakApplication
ab -n 10000 http://localhost:8080/hard
jcmd LeakApplication GC.run
./profiler.sh -f live.html stop LeakApplication

Perfect. Ladies and gentlemen, we have the first profiler that can help us detect heap memory leaks in our production environment (at your own risk, of course). Thank you, Andrei Pangin.