[Java][JVM Logs] Monday with JVM logs - Classloader logs, can attaching the JFR (and other profilers) cause the outage?
JVM logs
If you enable class log at info level (-Xlog:class+unload,class+load) you can find such an entries:
[class,load           ] org.springframework.jdbc.core.simple.SimpleJdbcCallOperations source: jar:file:/opt/app.jar!/BOOT-INF/lib/spring-jdbc-5.2.12.RELEASE.jar!/
[class,load           ] java.net.Authenticator source: jrt:/java.base
[class,load           ] jdk.internal.reflect.GeneratedSerializationConstructorAccessor301 source: __JVM_DefineClass__
[class,load           ] sun.nio.ch.FileChannelImpl source: __VM_RedefineClasses__
[class,unload         ] unloading class jdk.internal.reflect.GeneratedConstructorAccessor528 0x0000000800b64c40
For loading class we can find the class name, and the source of a loaded definition. The source can be a jar file, or it can be
__JVM_DefineClass__ if the class is created at runtime. You can also find the __VM_RedefineClasses__ source, which is a
class redefinition, usually made by a profiler through JVMTI.
Attaching the JFR
Let’s run a simple HelloWorld:
import java.io.IOException;

class HelloWorld {
    public static void main(String[] args) throws IOException {
        System.out.println("Hello world");
        System.in.read();
    }
}
java -Xlog:safepoint,class+load,jit+compilation=debug HelloWorld
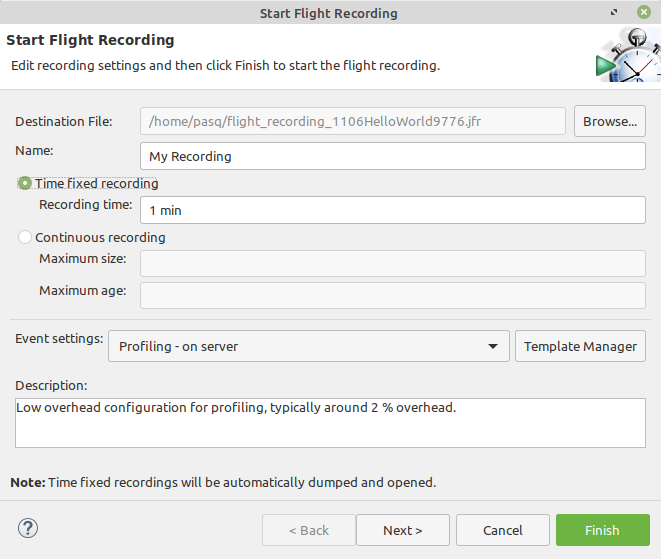
Let’s start the JFR with JMC:

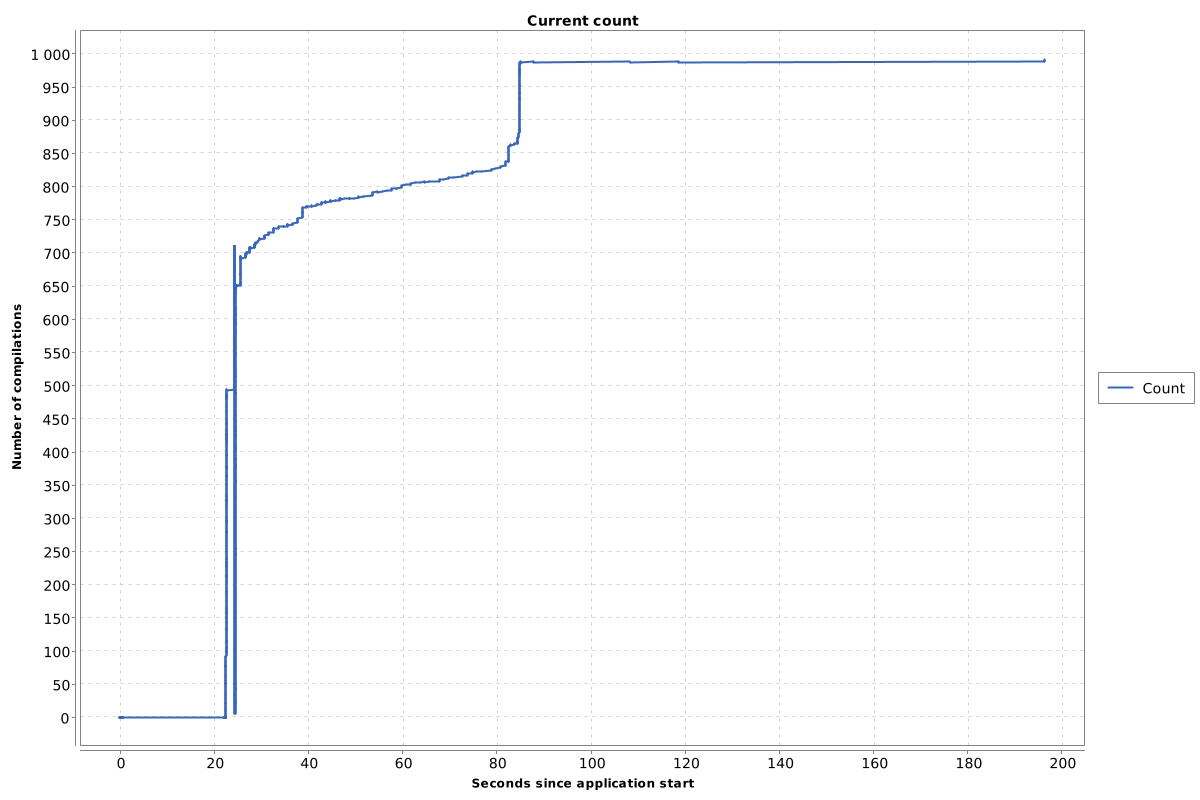
The first thing I want you to see is the JIT compilation count.

You can see that after I run the JFR the compilation count dropped to 0. Let’s look at the logs to find out why could that happen:
[24,434s][info ][class,load     ] java.lang.Throwable source: __VM_RedefineClasses__
[24,435s][info ][class,load     ] java.lang.Error source: __VM_RedefineClasses__
[24,435s][info ][safepoint      ] Application time: 0,0628897 seconds
[24,435s][info ][safepoint      ] Entering safepoint region: RedefineClasses
[24,437s][debug][jit,compilation]   22       1       java.lang.module.ModuleDescriptor::name (5 bytes)   made not entrant
[24,437s][debug][jit,compilation]   23       1       java.lang.module.ModuleReference::descriptor (5 bytes)   made not entrant
[24,437s][debug][jit,compilation]   14       4       java.lang.StringLatin1::hashCode (42 bytes)   made not entrant
... multiple made not entrant
[24,456s][info ][safepoint      ] Leaving safepoint region
[24,456s][info ][safepoint      ] Total time for which application threads were stopped: 0,0209087 seconds, Stopping threads took: 0,0000114 seconds
From that log we can read that everything started with a class redefinition. The JFR instruments Throwable and Error classes.
That redefinition started the stop the world phase RedefineClasses in which all the compilations were removed.
To understand why the JVM does that we need to look at its sources: jvmtiRedefineClasses.cpp:
void VM_RedefineClasses::redefine_single_class(jclass the_jclass,
       InstanceKlass* scratch_class, TRAPS) {
...
  // Deoptimize all compiled code that depends on this class
  flush_dependent_code(the_class, THREAD);
...
}

void VM_RedefineClasses::flush_dependent_code(InstanceKlass* ik, TRAPS) {
  assert_locked_or_safepoint(Compile_lock);

  // All dependencies have been recorded from startup or this is a second or
  // subsequent use of RedefineClasses
  if (JvmtiExport::all_dependencies_are_recorded()) {
    CodeCache::flush_evol_dependents_on(ik);
  } else {
    CodeCache::mark_all_nmethods_for_deoptimization();
...
  }
}
If it is the first redefinition, and the recording of dependencies was not enabled at startup, then all the methods are marked as made not entrant. Here is a quote from a very nice comment in the JVM sources:
Deoptimize all compiled code that depends on this class.
If the can_redefine_classes capability is obtained in the onload phase then the compiler has recorded all dependencies from startup. In that case we need only deoptimize and throw away all compiled code that depends on the class.
If can_redefine_classes is obtained sometime after the onload phase then the dependency information may be incomplete. In that case the first call to RedefineClasses causes all compiled code to be thrown away. As can_redefine_classes has been obtained then all future compilations will record dependencies so second and subsequent calls to RedefineClasses need only throw away code that depends on the class.
It’s not only the JFR
This problem occurs in every profiler that:
- is attached at runtime
- instruments a single class
Why can this cause the outage?
It is a simple snowball effect, here is an example of one scenario I have seen (REST service):
- The JFR is run to profile the application
- All the JIT compilations are removed
- The JIT compiler needs to recompile every method/loop -> it needs the CPU to do it
- There are no JIT compilations. so the whole application is running in the interpreter -> it is slower and consumes more CPU
- The application is slower, but it doesn’t mean that the incoming traffic is any lower
- The application needs to create more threads to handle the traffic -> it needs the CPU and the memory
- More requests are processed at the same time -> it needs more memory on the heap and causes the bigger allocation rate
- The increase of allocation rate needs more often garbage collections -> it needs the CPU
All that sudden CPU and memory consumption may cause the outage. The application may be killed by Kubernetes, may be removed from a cluster by load balancer and so on.