[Java][Profiling] Continuous profiling with async-profiler
If you speak Polish …
there is a webinar at Warsaw Java User Group about that topic here.
Async-profiler
You can download async-profiler from GitHub. I’m using the latest 1.8.x version, but I have a plan to migrate to 2.0.
The continuous profiling concept
A “classic” profiling concept is to run a profiler on the application when you need to understand why the application perform not the way you want.
A continuous profiling concept is to run a profiler all the time, dumping the profiler output to some storage. When the application performs not the way you want, you simply take the profiler output from the storage.
How to run in?
You can run async-profiler from your Java code, or externally from your shell.
Shell
Here is the simplest way to run async-profiler in continuous mode (dump output every 60 seconds in wall mode):
while true
do
	CURRENT_DATE=`date +%F_%T`
	./profiler.sh -e wall -f out-$CURRENT_DATE.jfr -d 60 MainClass
done
I use such a script when someone asks me to help him with his application. I just run it on screen.
If you want you can do it by cron, you simply need to run such a script:
./profiler.sh stop MainClass > /dev/null
CURRENT_DATE=`date +%F_%T`
./profiler.sh start -e wall -o jfr -f out-$CURRENT_DATE.jfr MainClass
And add an entry to your crontab.
Java
Here is a part of Java code that runs async-profiler in continuous mode:
AsyncProfiler asyncProfiler = AsyncProfiler.getInstance();

DateTimeFormatter formatter = DateTimeFormatter.ofPattern("yyyy-MM-dd_HH:mm:ss");

while (true) {
    String date = formatter.format(LocalDateTime.now());
    asyncProfiler.execute(
        String.format("start,jfr,event=wall,file=out-%s.jfr", date)
    );
    Thread.sleep(60 * 1000);
    asyncProfiler.execute(
        String.format("stop,jfr,event=wall,file=out-%s.jfr", date)
    );
}
You need to add dependency:
<dependency>
    <groupId>tools.profiler</groupId>
    <artifactId>async-profiler</artifactId>
    <version>X.Y.Z</version>
</dependency>
And you need to put libasyncProfiler.so file to any of java.library.path.
SpringBoot
If you have a Spring/SpringBoot application you can just use a starter written by me and Michał Rowicki:
<dependency>
    <groupId>com.github.krzysztofslusarski</groupId>
    <artifactId>continuous-async-profiler-spring-starter</artifactId>
    <version>1.5</version>
</dependency>
Read readme first.
How much does it cost?
In case of overhead I didn’t see any overhead in wall mode.
In case of storage, the outputs from one day in JFR format weight up to 3GB in my applications.
Why do I use wall mode and JFR format?
I work at an insurance company. The most precious resource we have is the time of our employees. We want to focus on optimizing that resource, so the wall mode is most suitable for us.
The JFR format contains more information than other output that async-profiler offers. It contains:
- Thread id
- Stacktrace
- Thread state (if that thread is in the CPU or not)
- Timestamp
From the JFR format you can generate collapsed stack output. If you filter the data, so the output contains only stacktraces that are in the CPU, then you have a similar output to the CPU mode. It is not as good as the original CPU mode, it doesn’t contain kernel frames, but it is usually “good enough” for me.
If you filter the data by period of time and thread then you can see what a single thread has been doing in that time. Such a possibility combined with access logs from your server are extremely powerful tools.
If you use async-profiler in the 1.X.X version you can use my tool to convert wall @ JFR format to both wall and CPU collapsed stack outputs. My tool is on GitHub. It doesn’t work with async-profiler 2.0.
When is that useful?
First the continuous profiling solves the same problems as “classic” profiling, but it is easier, because you don’t need to run profiler on demand, it is running all the time.
Outages
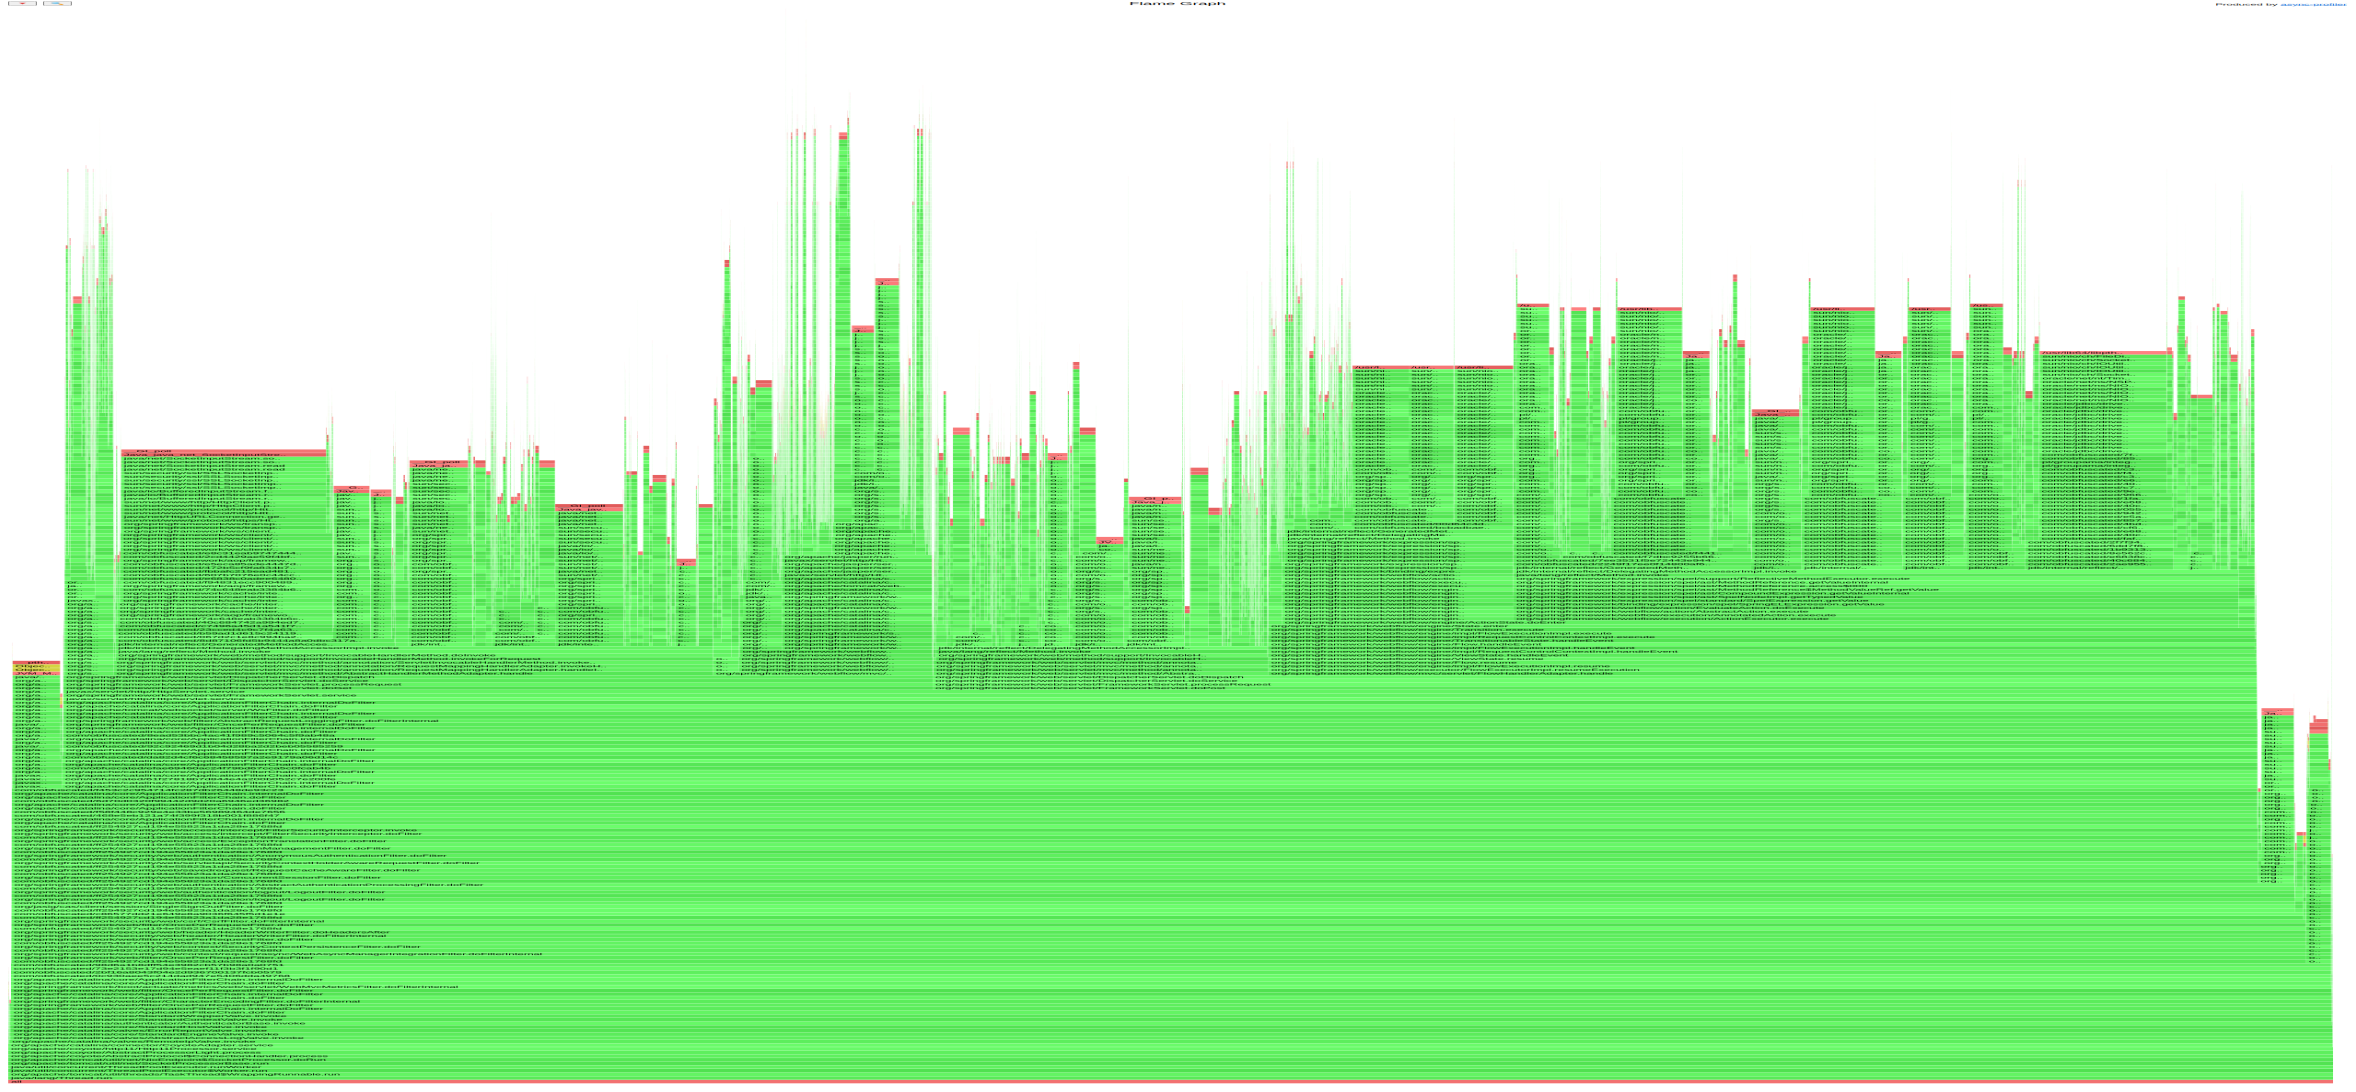
This is a use case of such a profiling when it completely shines. If you had an outage with profiler in continuous mode you can gather the profiler output from the outage moment and see what was happening. Here is the flame graph of 10 minutes work of an application:

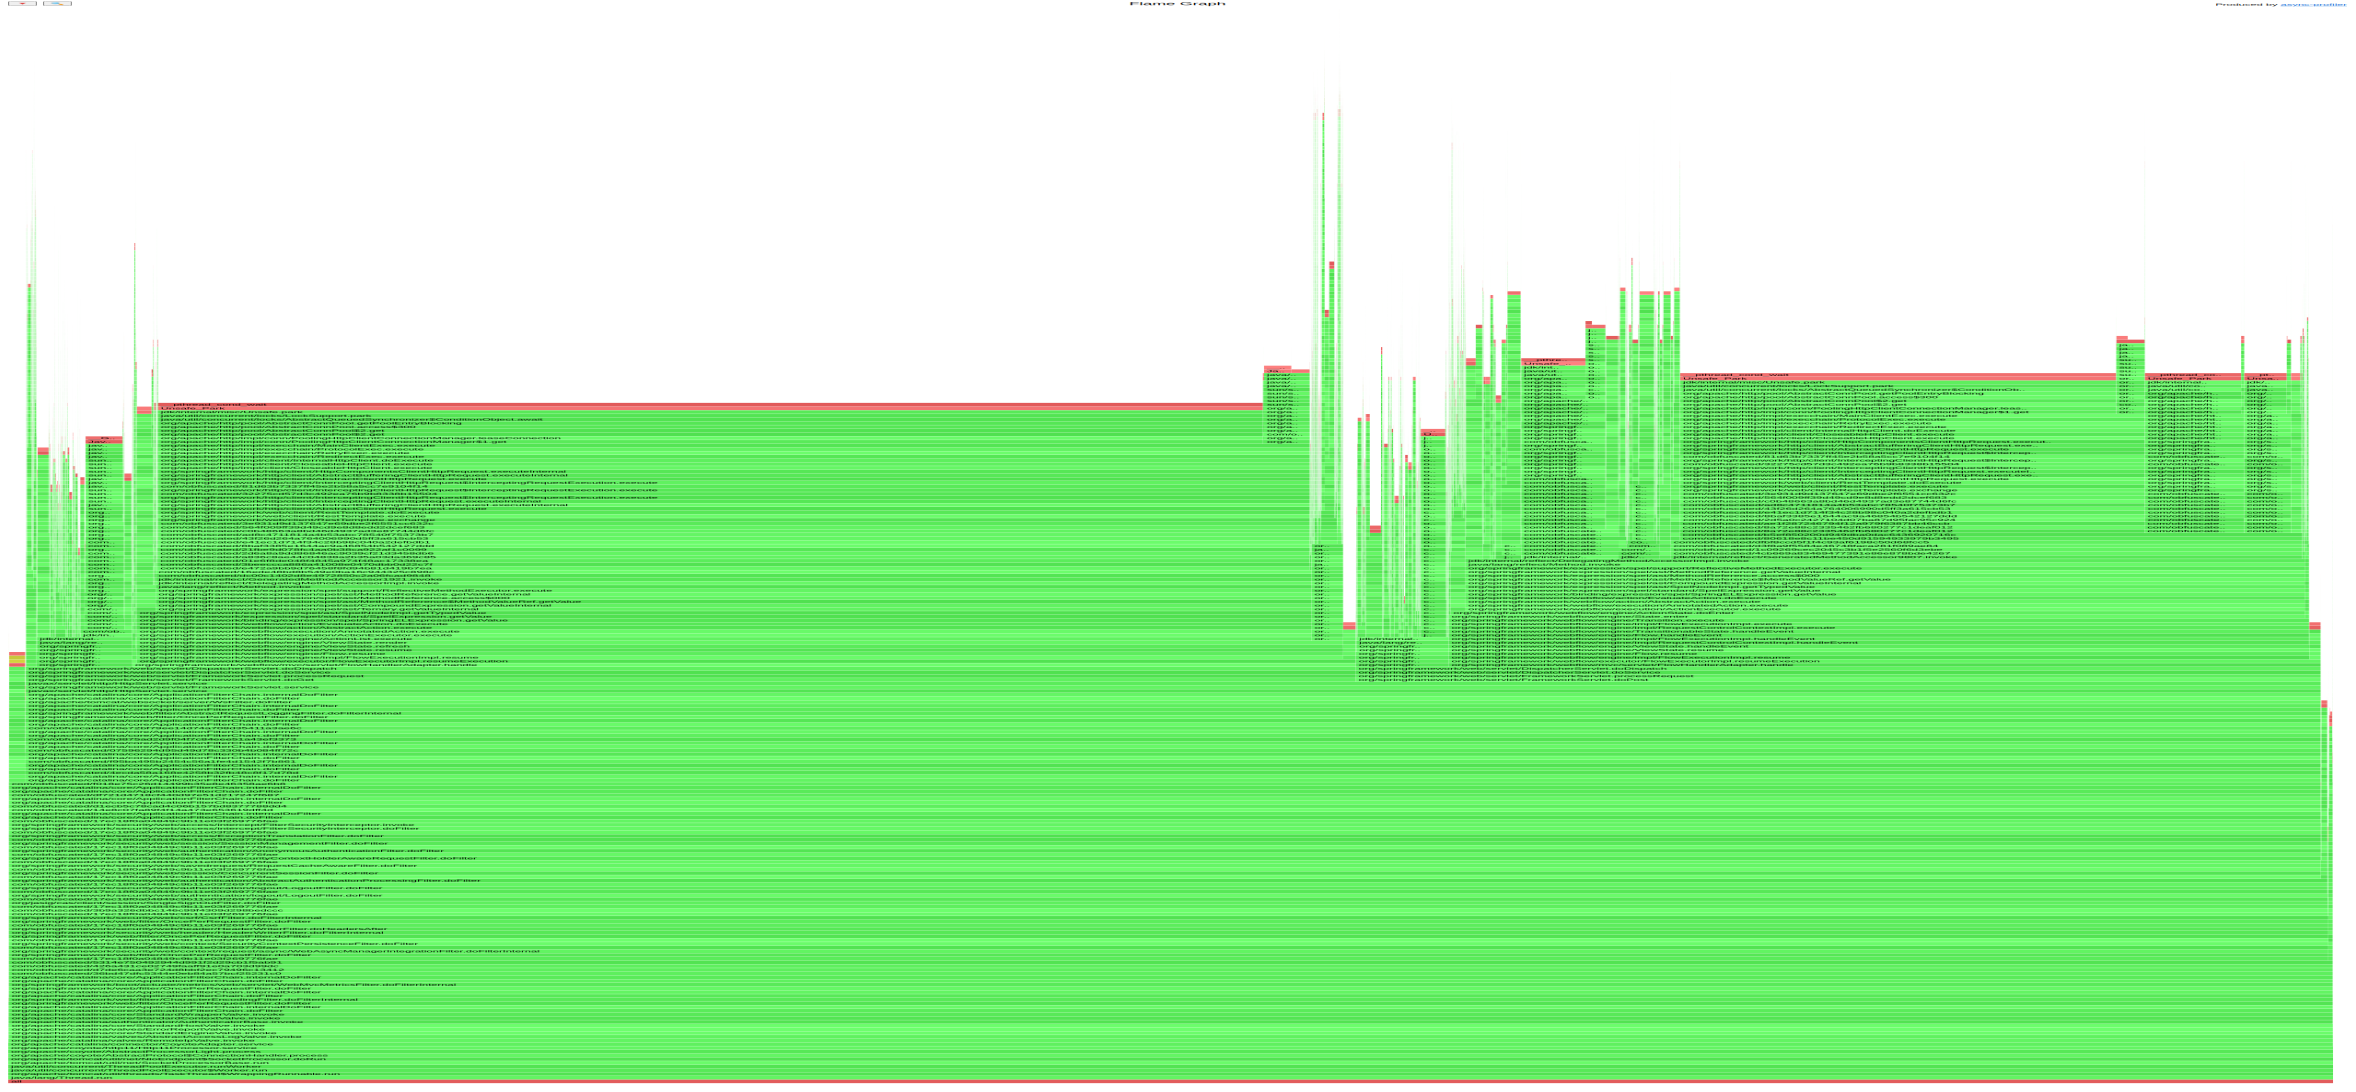
And that is the flame graph of the same application during outage:

Usually during an outage there occurs a new very wide bar at the flame graph (if the outage is caused by java process). You just need to zoom in on that part, and you know an answer why there is an outage.
Performance degradation
This pattern is also useful when you have a performance degradation, for example: after a new deployment. You just need to take older profiler outputs from your archive and compare it to the current one and look for differences.