[Java][JVM Logs][GC Logs][G1GC] Monday with JVM logs - efficiency of the old generation cleanup - is my CPU wasted by the G1GC?
Basics of the G1GC
Here is a part of the documentation form Oracle site:
The Initiating Heap Occupancy Percent (IHOP) is the threshold at which an Initial Mark collection is triggered and it is defined as a percentage of the old generation size.
G1 by default automatically determines an optimal IHOP by observing how long marking takes and how much memory is typically allocated in the old generation during marking cycles. This feature is called Adaptive IHOP. If this feature is active, then the option -XX:InitiatingHeapOccupancyPercent determines the initial value as a percentage of the size of the current old generation as long as there aren’t enough observations to make a good prediction of the Initiating Heap Occupancy threshold. Turn off this behavior of G1 using the option-XX:-G1UseAdaptiveIHOP. In this case, the value of -XX:InitiatingHeapOccupancyPercent always determines this threshold.
Internally, Adaptive IHOP tries to set the Initiating Heap Occupancy so that the first mixed garbage collection of the space-reclamation phase starts when the old generation occupancy is at a current maximum old generation size minus the value of -XX:G1HeapReservePercent as the extra buffer.
After the IHOP is reached the G1GC starts the concurrent mark phase. When it finishes its work, the G1GC runs
a set of mixed collections that clears the old generation. It can run from 0 to -XX:G1MixedGCCountTarget=8
mixed collections (8 is the default value).
At the end of the concurrent mark phase the G1GC runs the remark STW phase, which also can clean the old generation. That phase reclaims completely empty regions.
How many mixed collections should be run after a single concurrent mark phase?
This is a hard question. It completely depends on what your old generation contains. There is a value that is potentially bad for every application. It is 0. If in the concurrent cycle there were 0 mixed collections, and the remark phase didn’t clean any empty region, then G1GC didn’t collect anything from the old generation. The concurrent mark is done in separate threads, but it consumes the CPU.
GC logs - mixed collections
At the beginning of each GC cycle you can find the name of the collection at info level:
[gc,start             ] GC(2197) Pause Young (Concurrent Start) (G1 Evacuation Pause)
[gc                   ] GC(2198) Concurrent Cycle
[gc,start             ] GC(2198) Pause Remark
[gc,start             ] GC(2198) Pause Cleanup
[gc,start             ] GC(2199) Pause Young (Prepare Mixed) (G1 Evacuation Pause)
[gc,start             ] GC(2200) Pause Young (Mixed) (G1 Evacuation Pause)
[gc,start             ] GC(2201) Pause Young (Mixed) (G1 Evacuation Pause)
[gc,start             ] GC(2202) Pause Young (Mixed) (G1 Evacuation Pause)
[gc,start             ] GC(2203) Pause Young (Normal) (G1 Evacuation Pause)
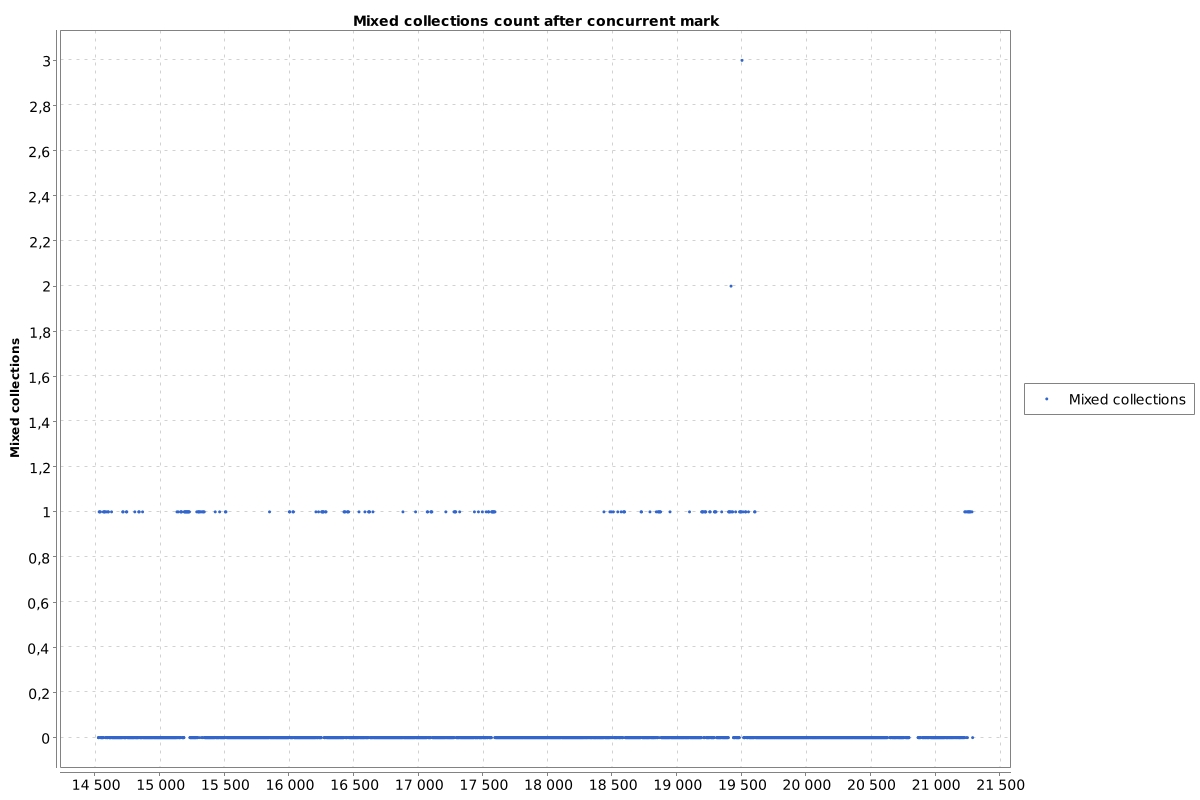
The log above tells that there have been 3 mixed collections after the concurrent mark phase. Here is an example of 0 mixed collections:
[gc,start             ] GC(55650) Pause Young (Concurrent Start) (G1 Humongous Allocation)
[gc                   ] GC(55651) Concurrent Cycle
[gc,start             ] GC(55651) Pause Remark
[gc,start             ] GC(55651) Pause Cleanup
[gc,start             ] GC(55652) Pause Young (Normal) (G1 Evacuation Pause)
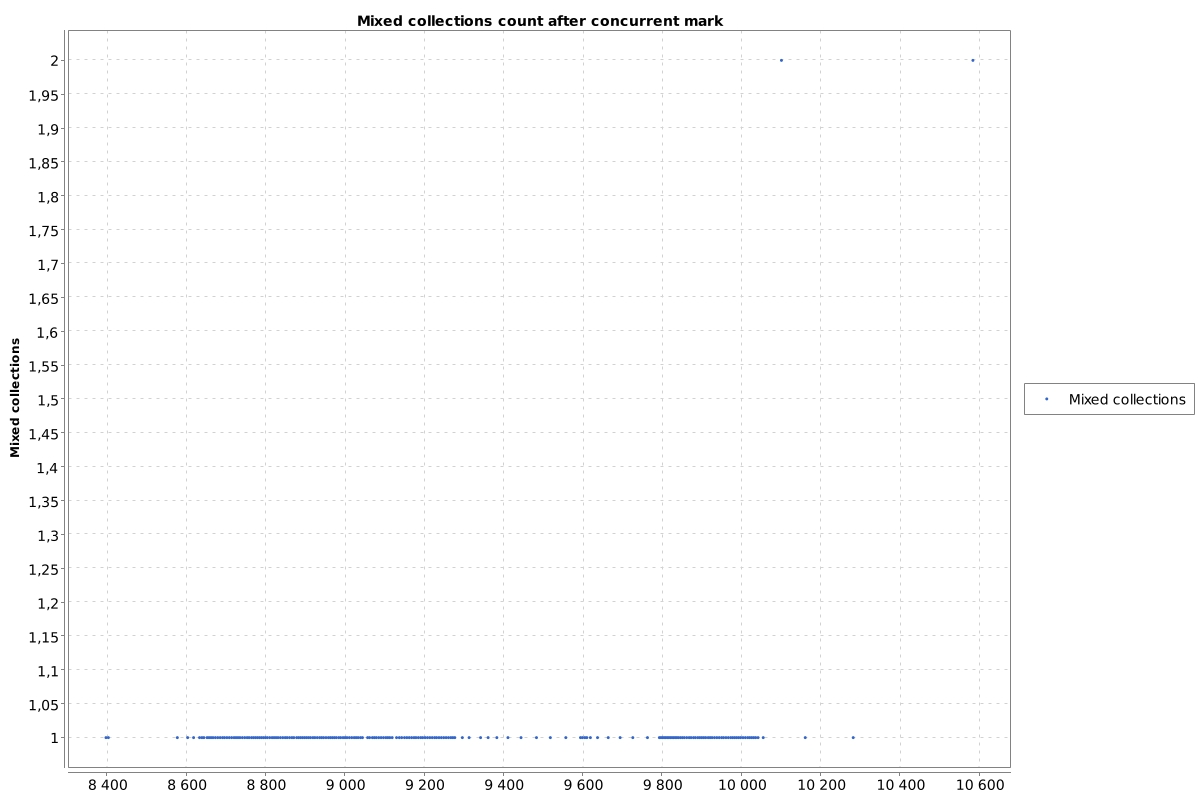
As usual, we can put such a value on a chart (all charts are from 1 day period):
GC logs - remark phase efficiency
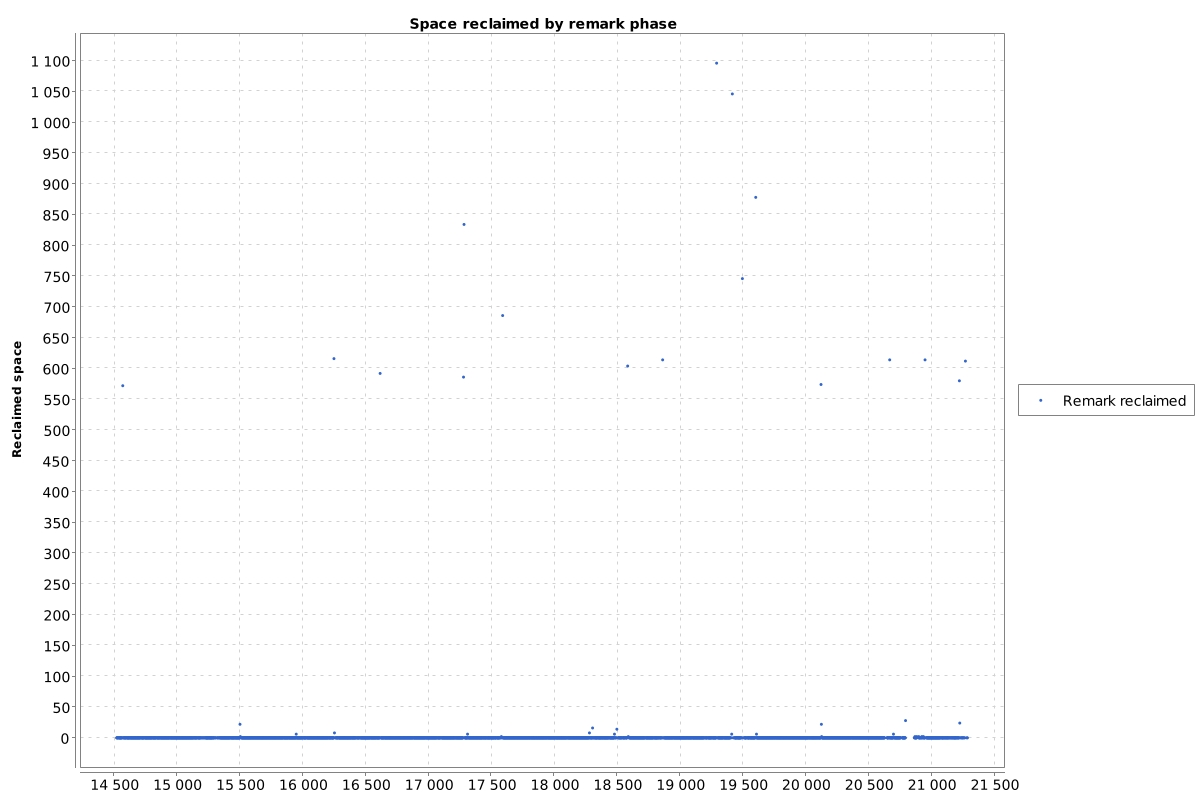
At the end of each GC cycle (including the remark one) you can find such an entry in GC logs at info level:
GC(1204) Pause Remark 1400M->1376M(8192M) 23.501ms
You can find three sizes in such an entry A->B(C) that are:
- A - used size of a heap before GC cycle
- B - used size of a heap after GC cycle
- C - current size of a whole heap
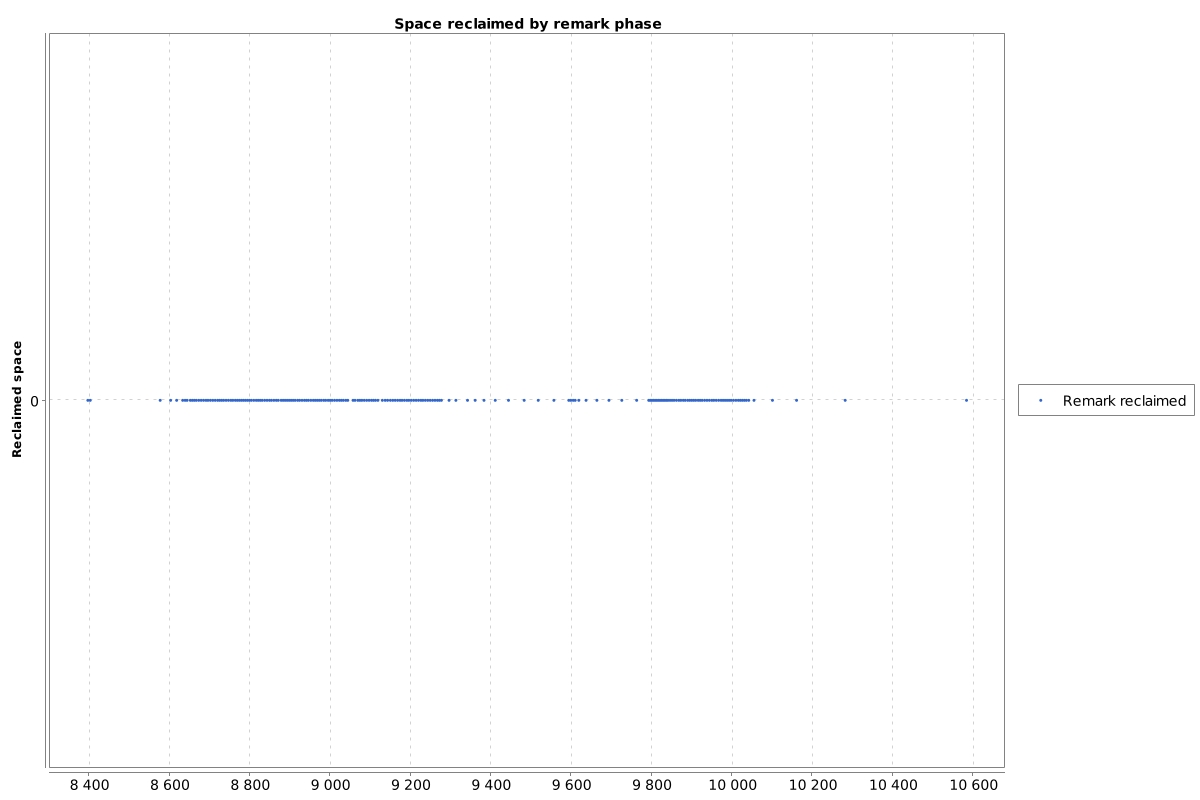
Value A - B is the reclaimed space by this cycle.
GC logs - combined
Now we need to combine two information
- the count of mixed collections
- the space reclaimed by remark phase
If both values were equal to 0 then the CPU was wasted for a concurrent cycle that didn’t reclaim anything. We can present that at charts:
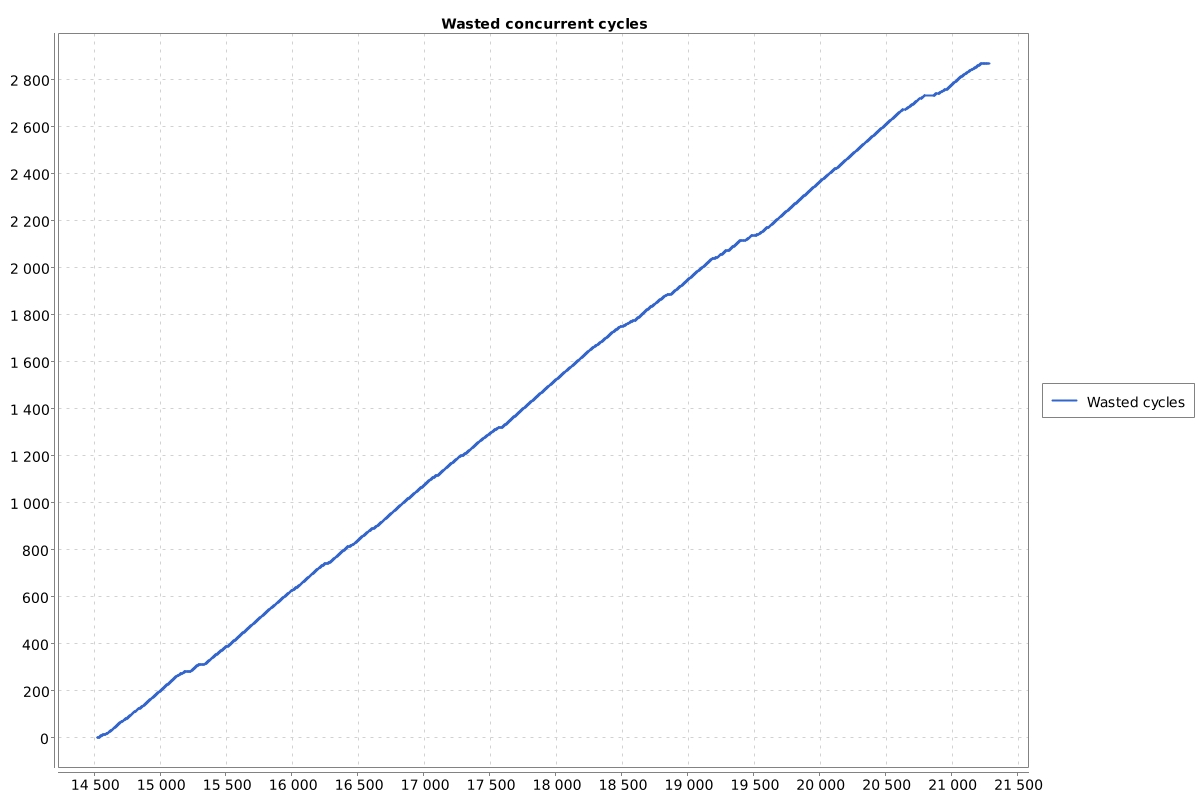
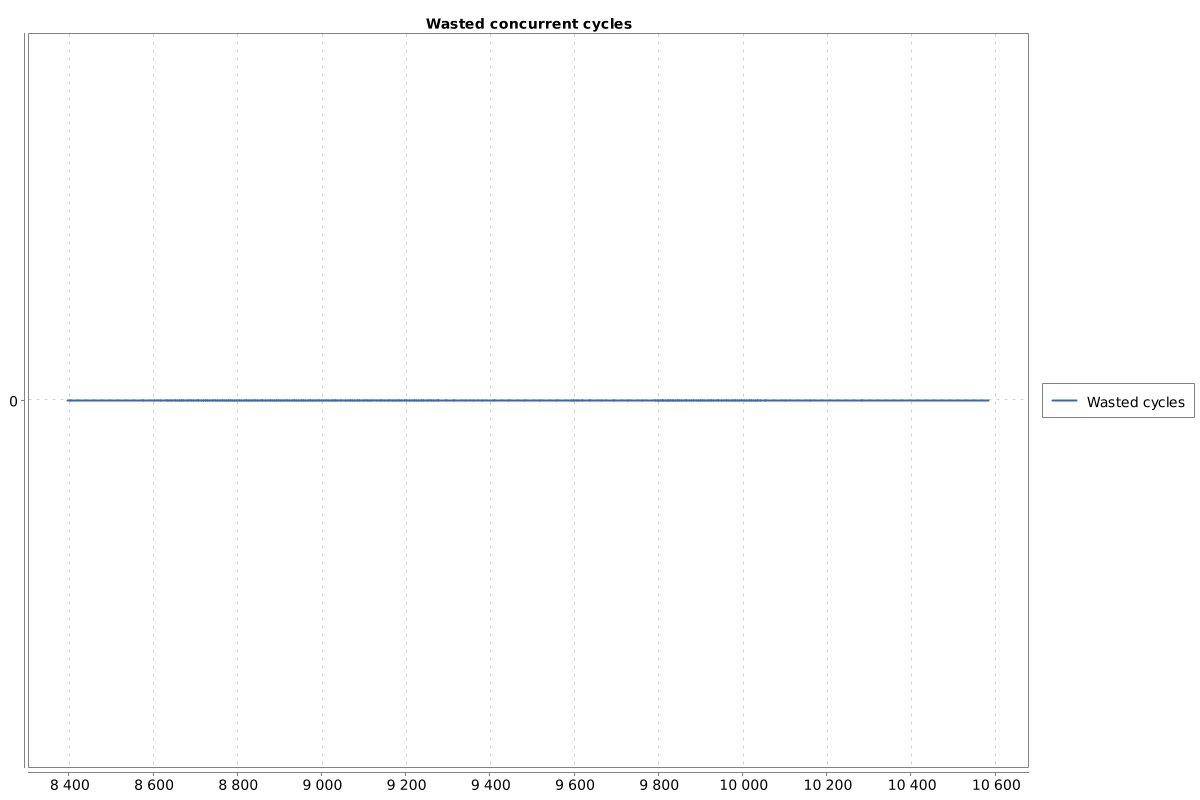
Or we can present that at table:


Let’s focus on the first table. The concurrent cycle consumed CPU for 7534441ms. 94% of that time was completely wasted. 7534440ms * 94% = 7082374,54ms = 118m. So the CPU was wasted for 118 minutes.
The number of wasted CPU cores depends on the -XX:ConcGCThreads argument. If you want to know the default
value on your machine you can run:
java <your arguments> -XX:+PrintFlagsFinal -version | grep ConcGCThreads
Output:
pasq@pasq-Precision-7540:~$ java -XX:+PrintFlagsFinal -version | grep ConcGCThreads
     uint ConcGCThreads                            = 3                                         {product} {ergonomic}
openjdk version "11.0.6" 2020-01-14
OpenJDK Runtime Environment AdoptOpenJDK (build 11.0.6+10)
OpenJDK 64-Bit Server VM AdoptOpenJDK (build 11.0.6+10, mixed mode)
Causes
Java 8
The adaptive calculation of IHOP was introduced in Java 9, in older versions the starting old generation
occupancy percent was fixed. The default value was -XX:InitiatingHeapOccupancyPercent=45.
Good old friend: humongous allocation
Formally the humongous regions are a part of the old generation. Since Java 8u40 there is a special feature called: eager reclamation of humongous objects. This feature clears humongous regions in the collection of the young generation.
Here is a part of the log of such a situation:
[gc,ergo              ] GC(52633) Initiate concurrent cycle (concurrent cycle initiation requested)
[gc,start             ] GC(52633) Pause Young (Concurrent Start) (G1 Humongous Allocation)
[gc,heap              ] GC(52633) Eden regions: 50->0(405)
[gc,heap              ] GC(52633) Survivor regions: 2->2(149)
[gc,heap              ] GC(52633) Old regions: 824->824
[gc,heap              ] GC(52633) Humongous regions: 419->17
[gc,metaspace         ] GC(52633) Metaspace: 195313K->195313K(1228800K)
[gc                   ] GC(52633) Pause Young (Concurrent Start) (G1 Humongous Allocation) 2588M->1684M(8192M) 10.861ms
For that application the region size was 2MB (-Xms=4G). The line Humongous regions: 419->17 means that at the beginning
of the collection there were 419 humongous regions, at the end only 17 remained. It means that young generation
collection cleared (419-17)*2MB - 804MB of the old generation.