[Java][JVM Logs][GC Logs][G1GC] Monday with JVM logs - G1GC Stop-the-world phases
GC logs
At the beginning of each GC cycle you can find the name of the collection at info level:
Pause Cleanup
Pause Full (G1 Evacuation Pause)
Pause Full (G1 Humongous Allocation)
Pause Full (Heap Dump Initiated GC)
Pause Full (Heap Inspection Initiated GC)
Pause Full (System.gc())
Pause Remark
Pause Young (Concurrent Start) (G1 Evacuation Pause)
Pause Young (Concurrent Start) (G1 Humongous Allocation)
Pause Young (Concurrent Start) (GCLocker Initiated GC)
Pause Young (Concurrent Start) (Metadata GC Threshold)
Pause Young (Mixed) (G1 Evacuation Pause)
Pause Young (Mixed) (G1 Humongous Allocation)
Pause Young (Mixed) (GCLocker Initiated GC)
Pause Young (Normal) (G1 Evacuation Pause)
Pause Young (Normal) (G1 Humongous Allocation)
Pause Young (Normal) (GCLocker Initiated GC)
Pause Young (Prepare Mixed) (G1 Evacuation Pause)
Pause Young (Prepare Mixed) (G1 Humongous Allocation)
Pause Young (Prepare Mixed) (GCLocker Initiated GC)
Such a collection names I have found in logs I have. Let’s try to understand what they mean. First division is the collection name. We have:
Pause Full- that one we don’t want to see, long clear of the whole heapPause Cleanup,Pause Remark- those are phases done at the end of the concurrent cyclePause Remark- this phase performs global processing of references, reclaiming empty regions, class unloading, and some other G1GC internal cleanupPause Cleanup- this phase decides is any mixed collection needed
Pause YoungNormal- classic cleanup of the young generationPrepare Mixed- cleanup of the young generation with preparation for cleaning the old generationMixed- cleanup of the young generation and the old generationConcurrent Start- cleanup of the young generation with preparation for concurrent mark phase
In the last brackets you can see the reason why the G1GC starts the collection:
System.gc()- pause triggered by callingRuntime.gc()method (yesRuntime, it is not a mistake)Heap Dump Initiated GC- pause triggered by request for a heap dumpHeap Inspection Initiated GC- pause triggered by request for a class histogramG1 Evacuation Pause- classic reason for the GC, request for creating new object failed because there was not enough space in the eden.Metadata GC Threshold- it was a time to clean the metaspace, GC is also responsible for cleaning that areaG1 Humongous Allocation- request for creating new humongous object failedGCLocker Initiated GC- G1GC cannot start immediately when any thread is in the JNI critical section, GC has to wait for threads to exit such a section - such a situation is marked asGCLocker Initiated GC
What do we want to see in the log?
What we want to see in such a log is as many G1 Evacuation Pause caused collections as possible. What we
don’t want to see:
- multiple
Pause Fullcollections - multiple collection caused by other reason then
G1 Evacuation Pause
Charts
As usual, you can present your GC performance on a chart. We can generate charts with count of each collection type, time of each collection type, count of the reason, …
Here are count charts of the JVM that had a problem with humongous allocation:
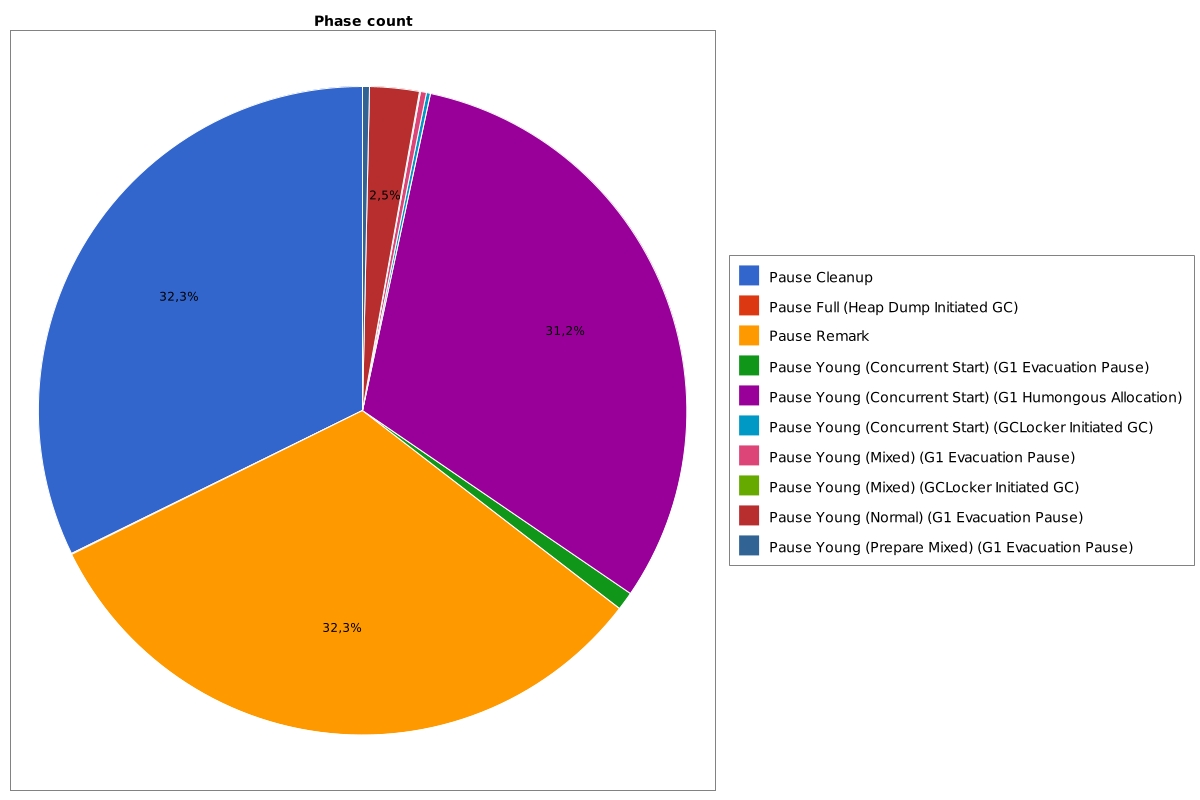
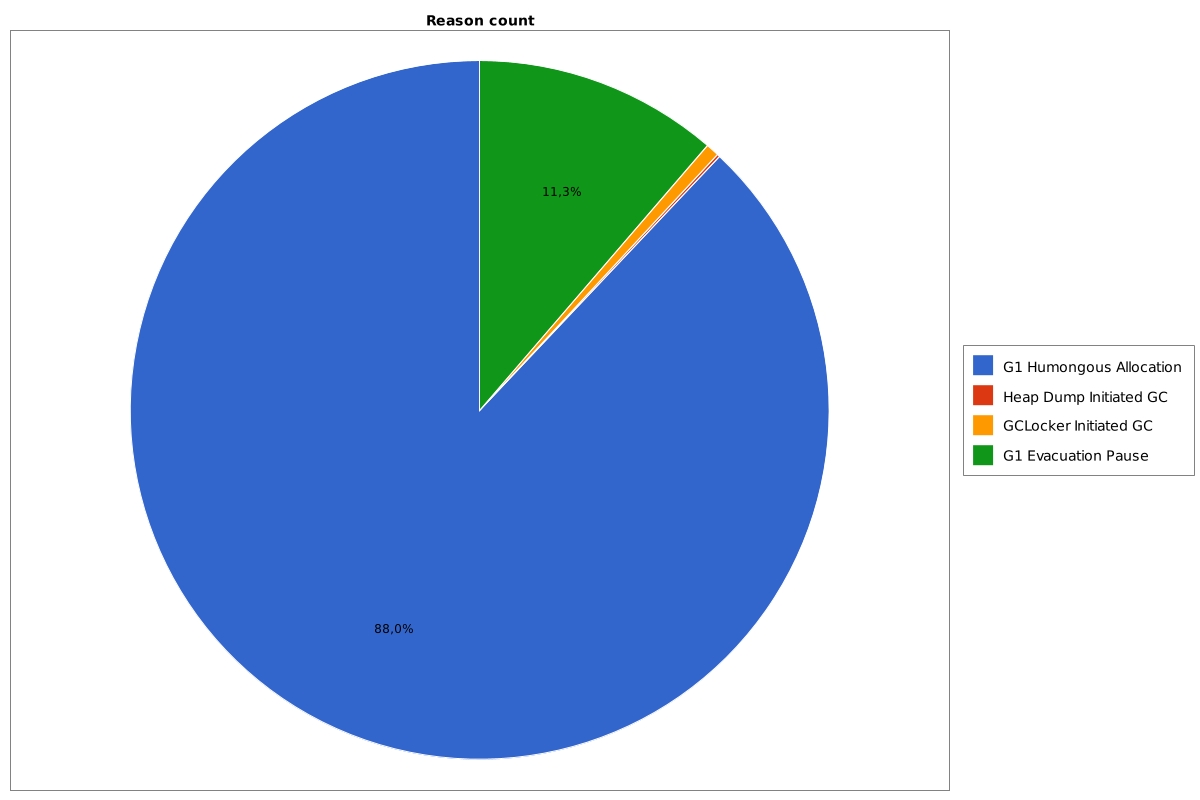
Most of the collections started with G1 Humongous Allocation reasons.
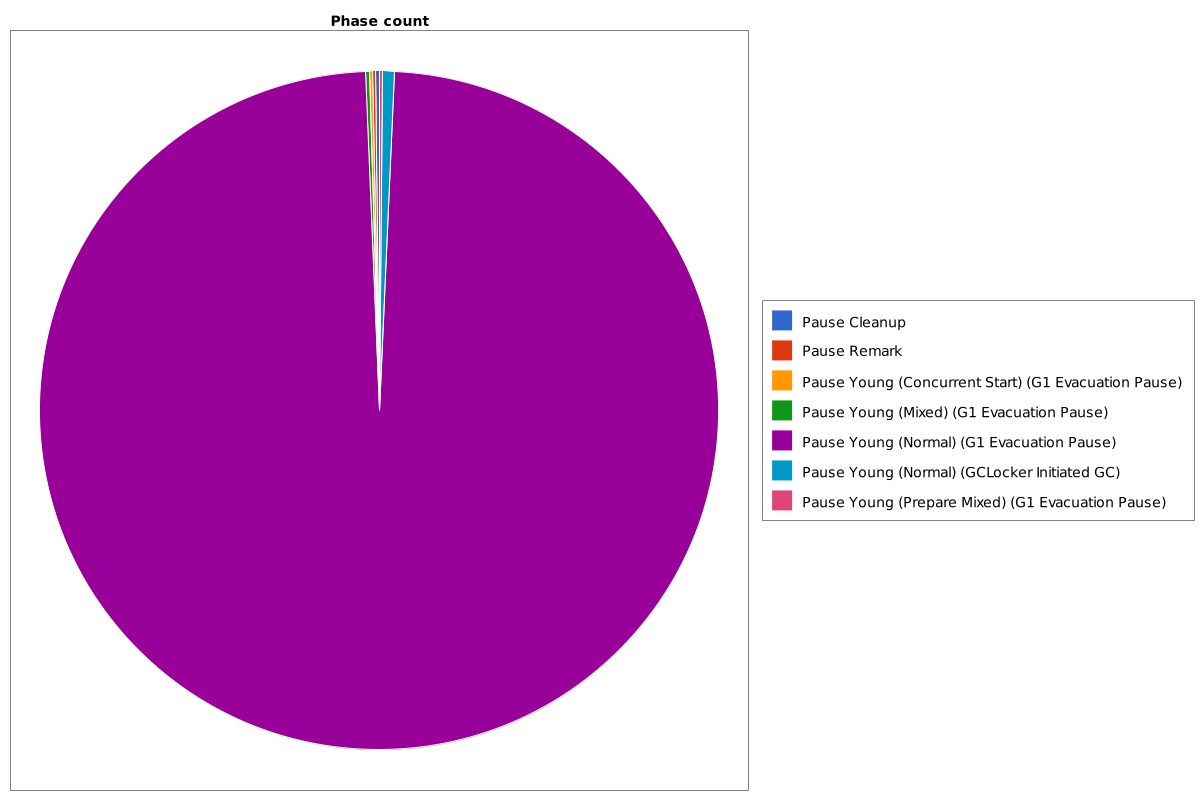
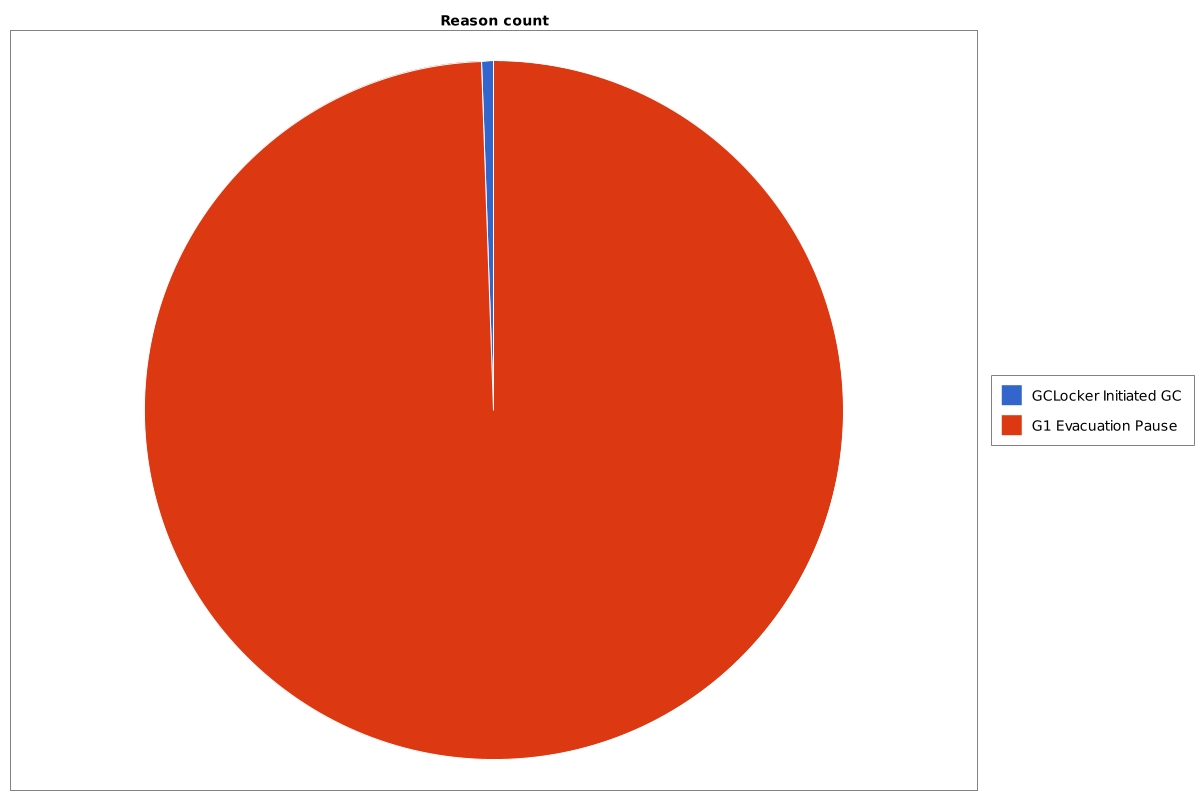
Example of a pretty healthy application:
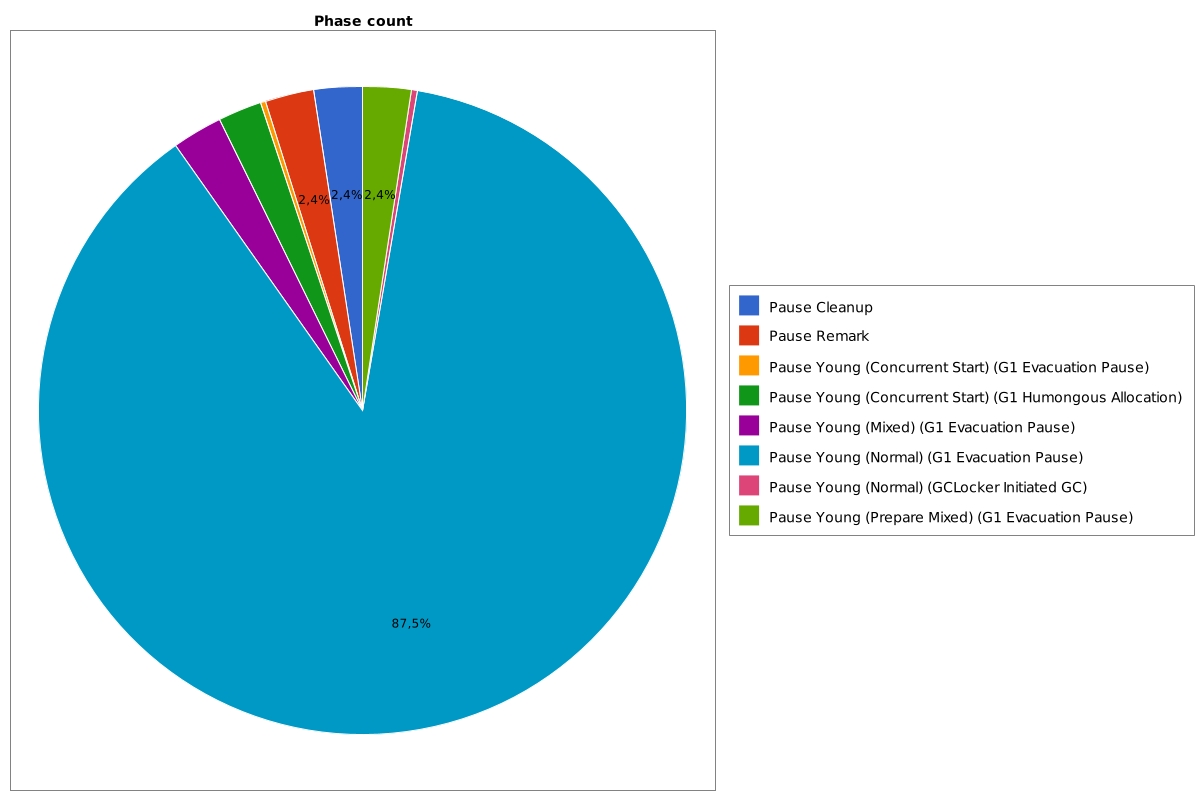
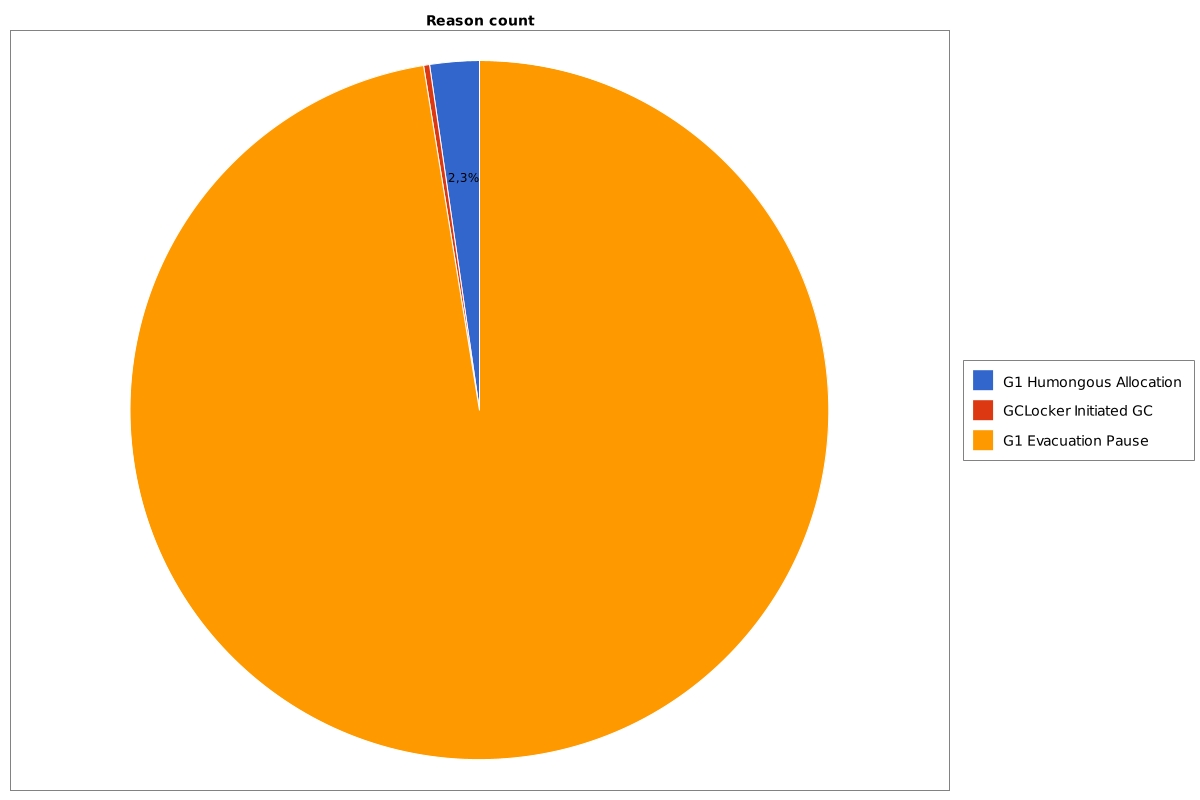
There are some collections started with G1 Humongous Allocation reasons, but there are not a lot of them.
Another example of a healthy application:
