[Java][JVM Logs][GC Logs] Monday with JVM logs - allocation rate
GC logs
At the end of each GC cycle you can find such an entry in GC logs at info level:
[494592.129s] GC(9073) Pause Young (Normal) (G1 Evacuation Pause) 4195M->1188M(5120M) 29.701ms
[494613.918s] GC(9074) Pause Young (Normal) (G1 Evacuation Pause) 4244M->1184M(5120M) 29.930ms
You can find three sizes in such an entry A->B(C) that are:
- A - used size of a heap before GC cycle
- B - used size of a heap after GC cycle
- C - current size of a whole heap
The first value in the example entries is the uptime of the JVM, let’s call it T. Now let’s take two entries:
[T1] ... A1->B1(C1) ...
[T2] ... A2->B2(C2) ...
The value (A2 - B1) / (T2 - T1) is called the allocation rate. This value means how many MB per second our application allocates the memory on the heap. If you want you can also subtract the pause time, but it usually makes no difference.
In the example above the allocation rate is:
(4244 MB - 1188 MB) / (494613.918 s - 494592.129 s) =
3056 MB / 21,789 s =
140,25 MB/s
We can put that value on the chart (those are 1 day charts);
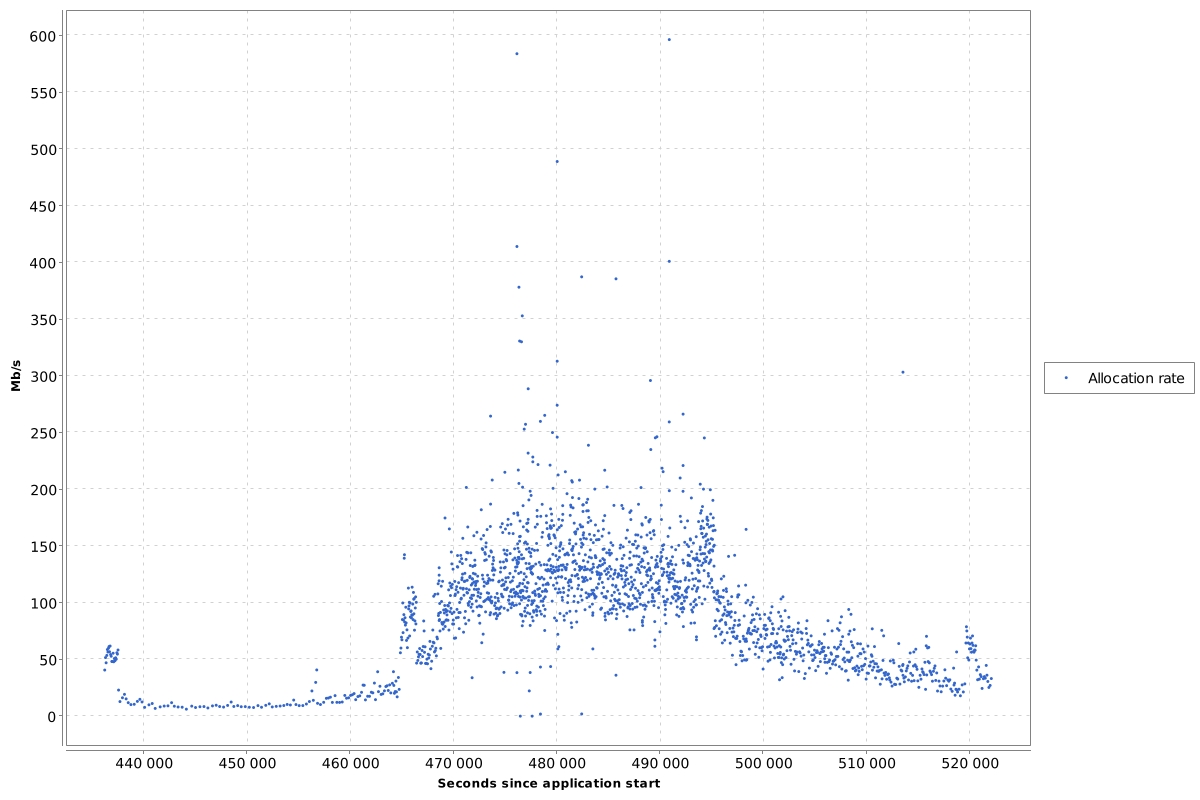
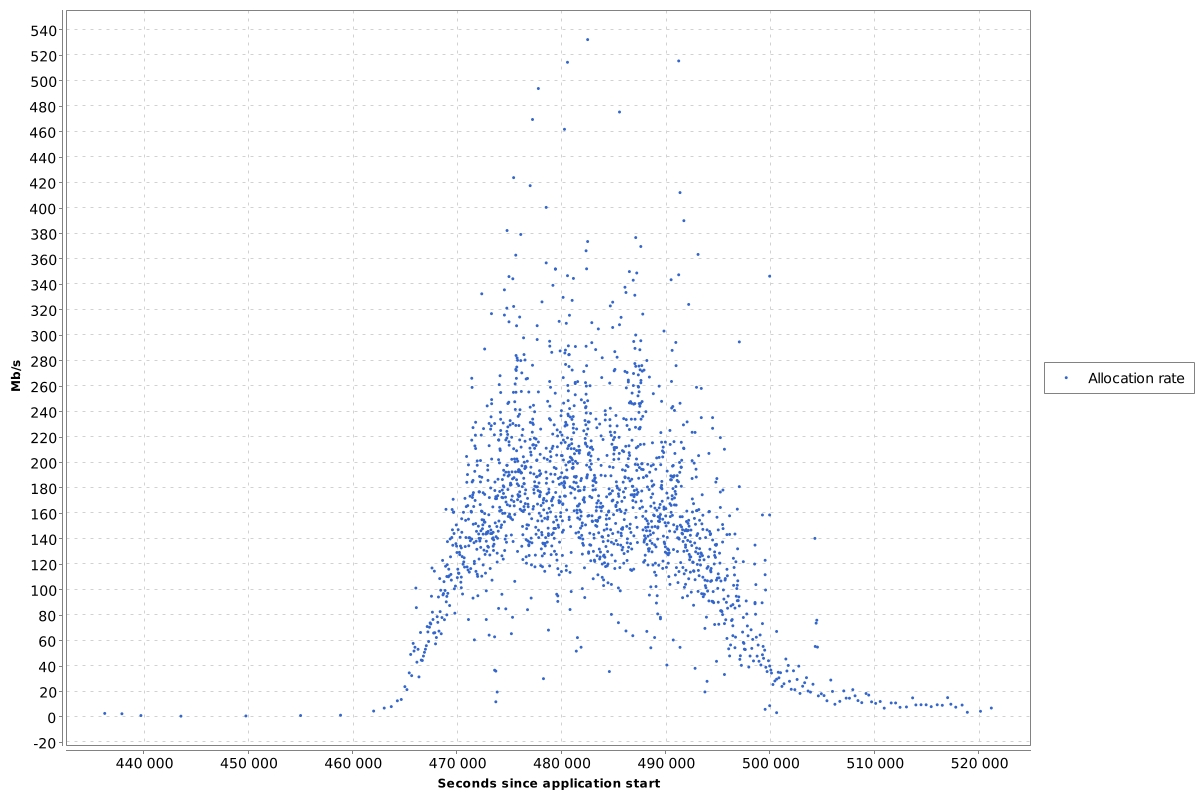
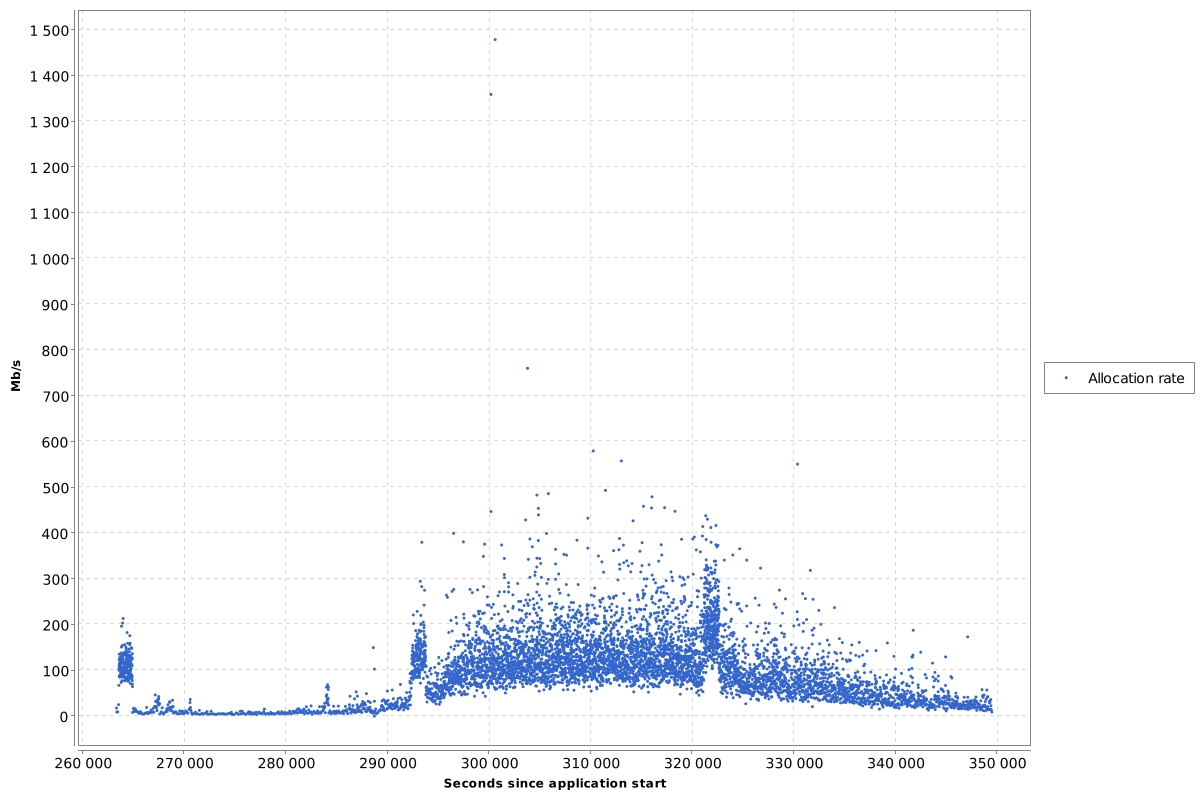
Sometimes such a chart is not clear, because spikes of allocation may occur. We can create the average allocation rate in some time period. Here are the examples:
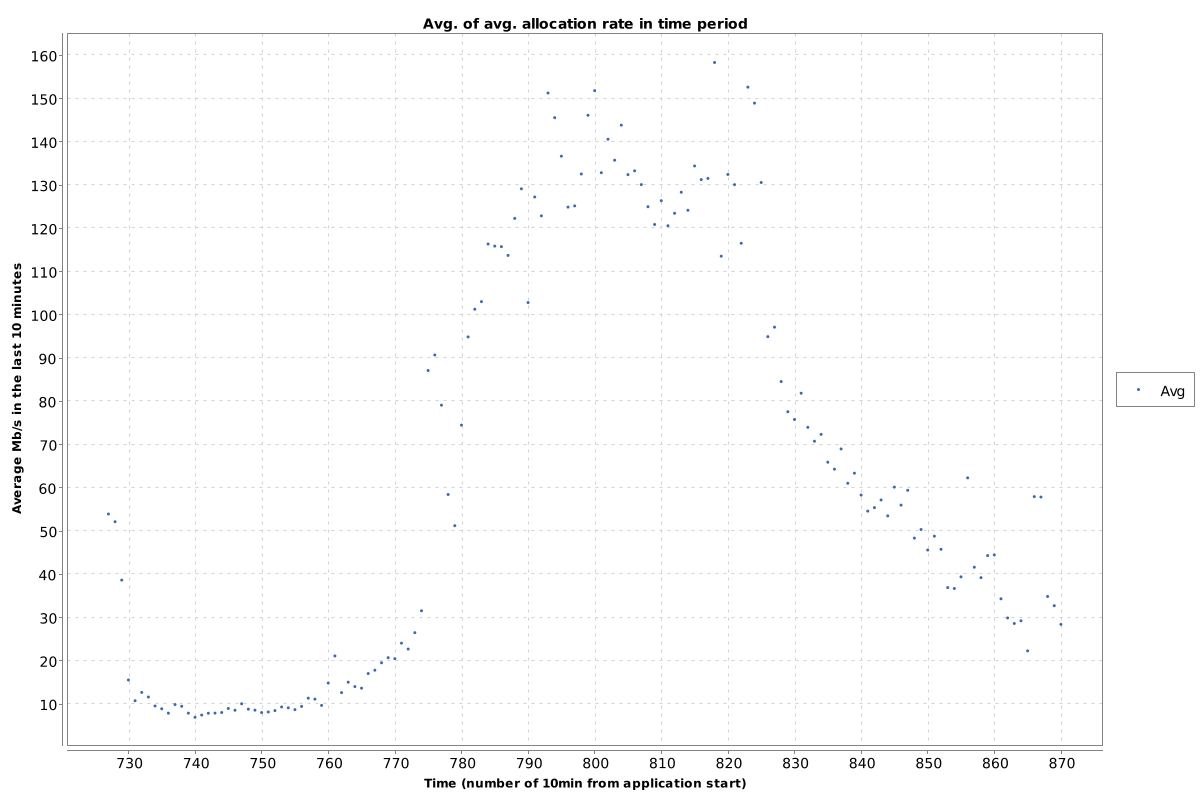
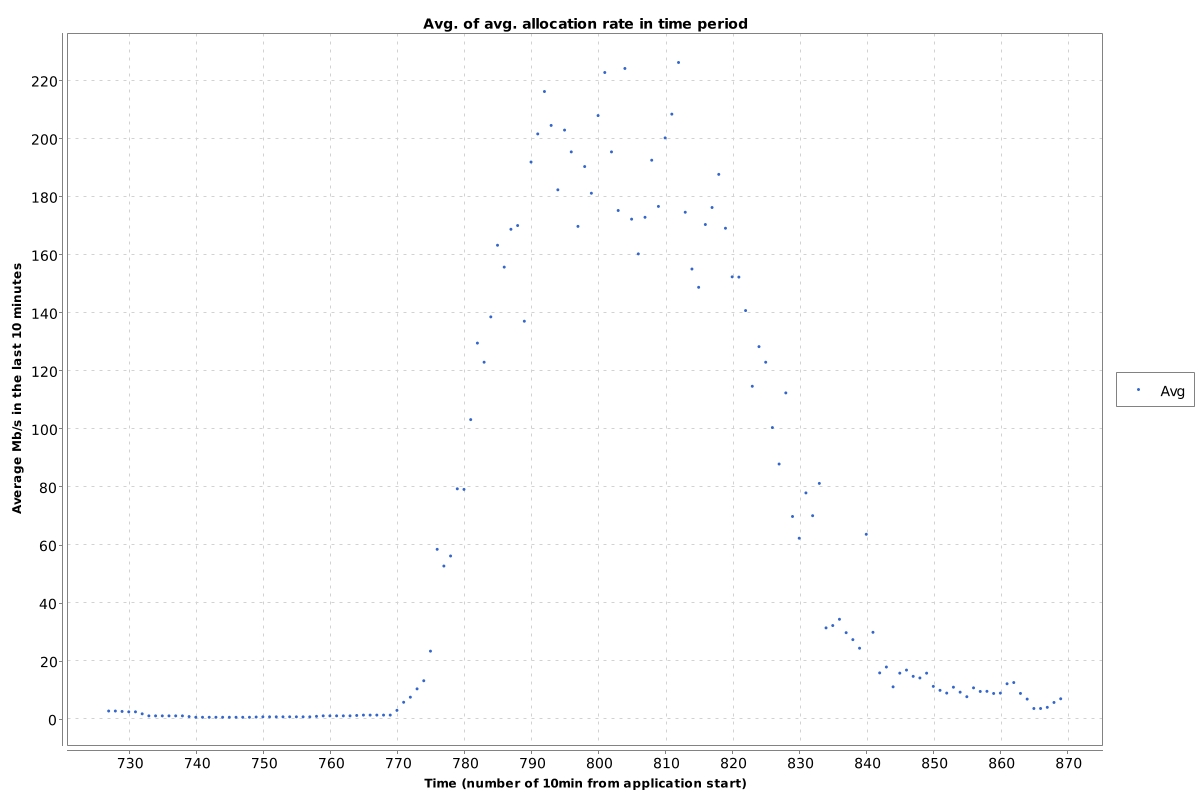
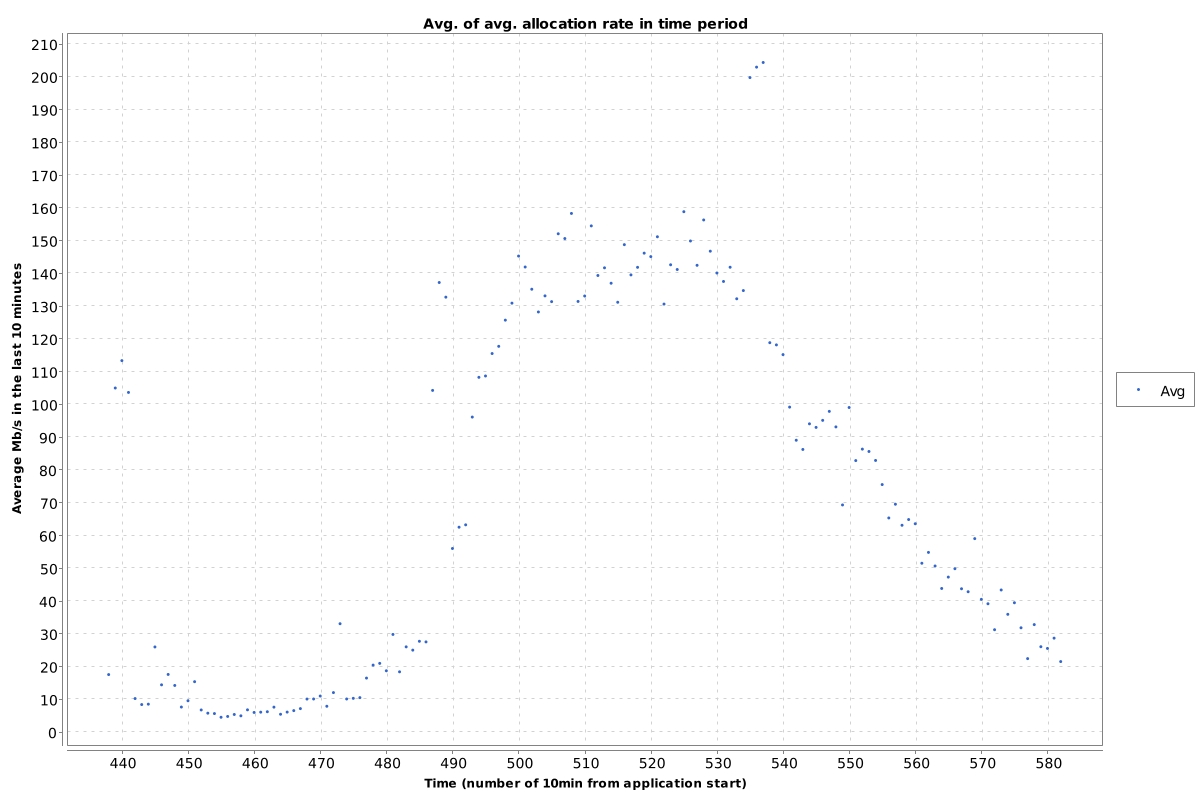
Let’s focus on the last one. That application allocates:
- 10 MB/s in the morning
- 130-160 MB/s in the middle of the day
- 200 MB/s for very short time
Why is that value useful?
Knowing that value, and the size of young generation you can estimate how often your garbage collector will run. Knowing that and how long your GC STW pauses last you can calculate responsiveness/SLA of your application.
How can you decrease the allocation rate?
First thing you need to understand is that garbage collector has nothing to do with the allocation rate. Your application is responsible for the allocation, not the GC. If you want to decrease the allocation rate, you need to tune your application. To do that, first you need to find what part of your code is responsible for the majority of the allocation. In other words you need to find hotspots of the allocation. At the production environment you can use the allocation profiler based on the JFR events:
- Java flight recorder / JDK mission control
- Async-profiler using the alloc event
These profilers can show you which part of the code is responsible for your allocation. The rest is on your hands, you need to change your application by yourself to decrease the allocation rate.