[Java][JVM Logs] Monday with JVM logs - introduction and safepoints logs
The JVM logs are a powerful source of knowledge on how our application works on the virtual machine. Unfortunately they are not very well documented. In this series of articles I will try to show you what you can read from them. I will not cover how the JVM works, but I will add references if I have one.
All charts that you will find in the series are generated by my open-source project.
JVM logs I recommend:
-Xlog:
    codecache+sweep*=trace,
    class+unload,
    class+load,
    os+thread,
    safepoint,
    gc*,
    gc+stringdedup=debug,
    gc+ergo=trace,
    gc+age=trace,
    gc+phases=trace,
    gc+humongous=trace,
    jit+compilation=debug
:file=/path_to_logs/app.log
:level,tags,time,uptime,pid
:filesize=104857600,filecount=5
Reference - safepoints
My previous article about the STW phase
YouTube - With GC Solved, What Else Makes a JVM Pause?
Logging
Safepoints has dedicated logs in a unified logger. You can enable it with Xlog:safepoint. A following example comes
from Java 11:
[safepoint        ] Application time: 0.1950250 seconds
[safepoint        ] Entering safepoint region: RevokeBias
[safepoint        ] Leaving safepoint region
[safepoint        ] Total time for which application threads were stopped: 0.0003424 seconds, Stopping threads took: 0.0000491 seconds
A little bit of explanation what that means:
- First line “Application time: 0.1950250”: this is a time from last STW phase
- Second line “Entering safepoint region: RevokeBias”: this is a name of safepoint operation that needed STW phase
- Last line “Total time for which application threads were stopped: 0.0003424”: this is a sum of time to safepoint and safepoint operation time
- Last line “Stopping threads took: 0.0000491”: this is a time to safepoint
The format is different in Java 8 and Java >= 13, but other formats contain the same information.
The mother of all chats
When I profile an application that is running on the JVM the first chart I’m looking at is the chart that shows me in a 2 seconds window how much time was wasted by the stop-the-world phases. Drawing that chart is a little pain in the ass, but my JVM logs viewer has such a functionality.
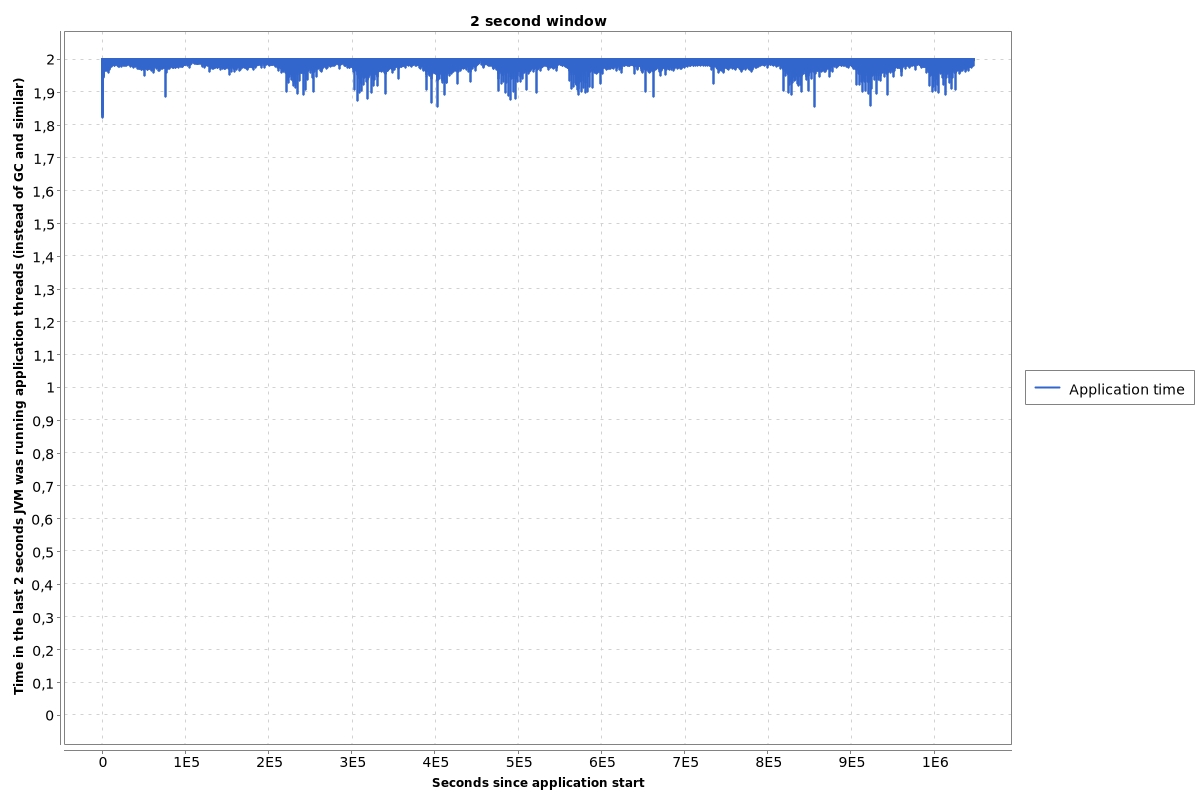
That chart shows 12 days of running a very huge application. This chart shows that in the 2 seconds window the application always runs over 1.8 seconds, usually over 1.9 seconds.
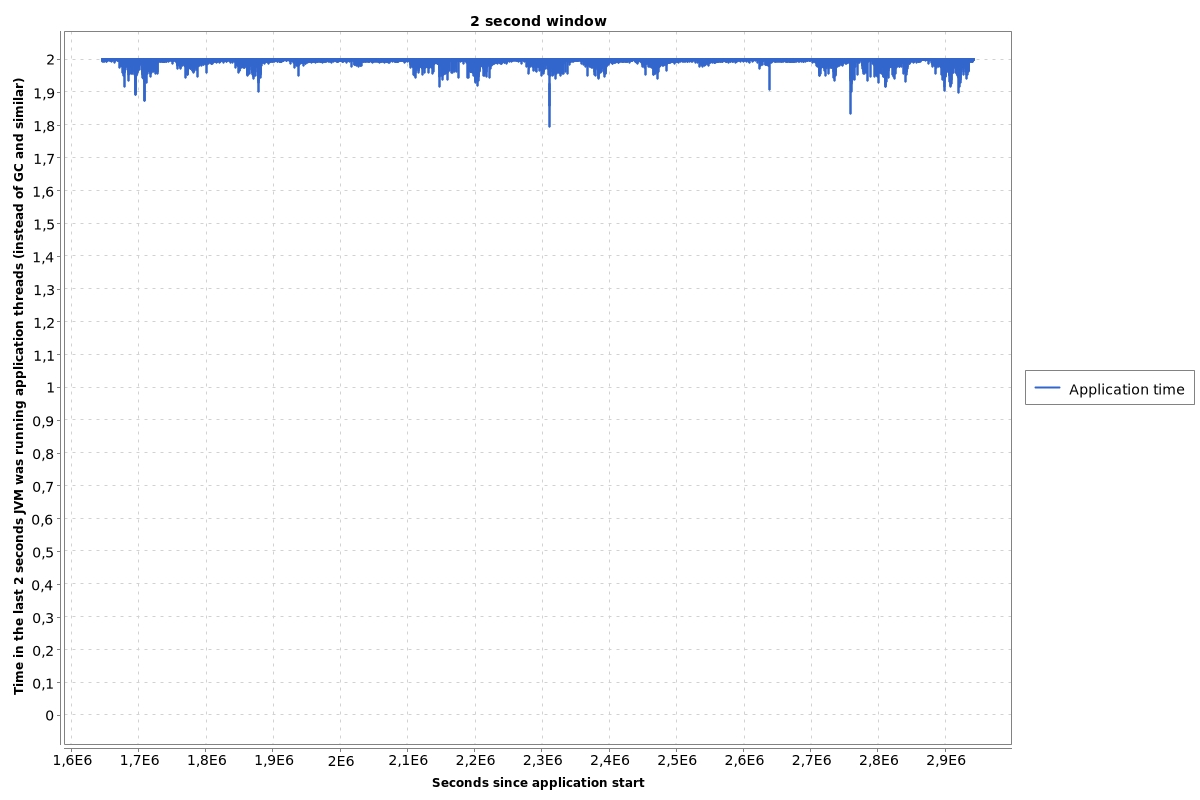
The other example for a small application:
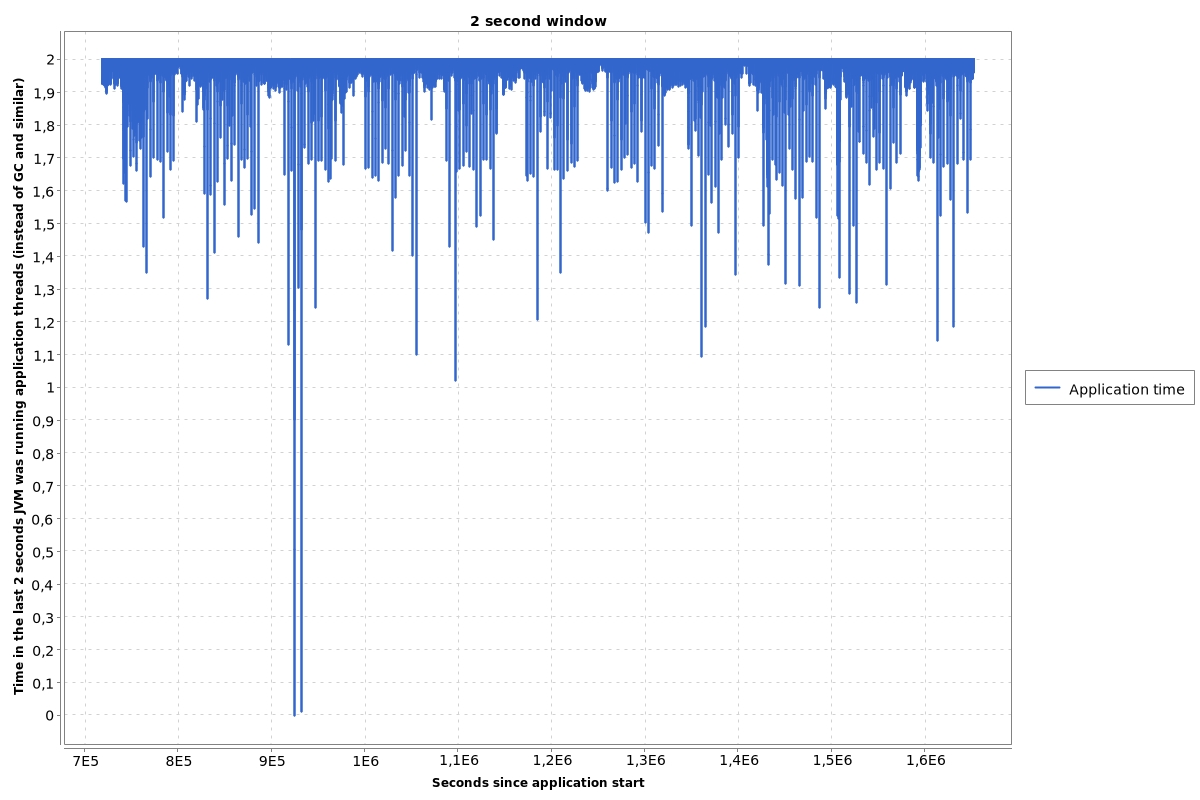
Here is an example of the application which doesn’t work well on the JVM:
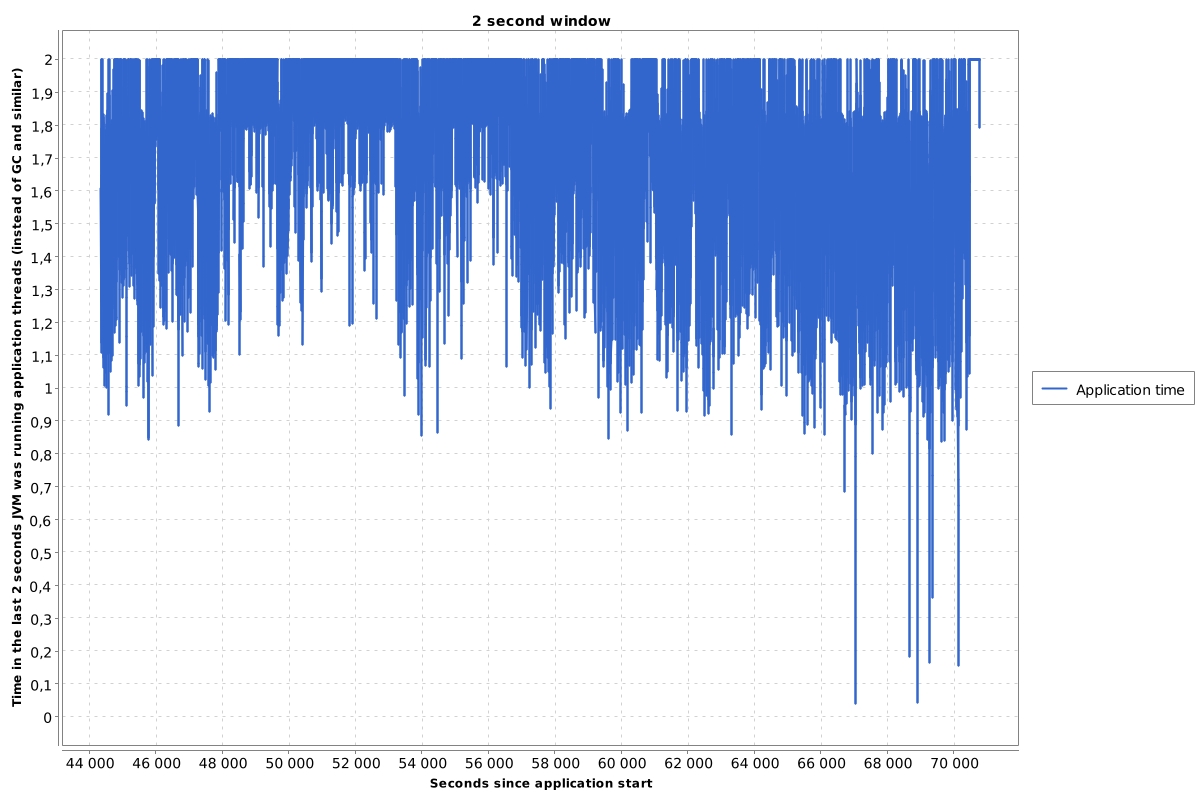
This example shows the application which doesn’t work at all on the JVM:
Safepoints statistics
If we know that our application doesn’t work well on the JVM we can generate statistics that show us, which STW phase is responsible for that issue.
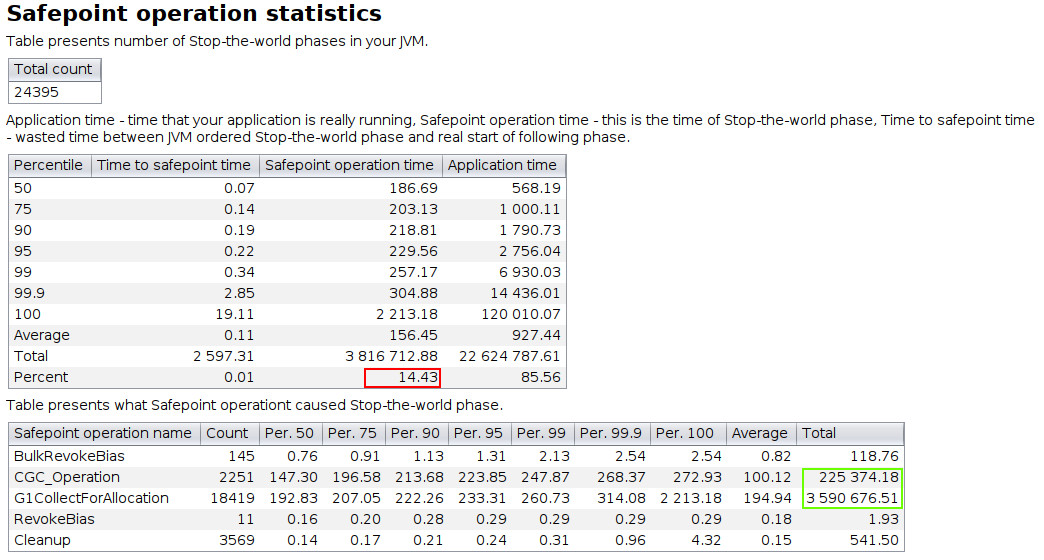
These tables show that 14,43% (marked as red) of total application time our JVM executes operations in STW phase. This value should be less than 1%. The two most time-consuming operations are (marked as green):
- G1CollectForAllocation
- CGC_Operation
Both operations are related to G1GC.
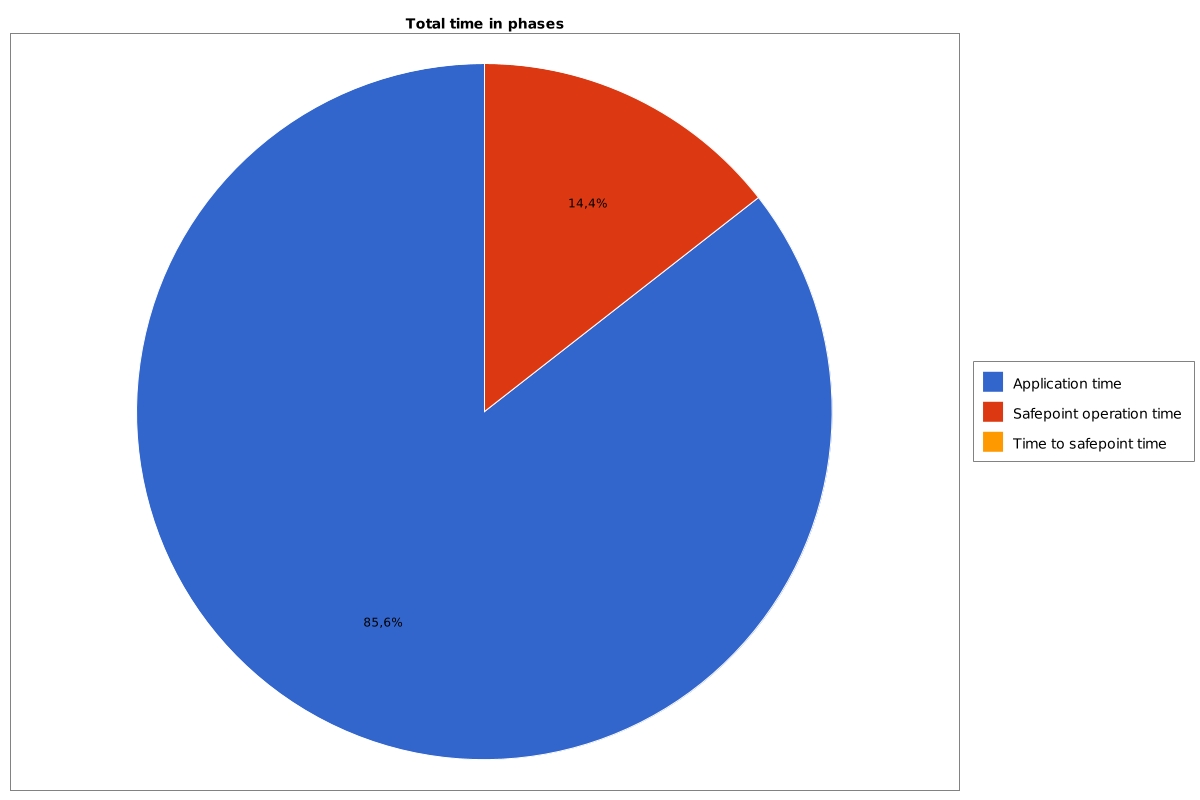
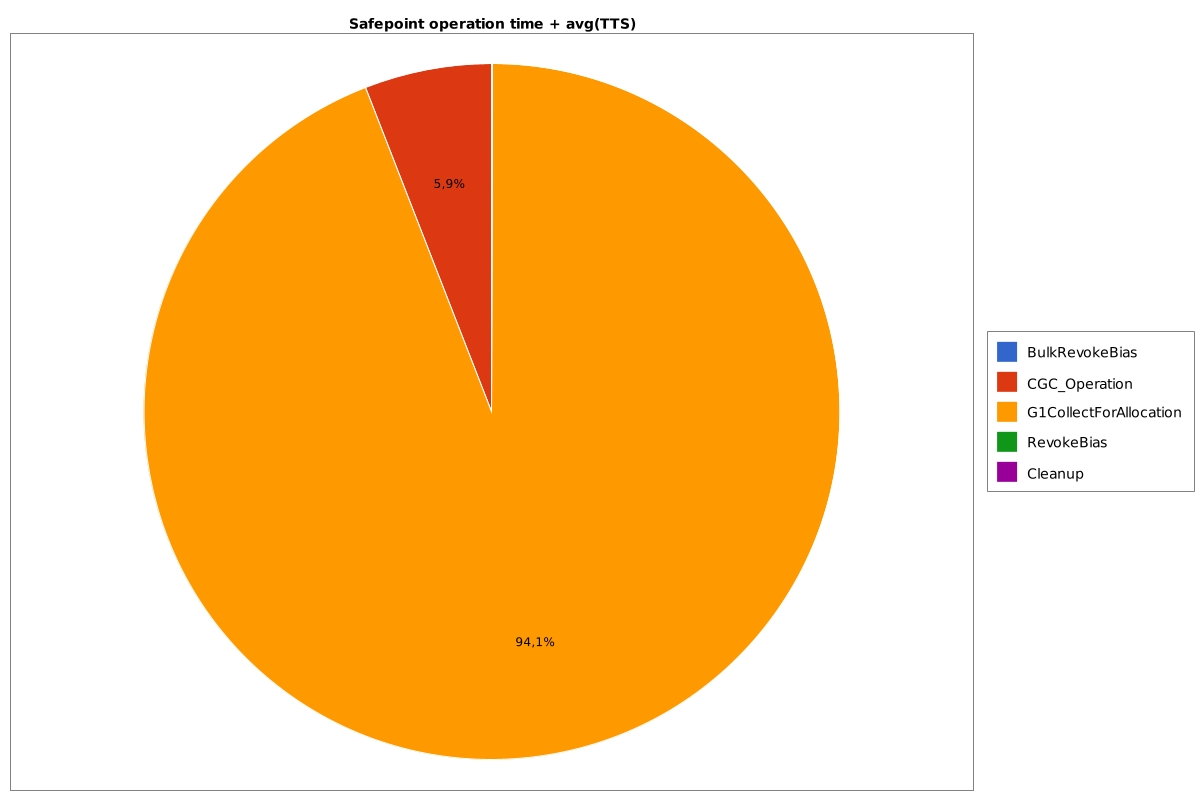
We can also present this statistics as charts:
Total time in phases
Which safepoint operation is most time-consuming
Why are safepoint logs so important?
Most Java developers think that the STW phase is needed for Garbage Collector. Yes, most of the issues on JVM level are related to GC, but not all of them. If you have an issue with:
- other safepoint opperation, not related to GC
- time to safepoint
you will not find the cause in the GC logs, you need safepoints logs.